

IMPROVING LIVES THROUGH DATA ECOSYSTEMS
Endumeni
Quick Fact
2,38% Population growth rate.
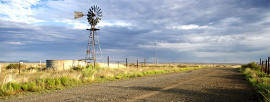
Situated in the Umzinyathi District Municipality in the north-western part of KwaZulu-Natal, Endumeni Local Municipality is home to a population that is predominantly urban, with only 16,8% living in non-urban areas. The towns of Dundee, Glencoe and Wasbank house most of the urban population of Endumeni. Wasbank is located at the foot of the Indumeni mountain, an inactive volcano.
(Source: www.endumeni.gov.za).
| Rank view all | ||
|---|---|---|
| Kai !Garib , Northern Cape | 65,869 | 151 |
| Richmond , KwaZulu-Natal | 65,793 | 152 |
| Inxuba Yethemba , Eastern Cape | 65,560 | 153 |
| Endumeni , KwaZulu-Natal | 64,862 | 154 |
| Sakhisizwe , Eastern Cape | 63,582 | 155 |
| Masilonyana , Free State | 63,334 | 156 |
| Mkhambathini , KwaZulu-Natal | 63,142 | 157 |
Quick Fact
7% of people aged 20 years and older have had no schooling.

Endumeni Local Municipality is one of the municipalities that are better off, with educational levels that are significantly higher than those of other municipalities. Only 7% of people (aged 20 years and older) reported to have had no education, which is far below those levels reported by other municipalities, such as Msinga with 41,2%. The primary school enrollment rate is significantly high, with 88,3% of young people enrolled within the district.
This shows the high level of accessibility to educational facilities and to education itself. 31,9% of the population aged 20 years and older were found to have completed matric in 2011. This will provide better opportunities for the population in future, as education is linked to better employment and better earning, hence improving the standard of living for the population as a whole.
| Group | Percentage |
|---|---|
| Black African | 83,9% |
| Coloured | 2,6% |
| Indian/Asian | 5,9% |
| White | 7,2% |
| Other | 0,4% |
| Age | Males | Females |
|---|---|---|
| 0-4 | 5,3% | 5,3% |
| 5-9 | 5,1% | 5,3% |
| 10-14 | 5,3% | 5,1% |
| 15-19 | 5,5% | 5,3% |
| 20-24 | 5,3% | 4,9% |
| 25-29 | 4,8% | 4,7% |
| 30-34 | 3,6% | 3,4% |
| 35-39 | 3,1% | 3,2% |
| 40-44 | 2,5% | 2,8% |
| 45-49 | 2,1% | 2,1% |
| 50-54 | 1,7% | 2,1% |
| 55-59 | 1,5% | 1,8% |
| 60-64 | 1,1% | 1,4% |
| 65-69 | 0,8% | 1,1% |
| 70-74 | 0,5% | 0,8% |
| 75-79 | 0,3% | 0,5% |
| 80-84 | 0,1% | 0,3% |
| 85+ | 0,1% | 0,3% |
| Language | Percentage |
|---|---|
| Afrikaans | 5,1% |
| English | 11,8% |
| IsiNdebele | 0,9% |
| IsiXhosa | 0,2% |
| IsiZulu | 76,3% |
| Sepedi | 0,2% |
| Sesotho | 0,6% |
| Setswana | 0,4% |
| Sign Language | 0,2% |
| SiSwati | 0,1% |
| Tshivenda | 0% |
| Xitsonga | 0,1% |
| Other | 0.6% |
| Not Applicable | 3,5% |
| Group | Percentage |
|---|---|
| Married | 17% |
| Living together like married partners | 6,7% |
| Never married | 72,7% |
| Widower/Widow | 2,7% |
| Separated | 0,3% |
| Divorced | 0,7% |
| Group | Percentage |
|---|---|
| No Schooling | 2,6% |
| Some Primary | 42,5% |
| Completed Primary | 5,8% |
| Some Secondary | 29,8% |
| Completed Secondary | 13,6% |
| Higher Education | 1,2% |
| Not Applicable | 4,5% |
| Sex | Percentage |
|---|---|
| Female | 51,2% |
| Male | 48,8% |
Quick Fact
79,1% Access to electricity for lighting.
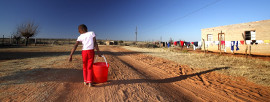
Just over 87% of the population of Endumeni lives in formal urban housing with 3,1% of the community living in traditional housing and 13,8% on rural farms. In comparison to the rest of the district municipality, the people of Endumeni are generally better off in terms of access to service infrastructure: 79,1% of households have access to electricity for lighting, while 61,9% have access to piped water within the dwelling.
| Area | Percentage |
|---|---|
| Urban | 83,2% |
| Tribal/Traditional | 3,1% |
| Farm | 13,8% |
| Item | Yes | No |
|---|---|---|
| Cellphone | 88,9% | 11,1% |
| Computer | 17,9% | 82,1% |
| Television | 71,6% | 28,4% |
| Satellite Television | 25,2% | 74,8% |
| Radio | 74% | 26% |
| Landline / Telephone | 16,9% | 83,1% |
| Motor Car | 31,3% | 68,7% |
| Refrigerator | 63,7% | 36,3% |
| Electric / Gas-Stove | 71,2% | 28,8% |
| Energy Source | Cooking | Heating | Lighting |
|---|---|---|---|
| Electricity | 67,8% | 53,7% | 79,1% |
| Gas | 6% | 4,6% | 0,3% |
| Paraffin | 8,8% | 6,4% | 0,7% |
| Solar | 0,2% | 0,1% | 0,3% |
| Candles | 0% | 0% | 19,3% |
| Wood | 8,1% | 10,8% | 0% |
| Coal | 8,3% | 9,7% | 0% |
| Animal Dung | 0,3% | 0,4% | 0% |
| Other | 0,1% | 0% | 0% |
| None | 0,4% | 14,3% | 0,4% |
| Access | Percentage |
|---|---|
| From Home | 7% |
| From Cellphone | 16,3% |
| From Work | 3,4% |
| From Elsewhere | 2,3% |
| No Access | 71% |
| Tenure Status | Percentage |
|---|---|
| Rented | 31,8% |
| Owned and fully paid off | 46,3% |
| Owned but not yet paid off | 9,5% |
| Occupied rent free | 10,1% |
| Other | 2,2% |
| Source of water | Percentage |
|---|---|
| Regional/Local water scheme (operated by municipality or other water services provider) | 84,8% |
| Borehole | 6,6% |
| Spring | 1,3% |
| Rain water tank | 0,3% |
| Dam/Pool/Stagnant water | 1,5% |
| River/Stream | 1,3% |
| Water vendor | 0,4% |
| Water tanker | 3% |
| Other | 1% |
| Toilet Facility | Percentage |
|---|---|
| None | 4,1% |
| Flush toilet (connected to sewerage system) | 76,1% |
| Flush toilet (with septic tank) | 3,9% |
| Chemical toilet | 0,8% |
| Pit toilet with ventilation | 5% |
| Pit toilet without ventilation | 8,2% |
| Bucket toilet | 0,2% |
| Other | 1,7% |
| Refuse Disposal | Percentage |
|---|---|
| Removed by local authority/private company at least once a week | 76,7% |
| Removed by local authority/private company less often | 1% |
| Communal refuse dump | 1,6% |
| Own refuse dump | 17,2% |
| No rubbish disposal | 2,9% |
| Other | 0,7% |
| Refuse Disposal | Percentage |
|---|---|
| Removed by local authority/private company at least once a week | 76,7% |
| Removed by local authority/private company less often | 1% |
| Communal refuse dump | 1,6% |
| Own refuse dump | 17,2% |
| No rubbish disposal | 2,9% |
| Other | 0,7% |
Quick Fact
26,4% Unemployment rate.
Endumeni Local Municipality has the smallest population but the largest economy when compared to other local authorities in the district. Of the 20 693 economically active (i.e., employed or unemployed but looking for work) individuals in the municipality, 26,4% are unemployed. The unemployment rate among the economically active youth (15 – 34 years) in the municipality is much higher, at 36,2%.
| Employment Status | Number |
|---|---|
| Employed | 15228 |
| Unemployed | 5465 |
| Discouraged Work Seeker | 2222 |
| Not Economically Active | 18444 |
| Income | Percentage |
|---|---|
| None income | 12,4% |
| R1 - R4,800 | 4,4% |
| R4,801 - R9,600 | 7,7% |
| R9,601 - R19,600 | 19,4% |
| R19,601 - R38,200 | 18,7% |
| R38,201 - R76,4000 | 13,5% |
| R76,401 - R153,800 | 10,2% |
| R153,801 - R307,600 | 8% |
| R307,601 - R614,400 | 4,2% |
| R614,001 - R1,228,800 | 1% |
| R1,228,801 - R2,457,600 | 0,2% |
| R2,457,601+ | 0,2% |
| Agricultural households | |
|---|---|
| Type of specific activity | Number |
| Livestock production | 1,175 |
| Poultry production | 1,418 |
| Vegetable production | 1,310 |
| Production of other crops | 300 |
| Other | 287 |
**An agricultural household may engage in more than one agricultural activity
| Agricultural households | |
|---|---|
| Type of activity | Number |
| Crops only | 1,022 |
| Animals only | 1,560 |
| Mixed farming | 524 |
| Other | 78 |
**An agricultural household may not fall under more than one agricultural activity
| Income category of agricultural households | |
|---|---|
| Annual income category of agricultural household heads | Number |
| No income | 709 |
| R1-R4 800 | 149 |
| R4 801-R38 400 | 1,530 |
| R38 401-R307 200 | 649 |
| R307 201+ | 91 |
| Unspecified | 56 |
| Agricultural households municipal data per province |
|---|
| Western Cape (download) |
| Eastern Cape (download) |
| Northern Cape (download) |
| Free State (download) |
| KwaZulu-Natal (download) |
| North West (download) |
| Gauteng (download) |
| Mpumalanga (download) |
| Limpopo (download) |
**Please note that each province contains twenty five tables
Place names
Key Statistics 2011
| Total population | 64,862 |
| Young (0-14) | 31,4% |
| Working Age (15-64) | 63,8% |
| Elderly (65+) | 4,8% |
| Dependency ratio | 56,8 |
| Sex ratio | 95,2 |
| Growth rate | 2,38% (2001-2011) |
| Population density | 40 persons/km2 |
| Unemployment rate | 26,4% |
| Youth unemployment rate | 36,2% |
| No schooling aged 20+ | 7% |
| Higher education aged 20+ | 10,7% |
| Matric aged 20+ | 31,8% |
| Number of households | 16,851 |
| Number of Agricultural households | 3,184 |
| Average household size | 3,7 |
| Female headed households | 42,3% |
| Formal dwellings | 87,1% |
| Housing owned/paying off | 55,8% |
| Flush toilet connected to sewerage | 76,1% |
| Weekly refuse removal | 76,7% |
| Piped water inside dwelling | 61,9% |
| Electricity for lighting | 79,1% |
Key Statistics 2001
| Total population | 51,101 |
| Young (0-14) | 31,9% |
| Working Age (15-64) | 63,8% |
| Elderly (65+) | 4,4% |
| Dependency ratio | 57% |
| Sex ratio | 96,5 |
| Growth rate | 2,81% (2001-2011) |
| Unemployment rate | 46% |
| Youth unemployment rate | 56,5% |
| No schooling aged 20+ | 15,5% |
| Higher education aged 20+ | 7,8% |
| Matric aged 20+ | 22,2% |
| Number of households | 12,278 |
| Average household size | 3,8 |
| Female headed households | 40,1% |
| Formal dwellings | 81,7% |
| Housing owned/paying off | 49,6% |
| Flush toilet connected to sewerage | 74,8% |
| Weekly refuse removal | 68,4% |
| Piped water inside dwelling | 36,9% |
| Electricity for lighting | 67,8% |