

September was a busy month for Stats SA’s publication schedule. The statistical agency published 25 statistical releases, with several providing quarterly and annual updates.
Provincial and national GDP
Stats SA released its latest provincial gross domestic product (GDP) estimates, for the period 2013 to 2024. Six of the nine provinces experienced an increase in economic activity in 2024, with Limpopo, Gauteng and Western Cape registering the highest growth rates. The finance industry was the most significant positive contributor to growth in all provinces.
The latest national GDP estimates paint a positive picture for the second quarter of 2025. The economy grew by 0,8%, lifted mainly by manufacturing, mining and trade. Five other industries also contributed positively. On the downside, construction and transport contracted. Construction recorded its third consecutive quarter of decline.
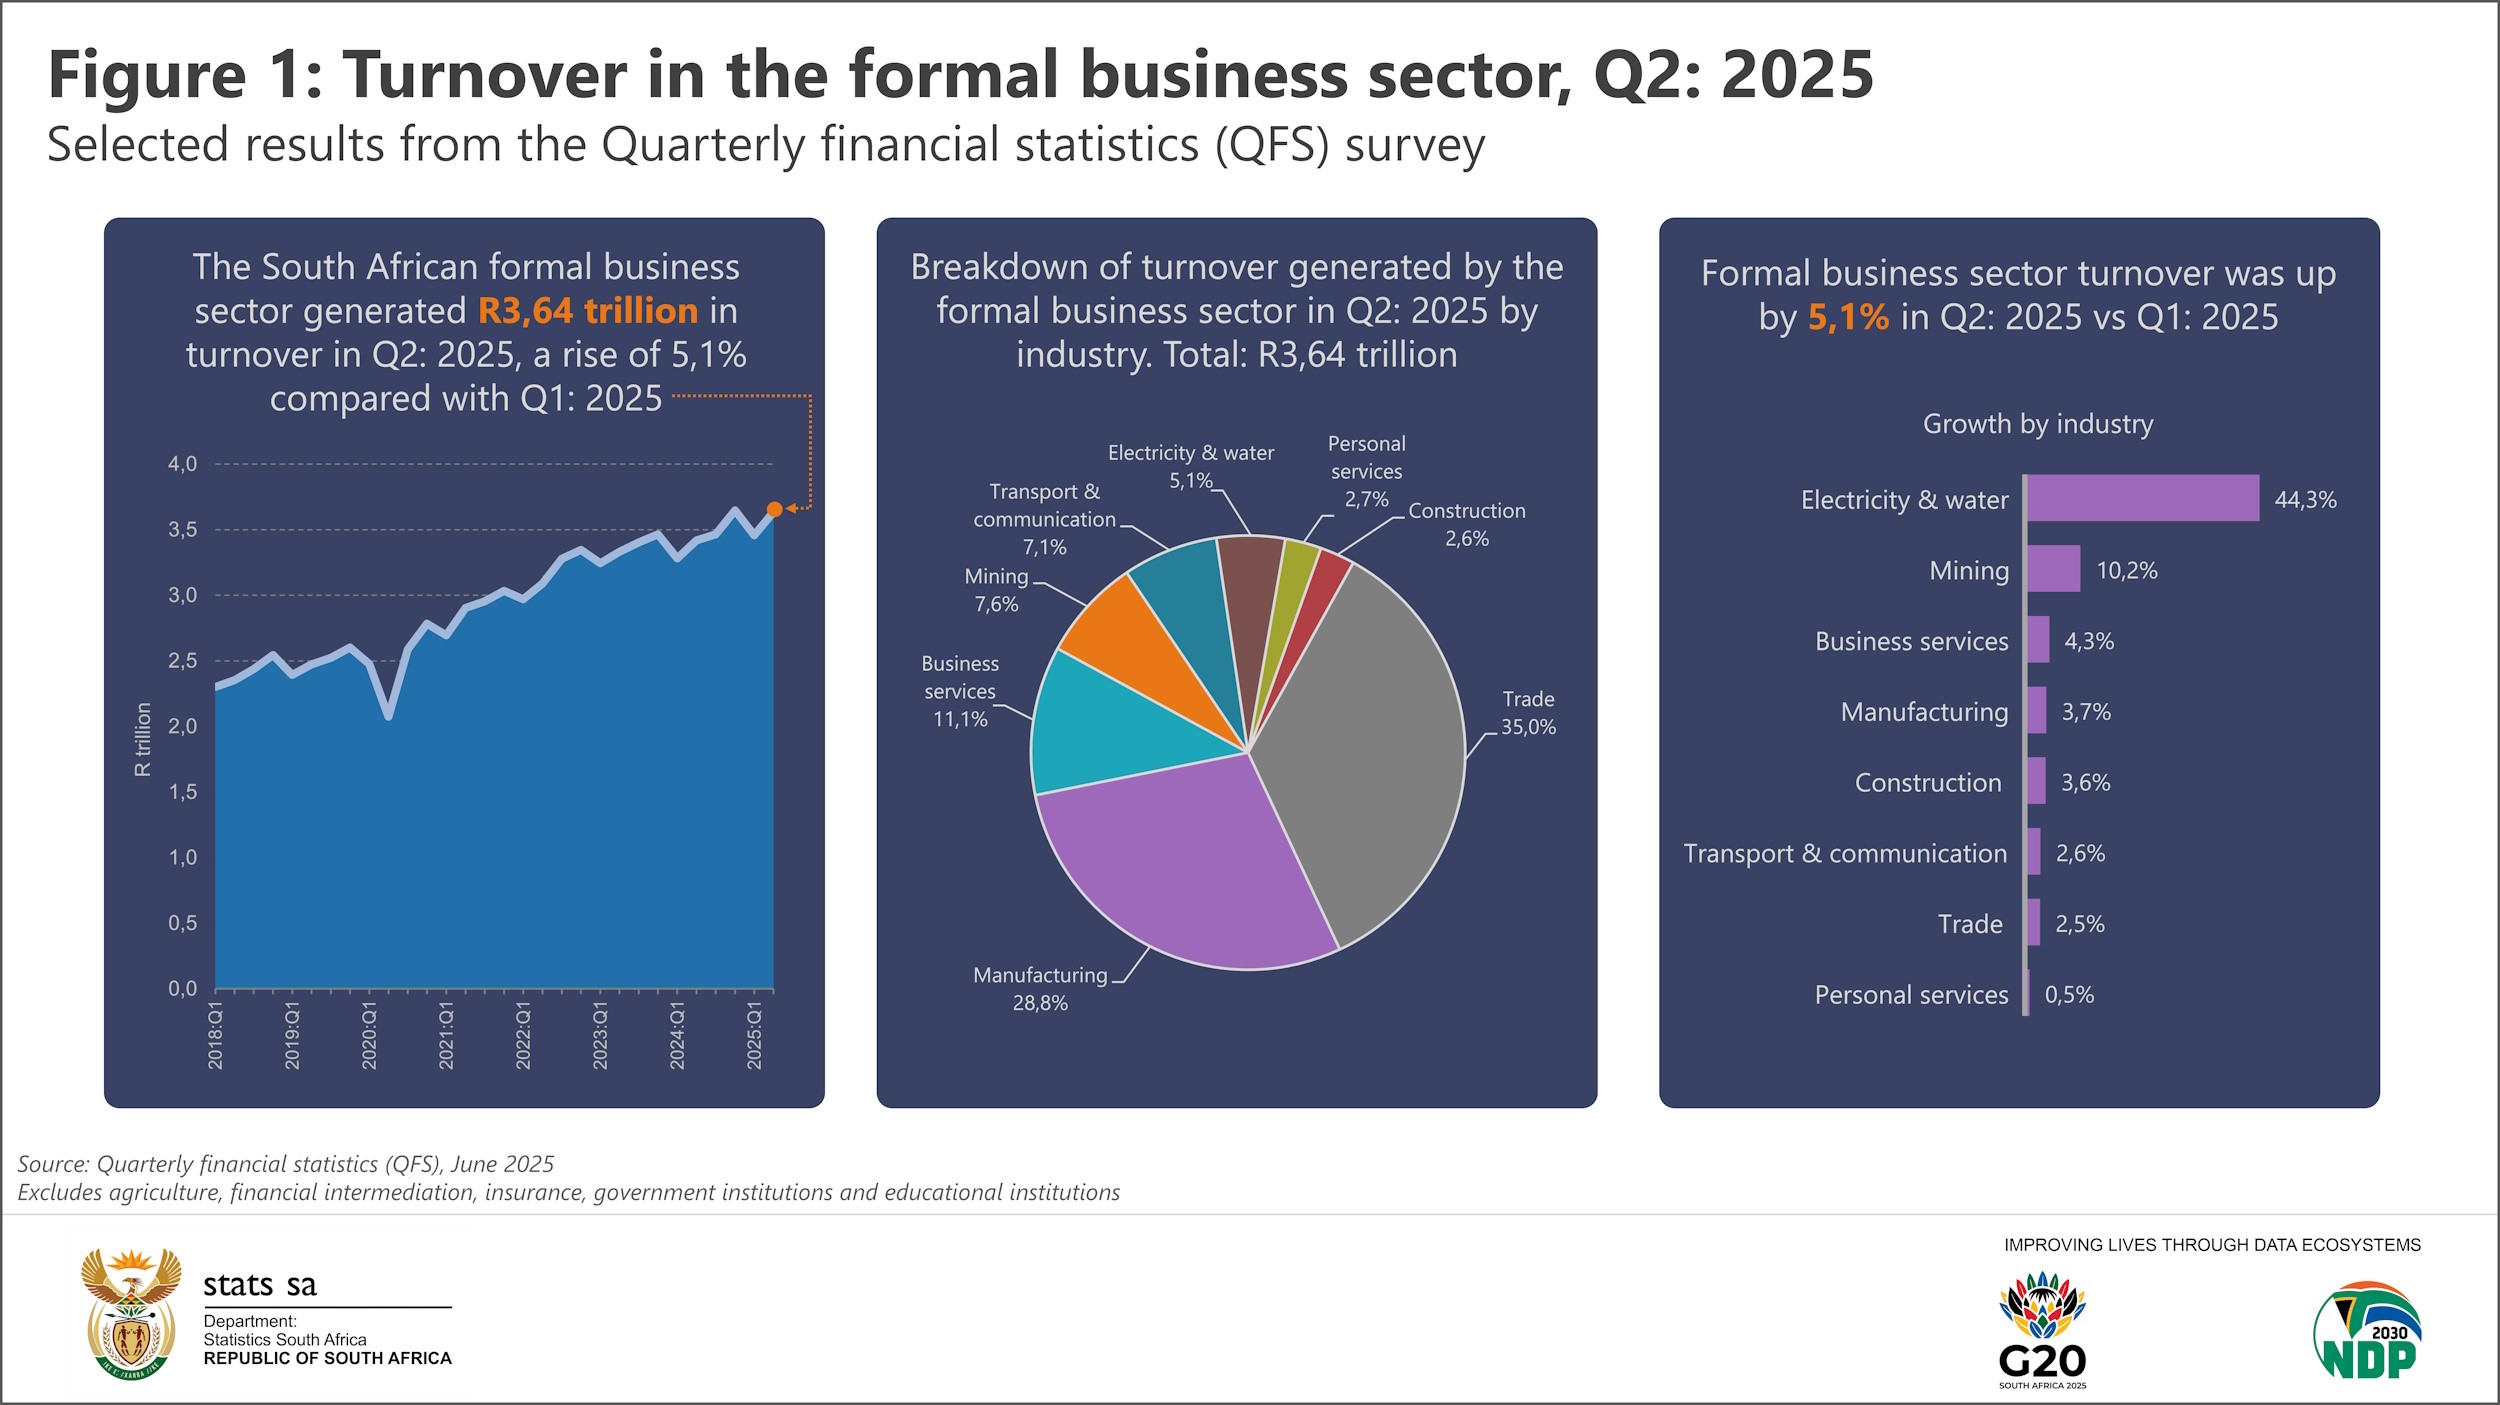
Turnover in the formal-business sector was also positive in the second quarter, growing by 5,1% compared with the first quarter. All eight industries covered by the Quarterly financial statistics (QFS) survey recorded increases, with electricity, gas & water expanding by 44,3% (Figure 1).
Despite the growth in turnover, formal-business employment disappointed in the second quarter compared with the first quarter. Employment declined by 0,8% (80 000 jobs). The most significant decline was recorded by the community services industry, with further job losses occurring in trade, manufacturing, construction, transport and business services. Mining and electricity experienced a rise in employment, but this was not enough to offset losses in other industries.
The latest economic indicators
Leaving the second quarter, the latest monthly economic indicators for July were mostly positive year-on-year. Mining; construction (buildings completed as reported by large municipalities); retail trade; motor trade; tourist accommodation; restaurants, catering & fast food; road freight transport; and passenger transport (both rail and road) were stronger (Figure 2).
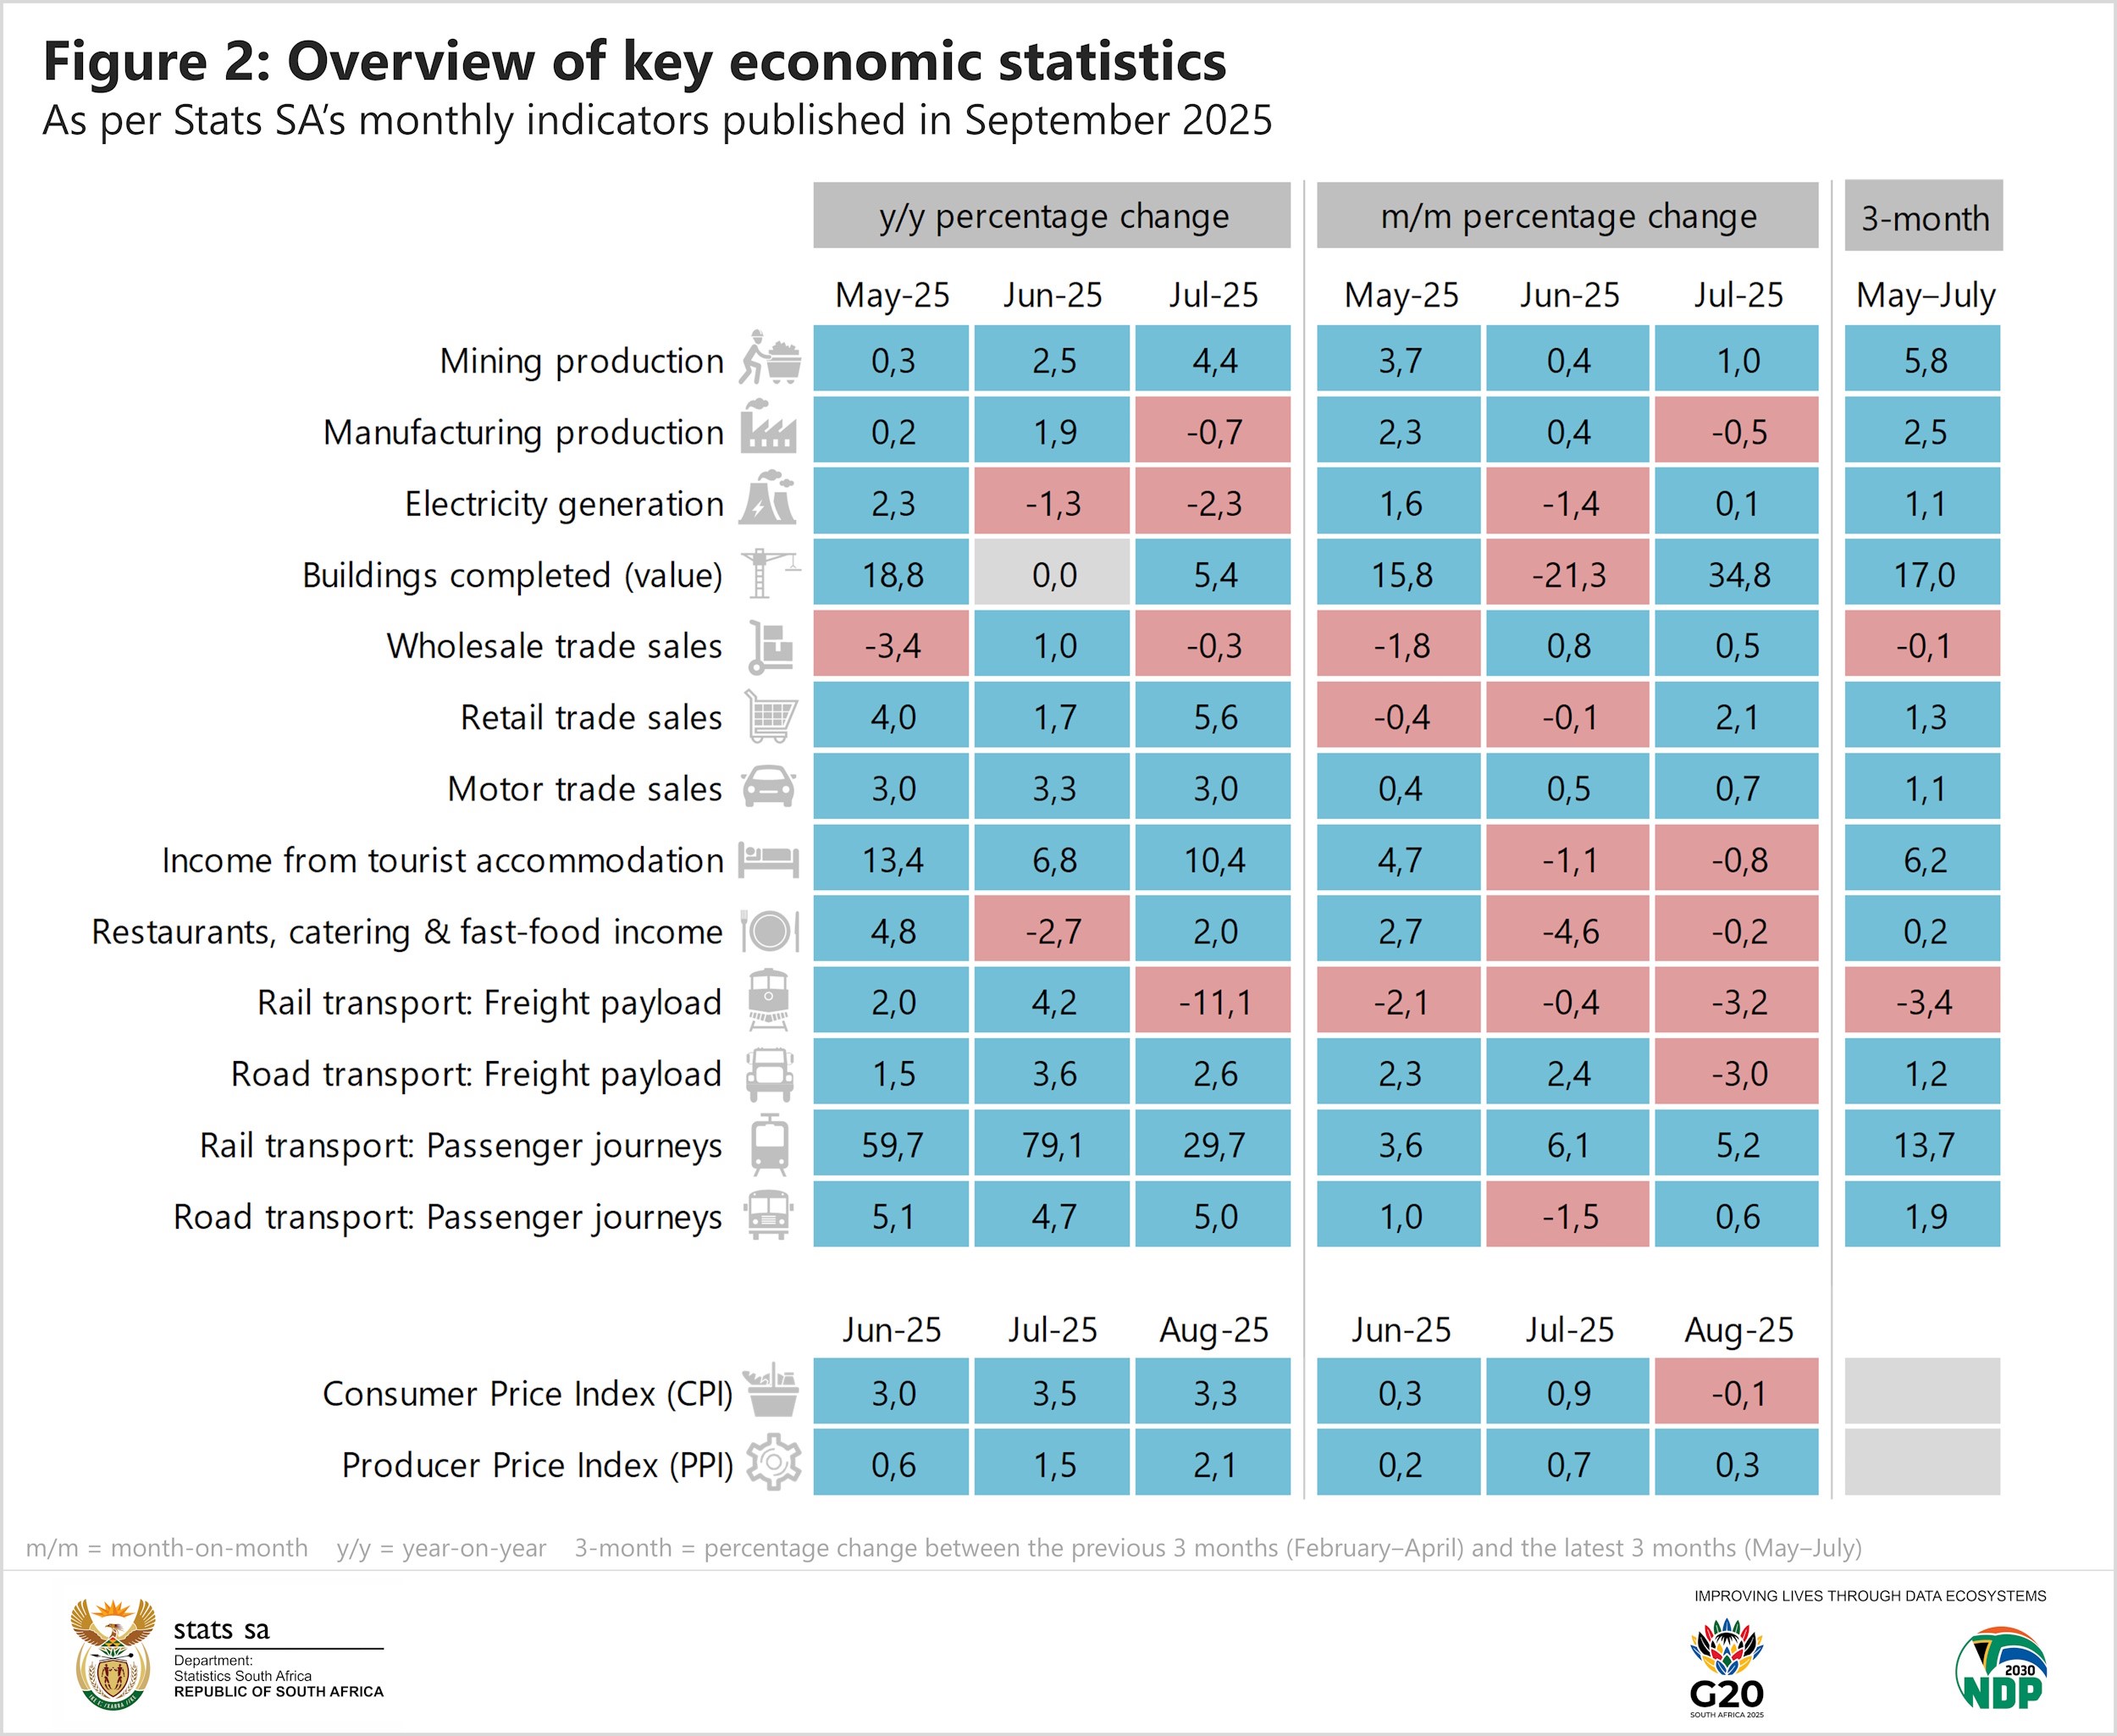
Mining output increased by 4,4% year-on-year, with iron ore and platinum group metals the most significant positive contributors. Diamonds, chromium ore and coal also recorded gains. However, the industry produced less gold, manganese ore, copper and nickel.
Retail trade continued an upward trajectory, rising by 5,6%. Five of the seven retail groups recorded a positive month, with textiles & clothing and general dealers the main drivers of growth. Retailers in food & beverages and pharmaceuticals & medical goods registered a decline in sales.
Manufacturing, electricity generation, wholesale trade, and rail freight transport were weaker year-on-year. Manufacturing activity decreased by 0,7%, with seven of the ten manufacturing divisions recording a decline in production.
Tourism, gambling and provincial government in the spotlight
September was Tourism Month, providing Stats SA with an opportunity to showcase tourism-related data from several statistical releases. These include data on tourism’s contribution to GDP (which was 3,5% in 2022); the number of visitors gracing our shores; domestic tourism; and the accommodation industry.
Stats SA also took a deep dive into gambling and betting statistics in September, drawing on data from several sources. The key takeaway is that gambling and betting activities have grown sharply. South Africa has ten gambling boards that regulate the industry, each with their own unique financial profile. According to data from the latest Financial statistics of extra-budgetary accounts and funds statistical release, the Free State Gambling, Liquor & Tourism Authority received the bulk of its revenue from government, while the Gauteng Gambling Board obtained most of its income from other sources (such as licence fees, levies, etc.).
The annual Financial statistics of provincial government statistical release was published in September. Expenses by South Africa’s 120 provincial government departments increased by 4,9% in 2023/24 compared with 2022/23, rising by R32,6 billion from R671,6 billion to R704,2 billion. Compensation of employees was the largest cost driver, increasing by R21,7 billion (+5,1%) from R428,8 billion to R450,5 billion.
Interested to know more? Keep up to date with our publication schedule here. For a comprehensive list of products and releases, download our catalogue here. For a regular update of indicators and infographics, visit our data story feed and download the latest edition of the Stats Biz newsletter.