

Gambling and betting are on the rise. Not only is this supported by data from the National Gambling Board, but it has also emerged in economic and household findings from Stats SA.
The great switch
The industry is booming, according to the National Gambling Board of South Africa.1 Gross gambling revenue2 was R59,3 billion in the 2023/24 financial year, representing a 25,7% rise from R47,2 billion in 2022/23. This also marks a sharp increase from R34,4 billion in 2021/22 and R23,3 billion in 2020/21.
Betting drove the jump in 2023/24, with growth in the casino industry being flat. Casinos were once the most popular form of gambling, boasting 84% of market share in 2009/10, while betting accounted for 10%. Over time, betting expanded its influence, finally dethroning casinos during the COVID-19 pandemic to become the dominant form of gambling. Its rise has remained unabated.
Bookmaker and online gambling are off to the races
Stats SA’s recent report on the personal services industry confirms these findings.3 The report showcases financial data for almost 100 economic activities across several industries, including education, health, entertainment and recreation. Enterprises that provide bookmaker and online gambling services, casino services, gambling slot machines, as well as lottery and off-track betting options are also included.4
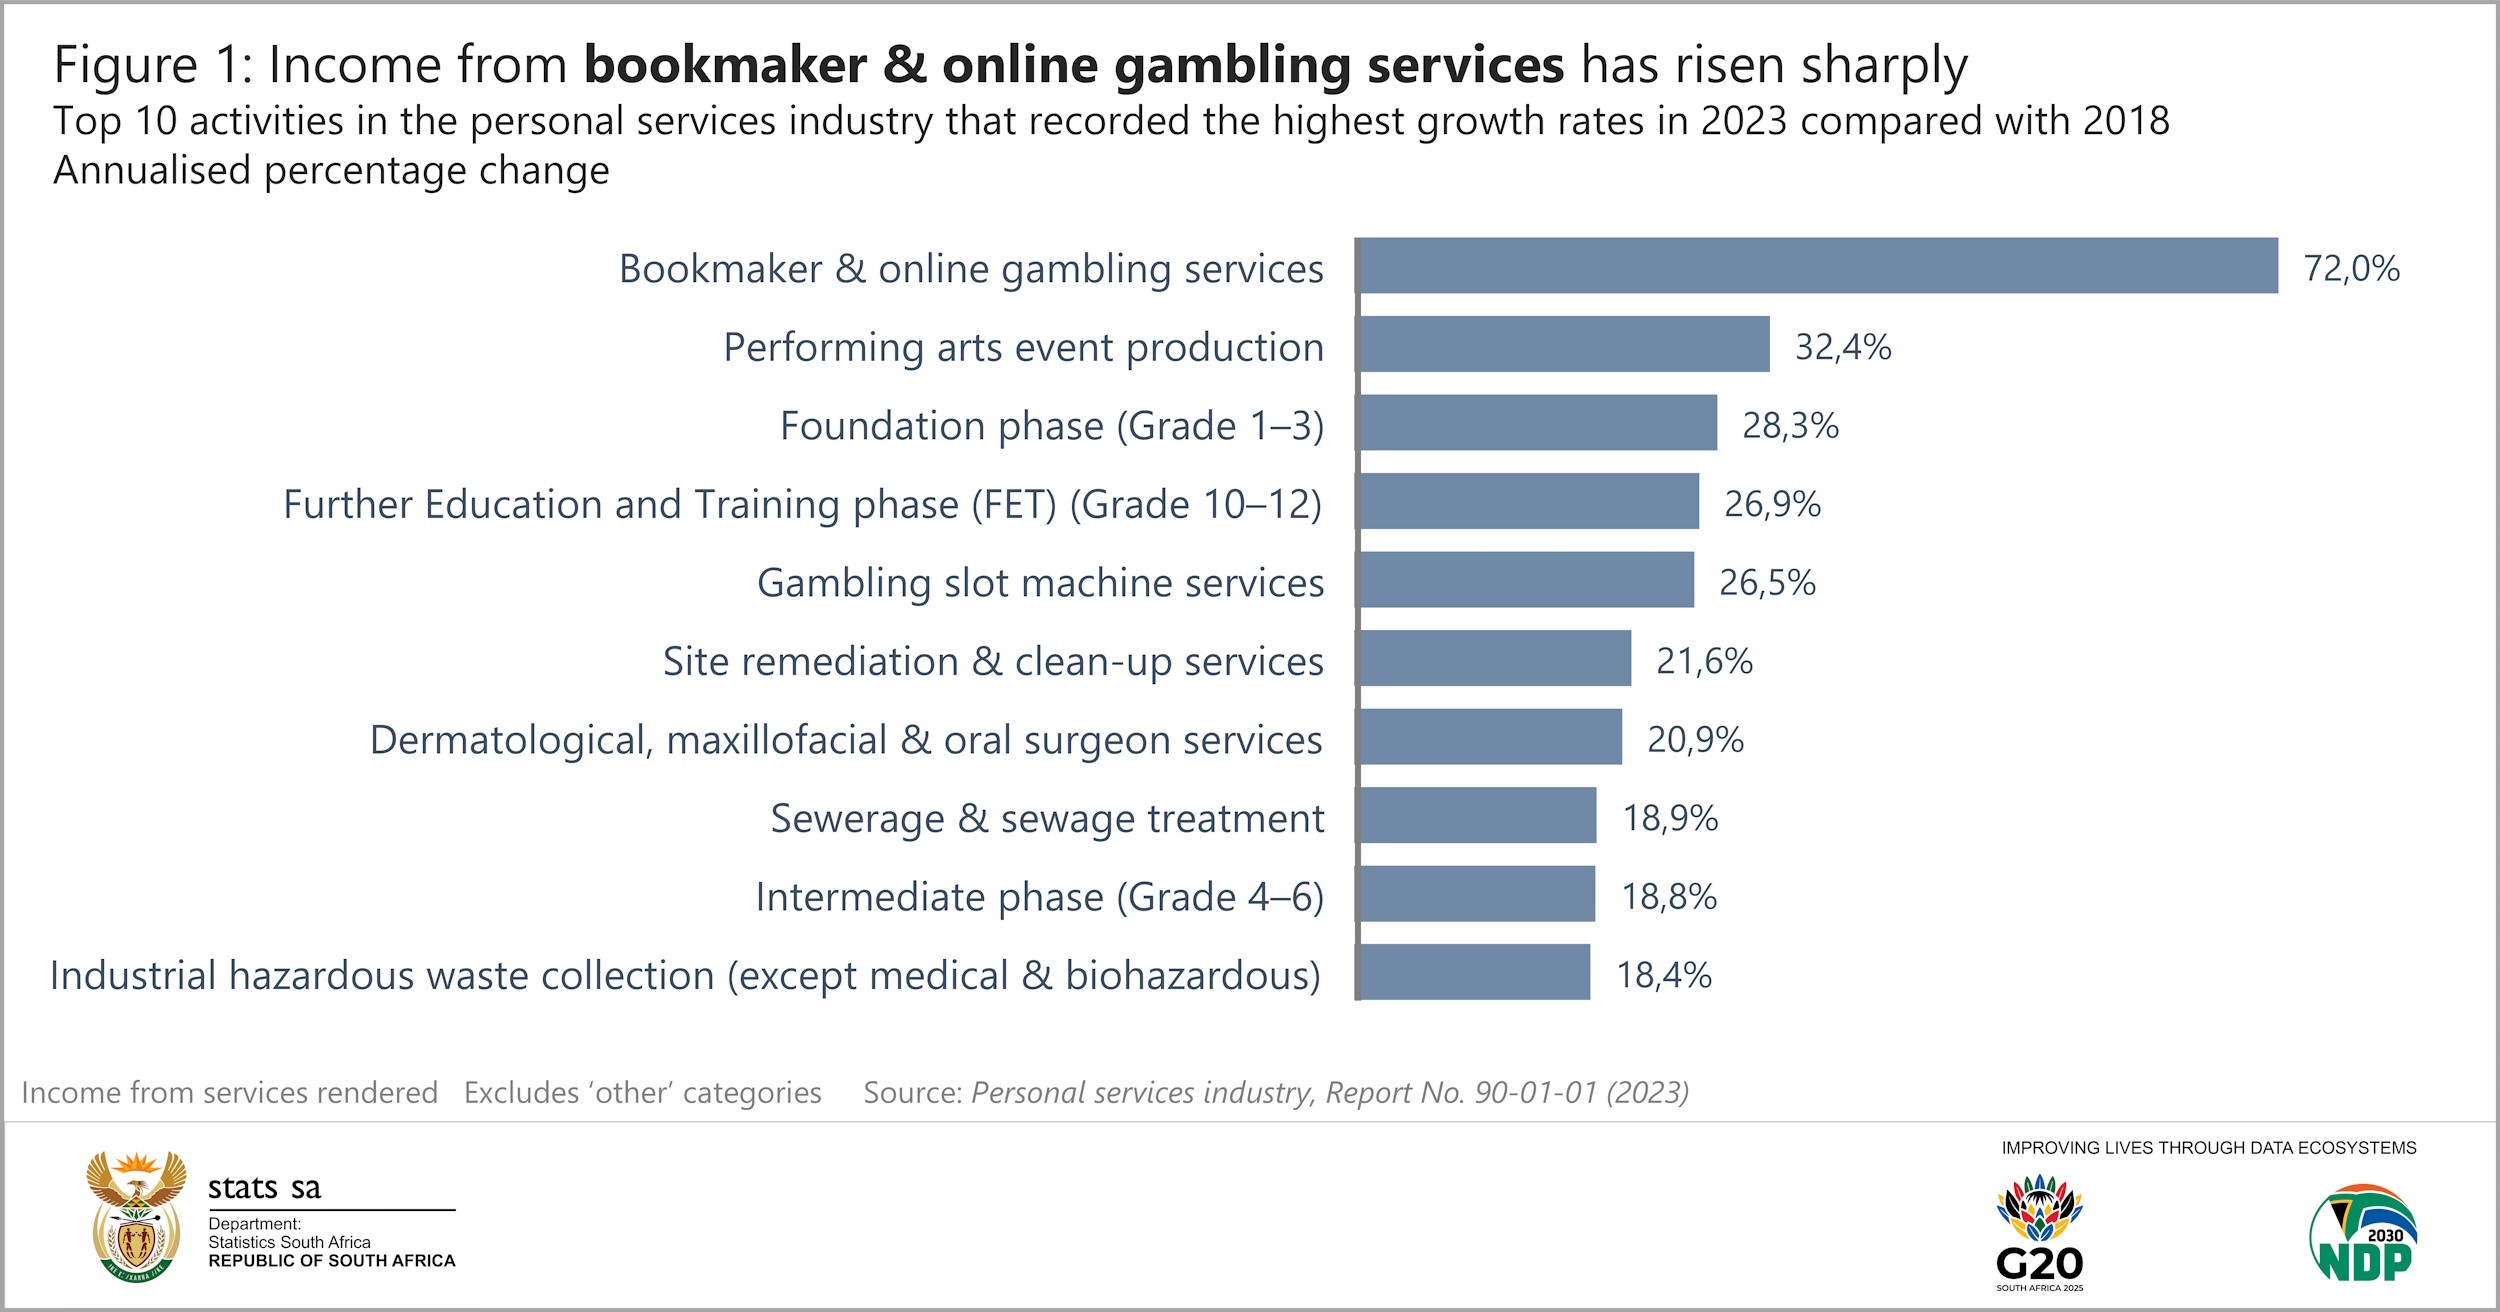
Figure 1 highlights the top 10 activities based on annualised percentage growth in income between 2018 and 2023. Bookmaker and online gambling services experienced a rapid surge in income during this period, outpacing all other activities. Gambling slot machine services also feature in the top 10.
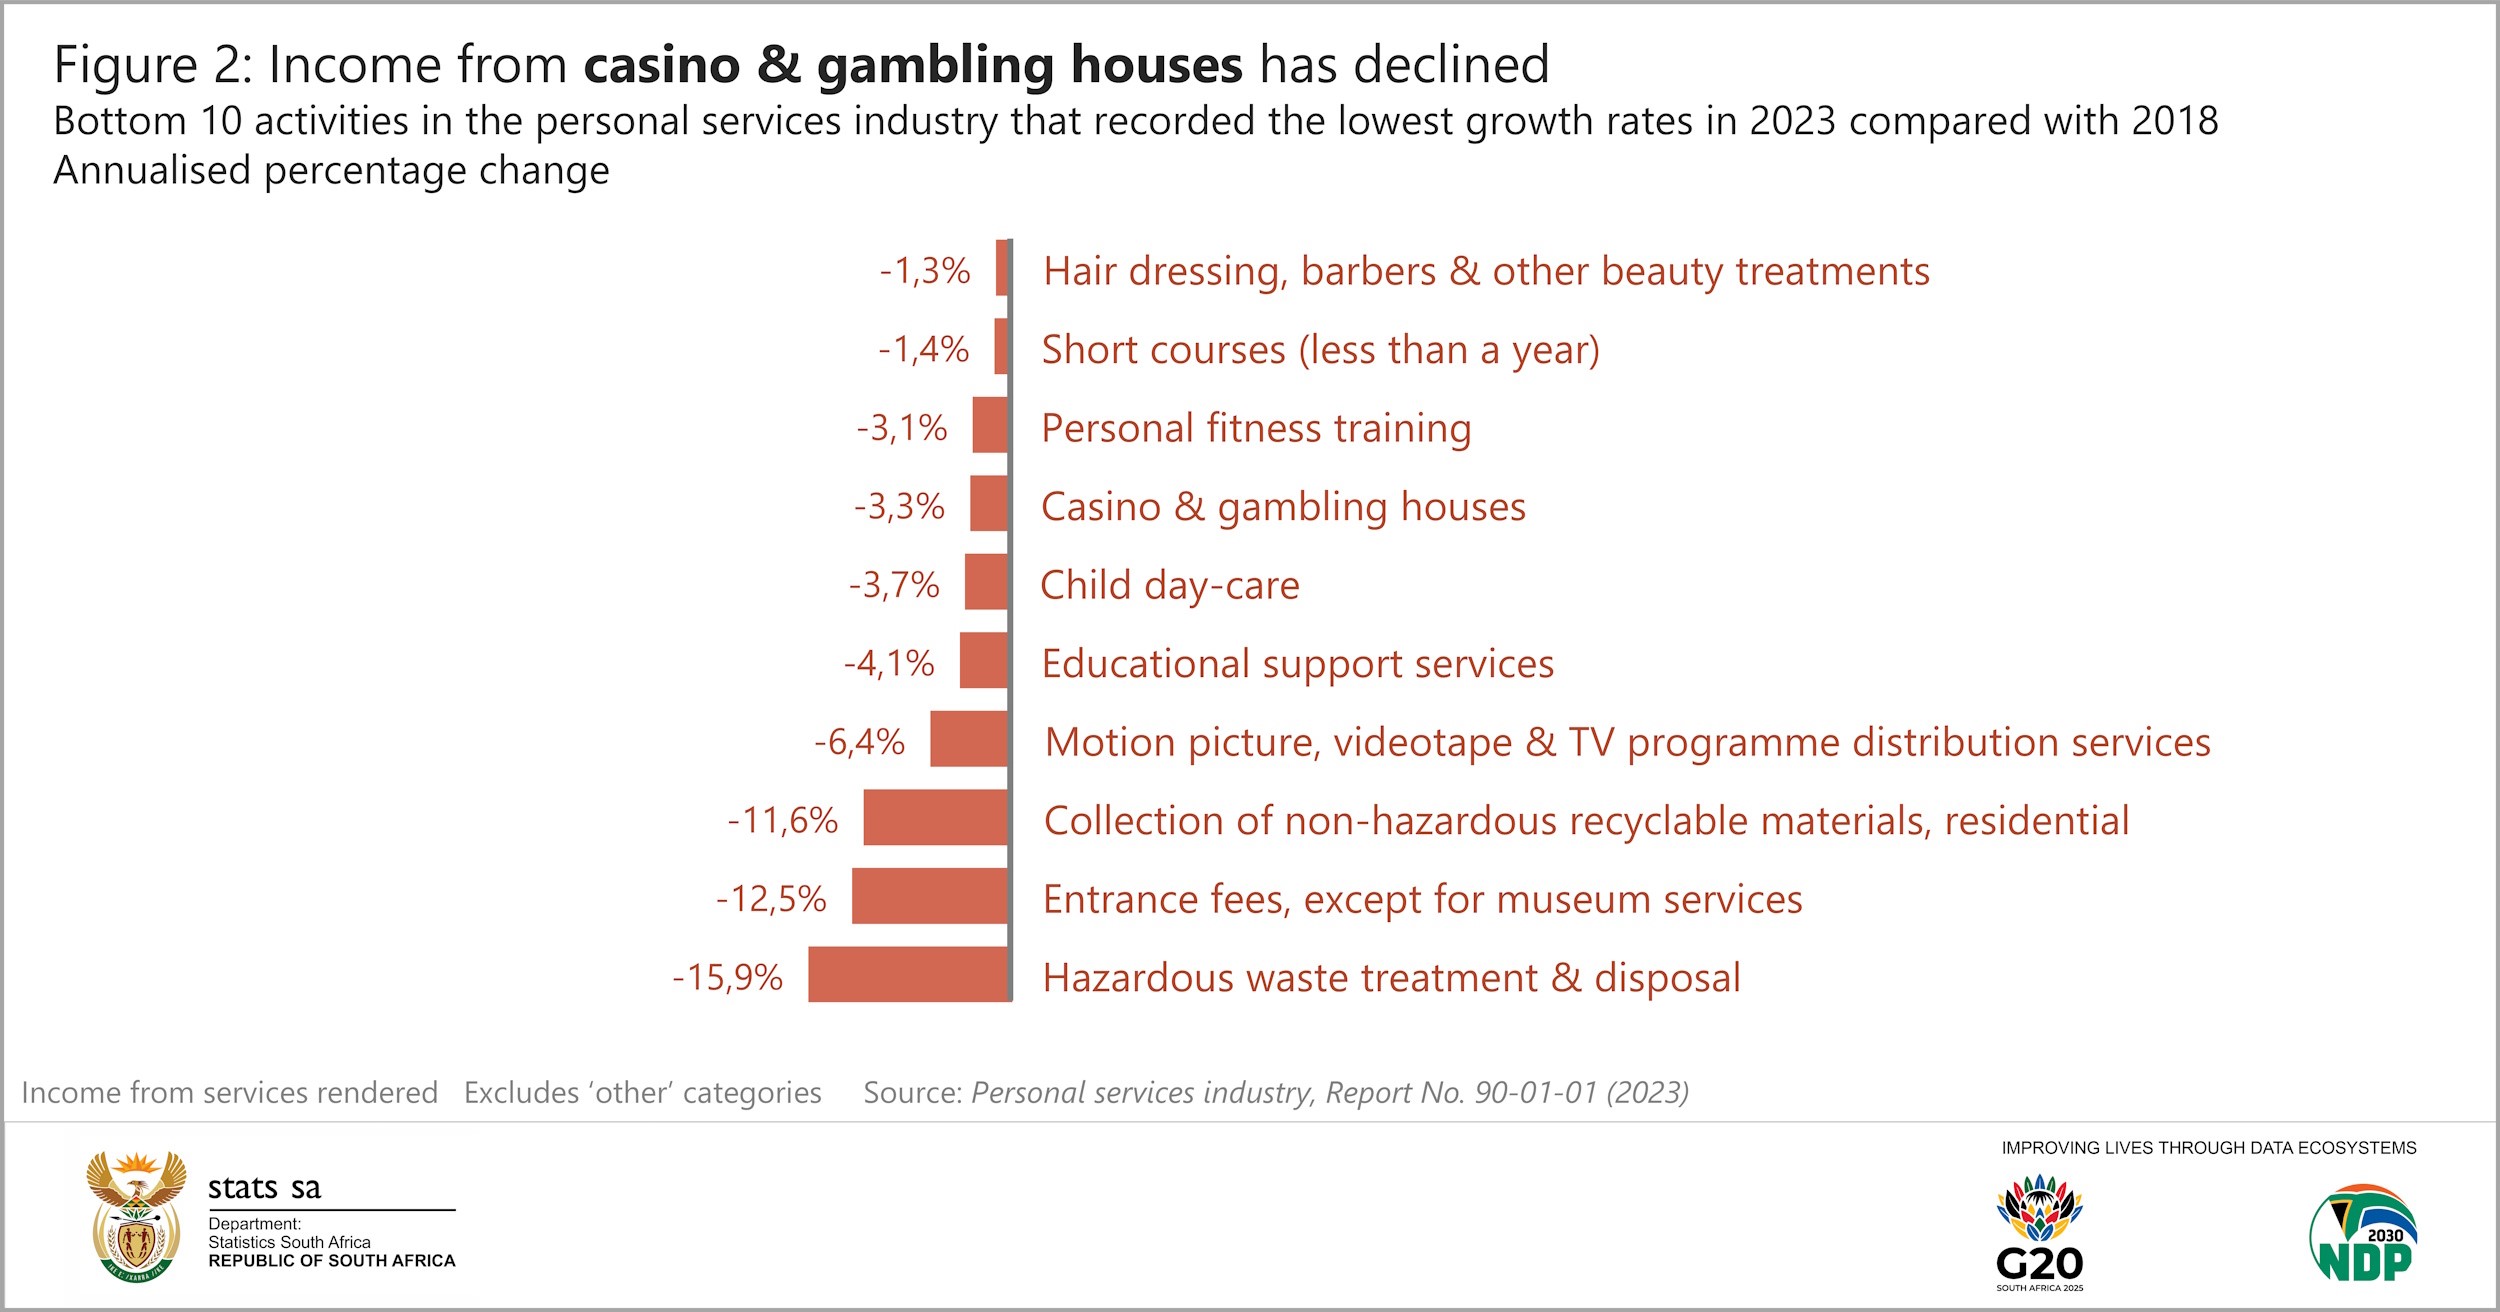
Casino and gambling houses are again the losers, registering a decline of 3,3% per annum over the same period. This places the activity among the bottom 10 worst performers (Figure 2).
Translating the above in rand terms, bookmaker and online gambling services generated R152,6 billion in 2023 from services rendered – sharply up from R10,1 billion in 2018.
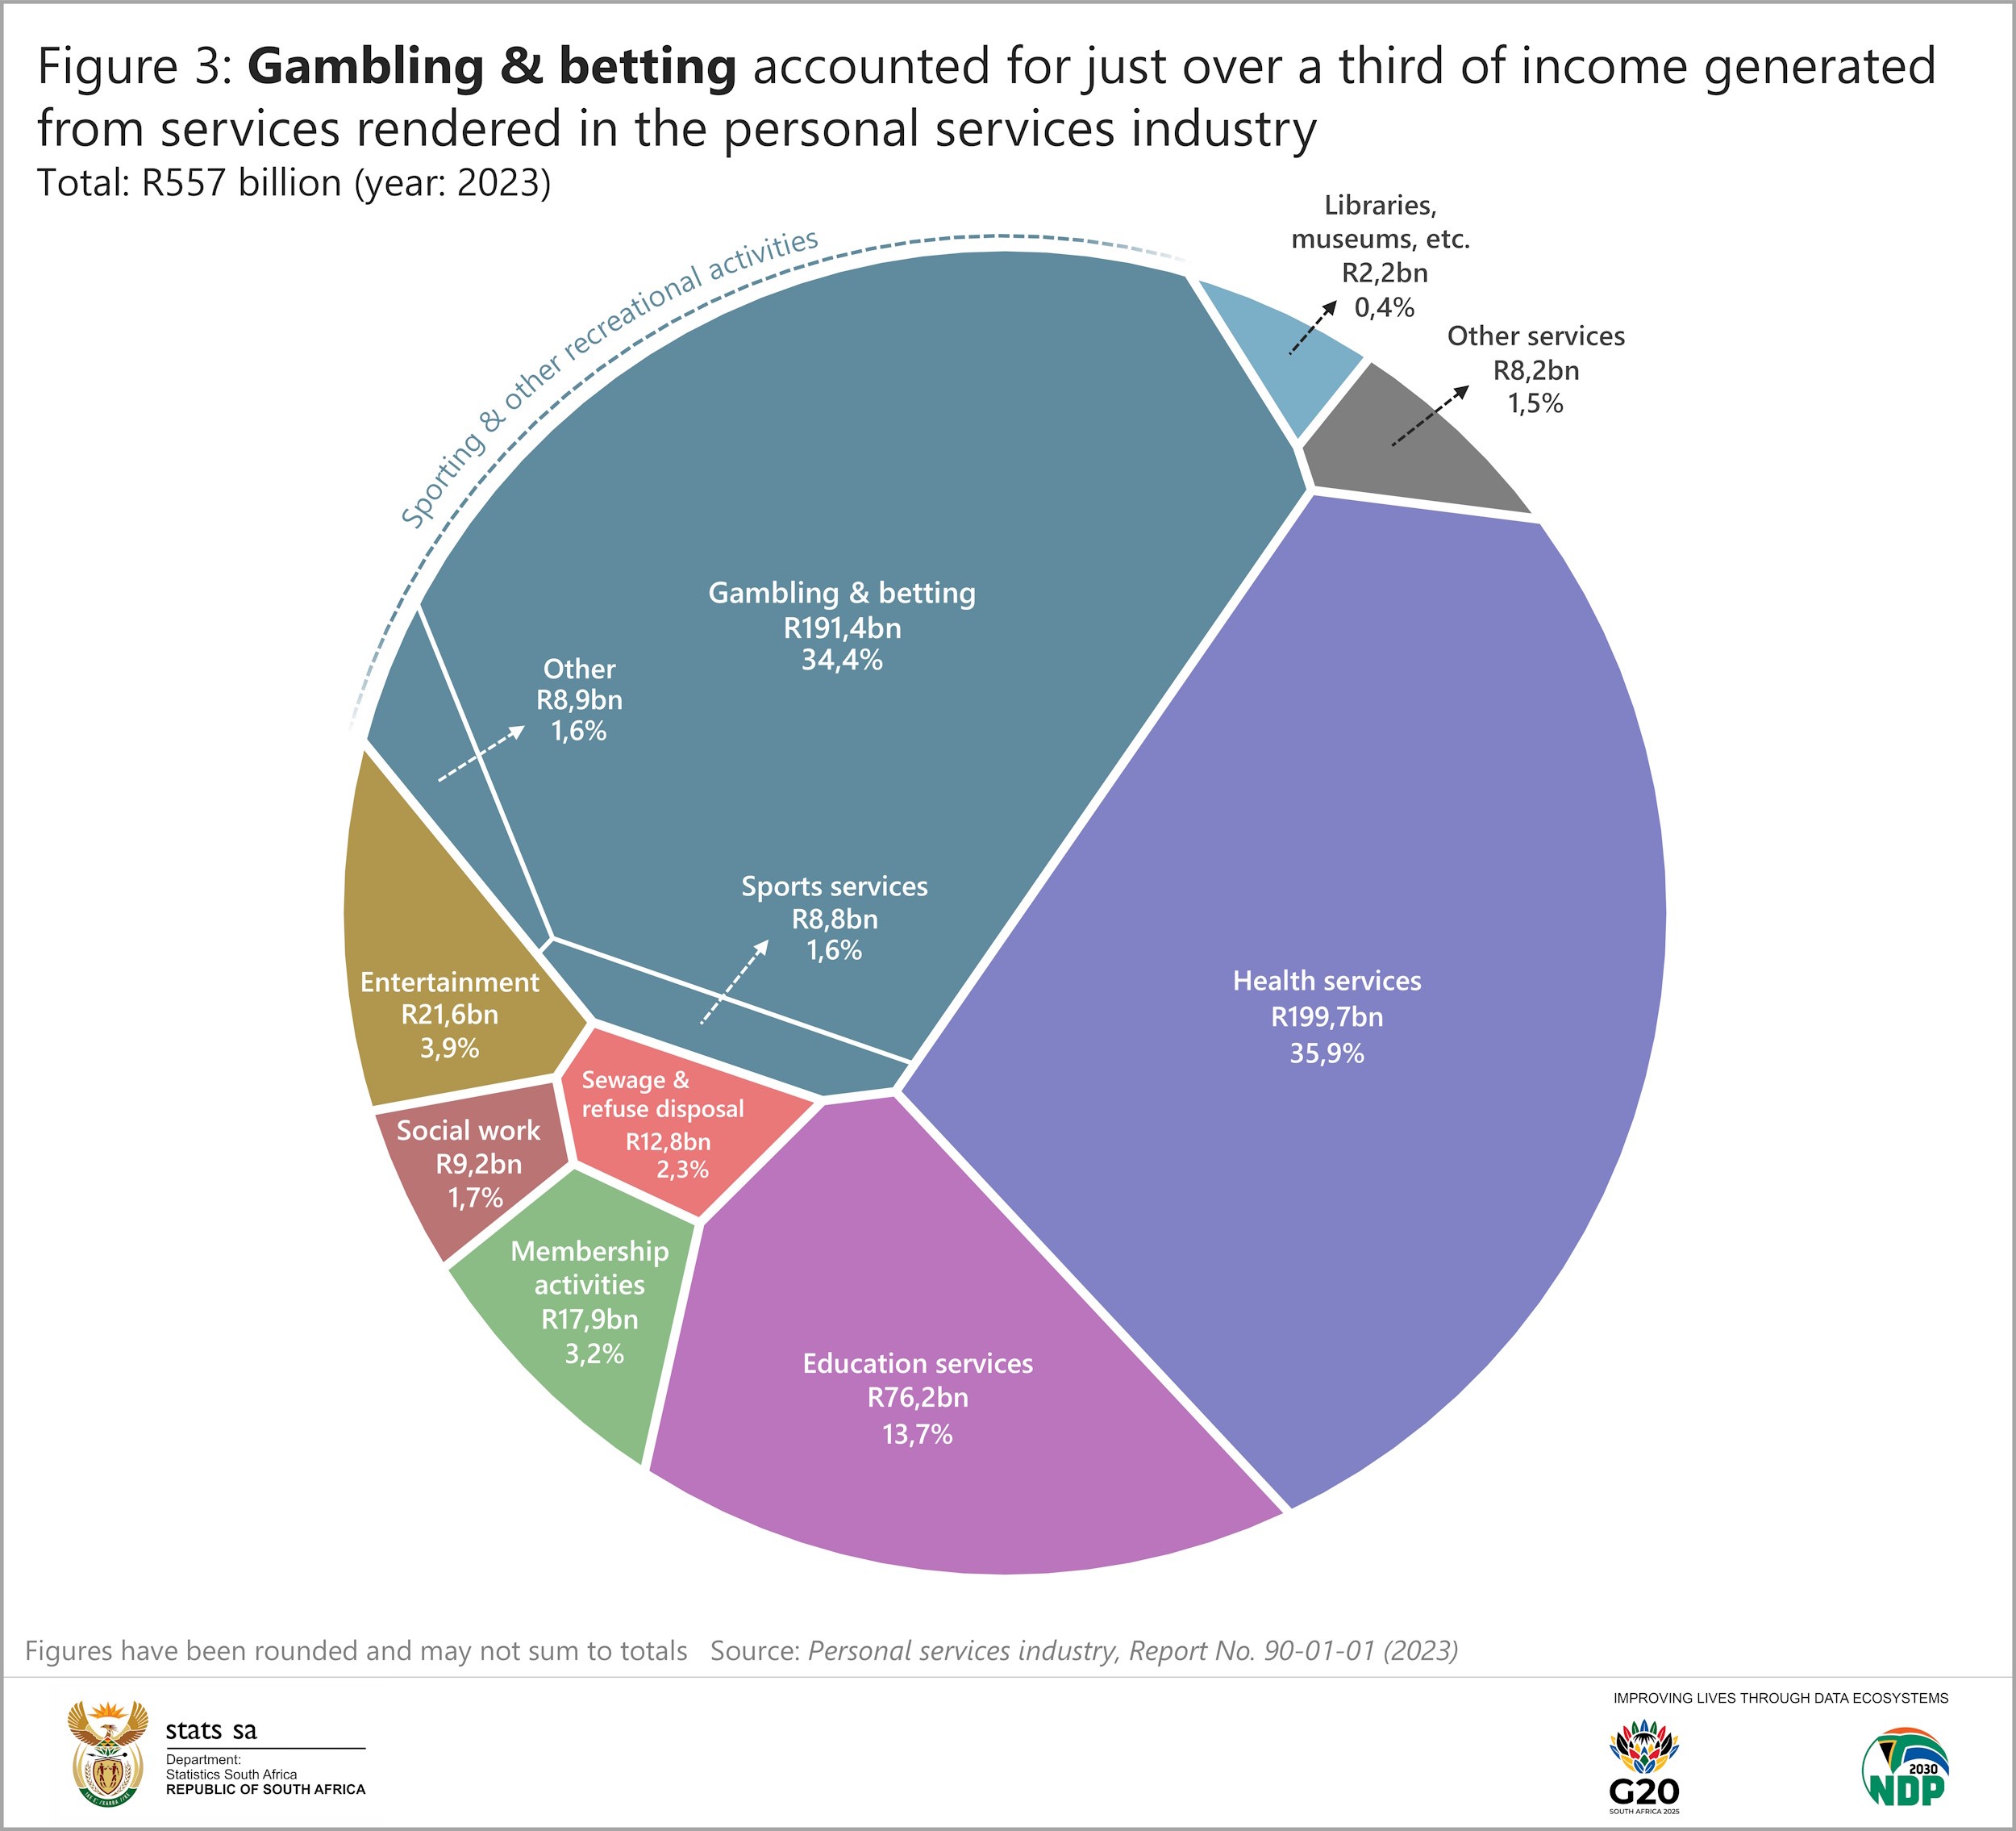
The report groups all forms of gambling into the broader category ‘gambling and betting’. This category accounts for a large slice of total income (from services rendered) in the personal services industry (Figure 3). It closely matches the amount generated from health activities, which includes hospital services, health professionals and veterinarians.
The great money spinner
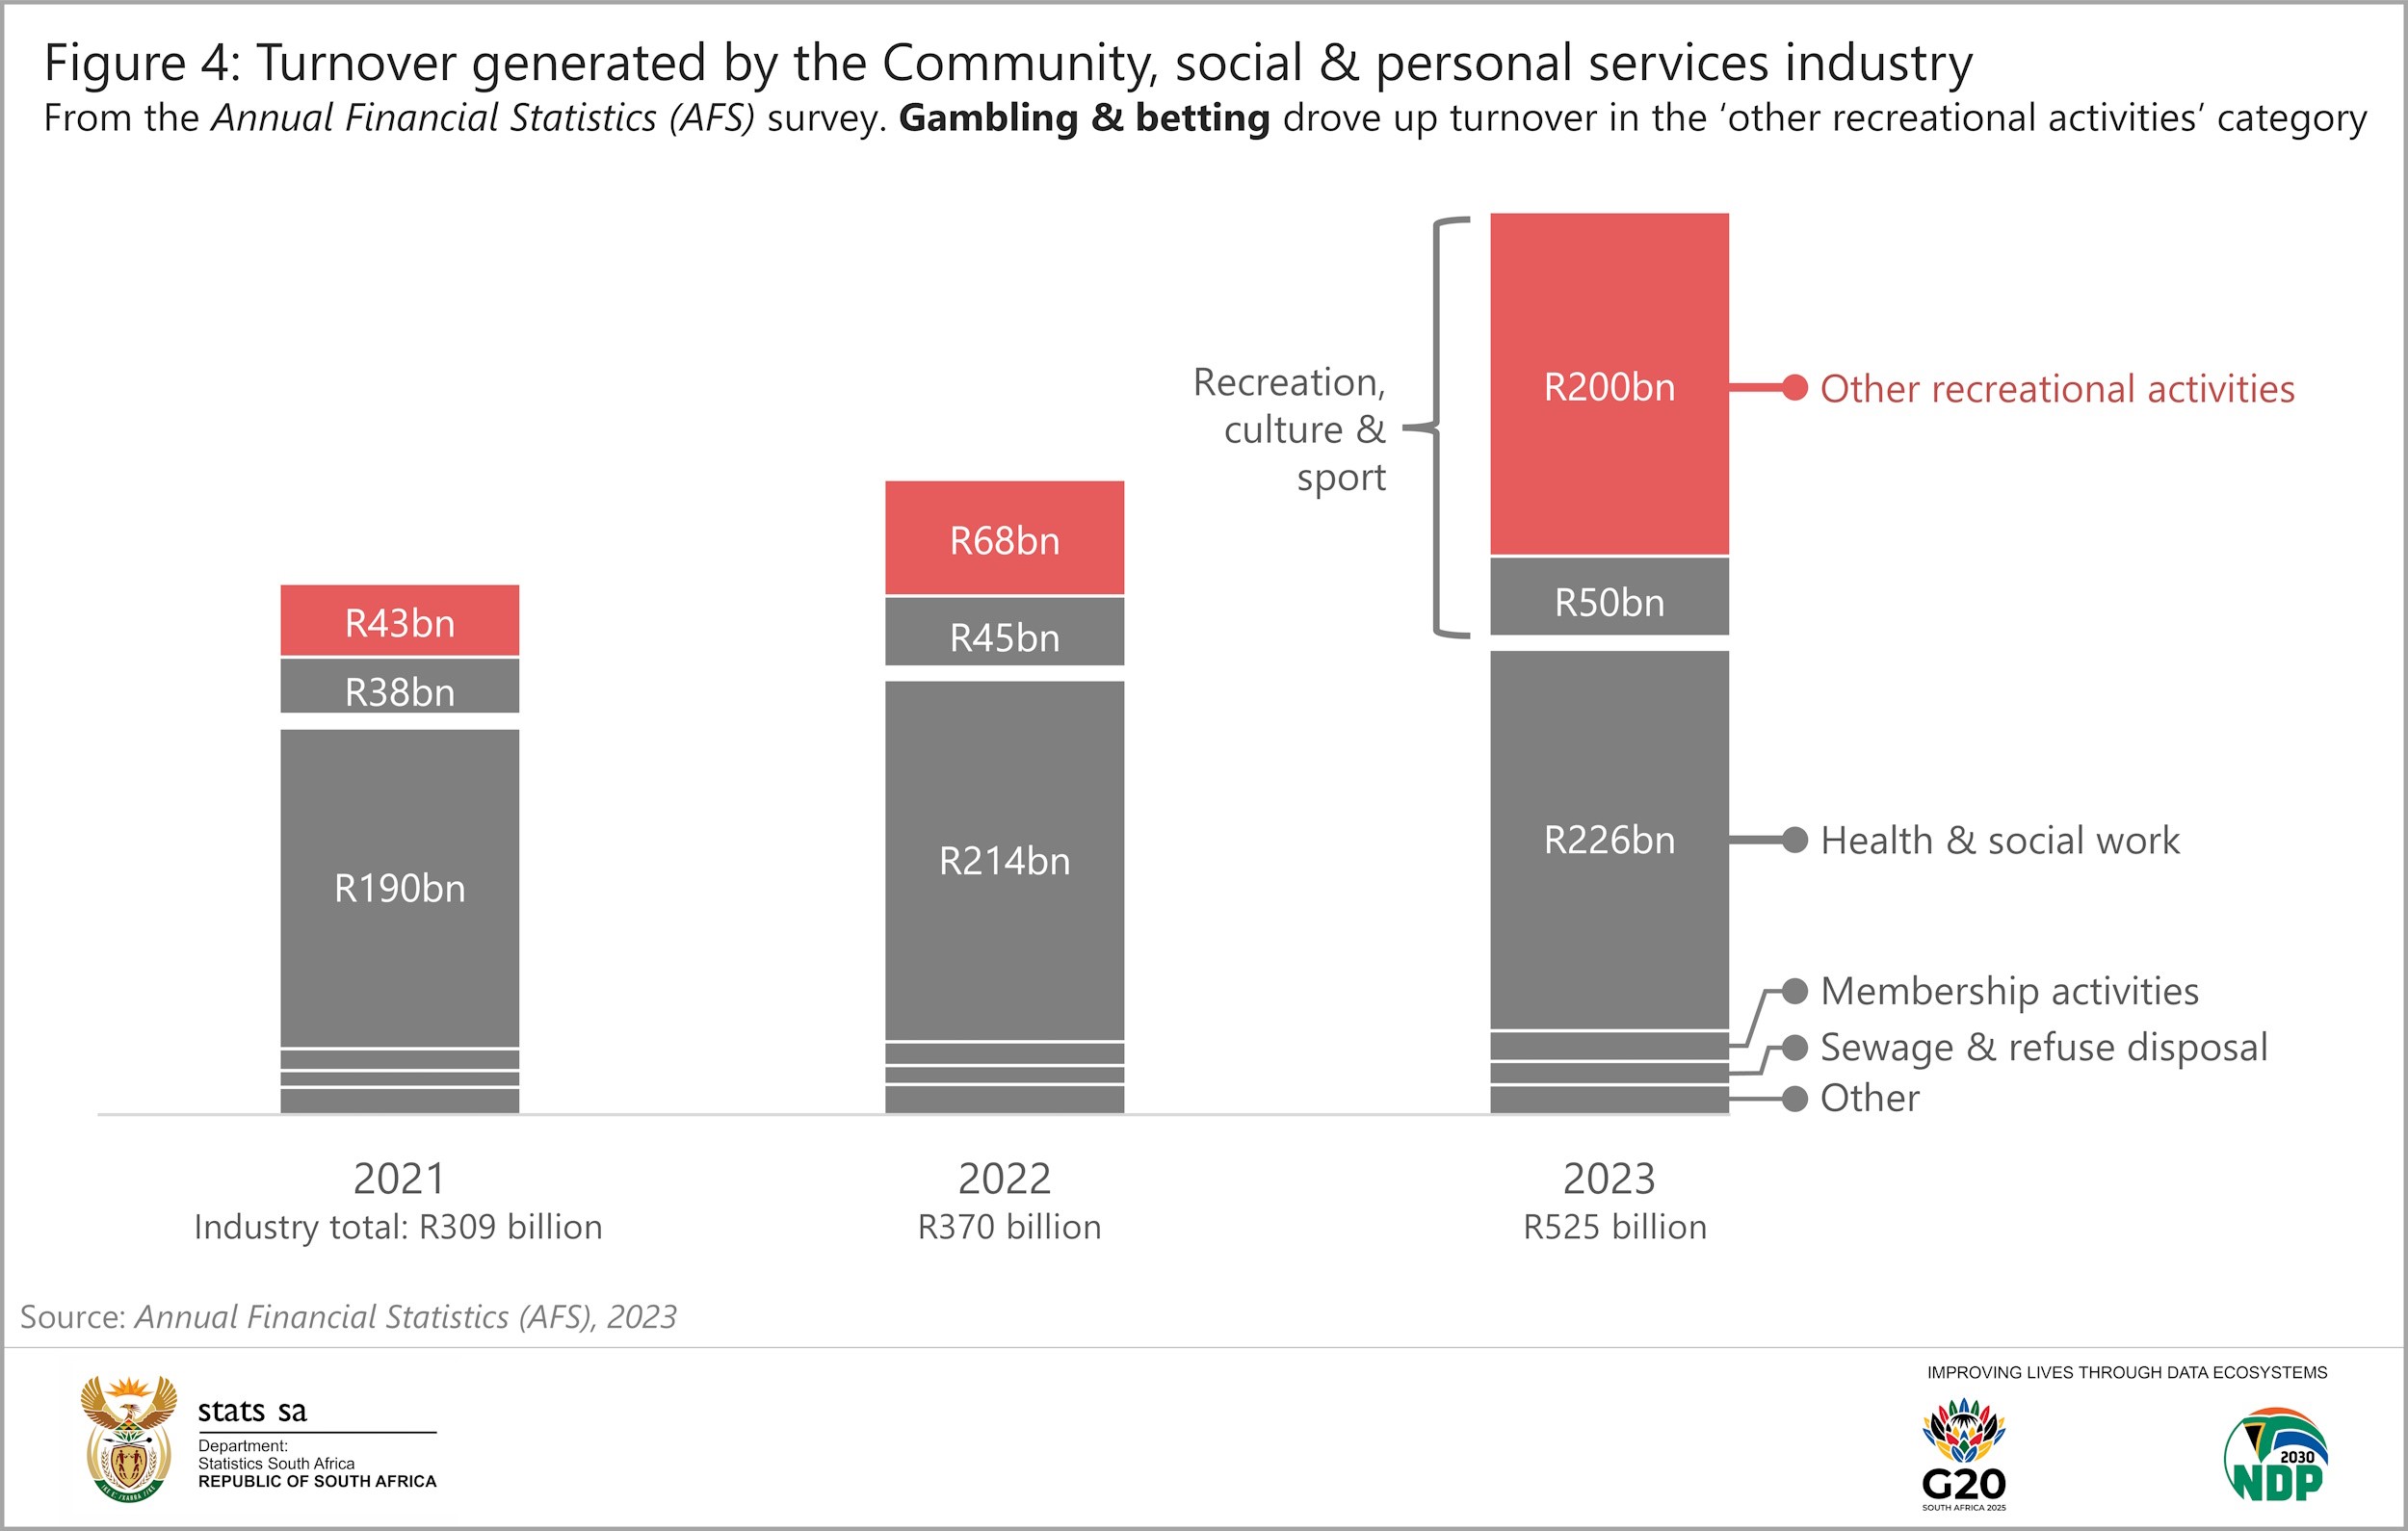
A third data source confirms the monetary value of the rise in gambling and betting. The Annual Financial Statistics (AFS) survey collects financial data from the formal business sector.5 Turnover generated by the category ‘other recreational activities’ expanded almost threefold in 2023 compared with 2022 (Figure 4). A closer inspection of the data shows that gambling and betting are the most significant contributors to the increase.6
From the household perspective
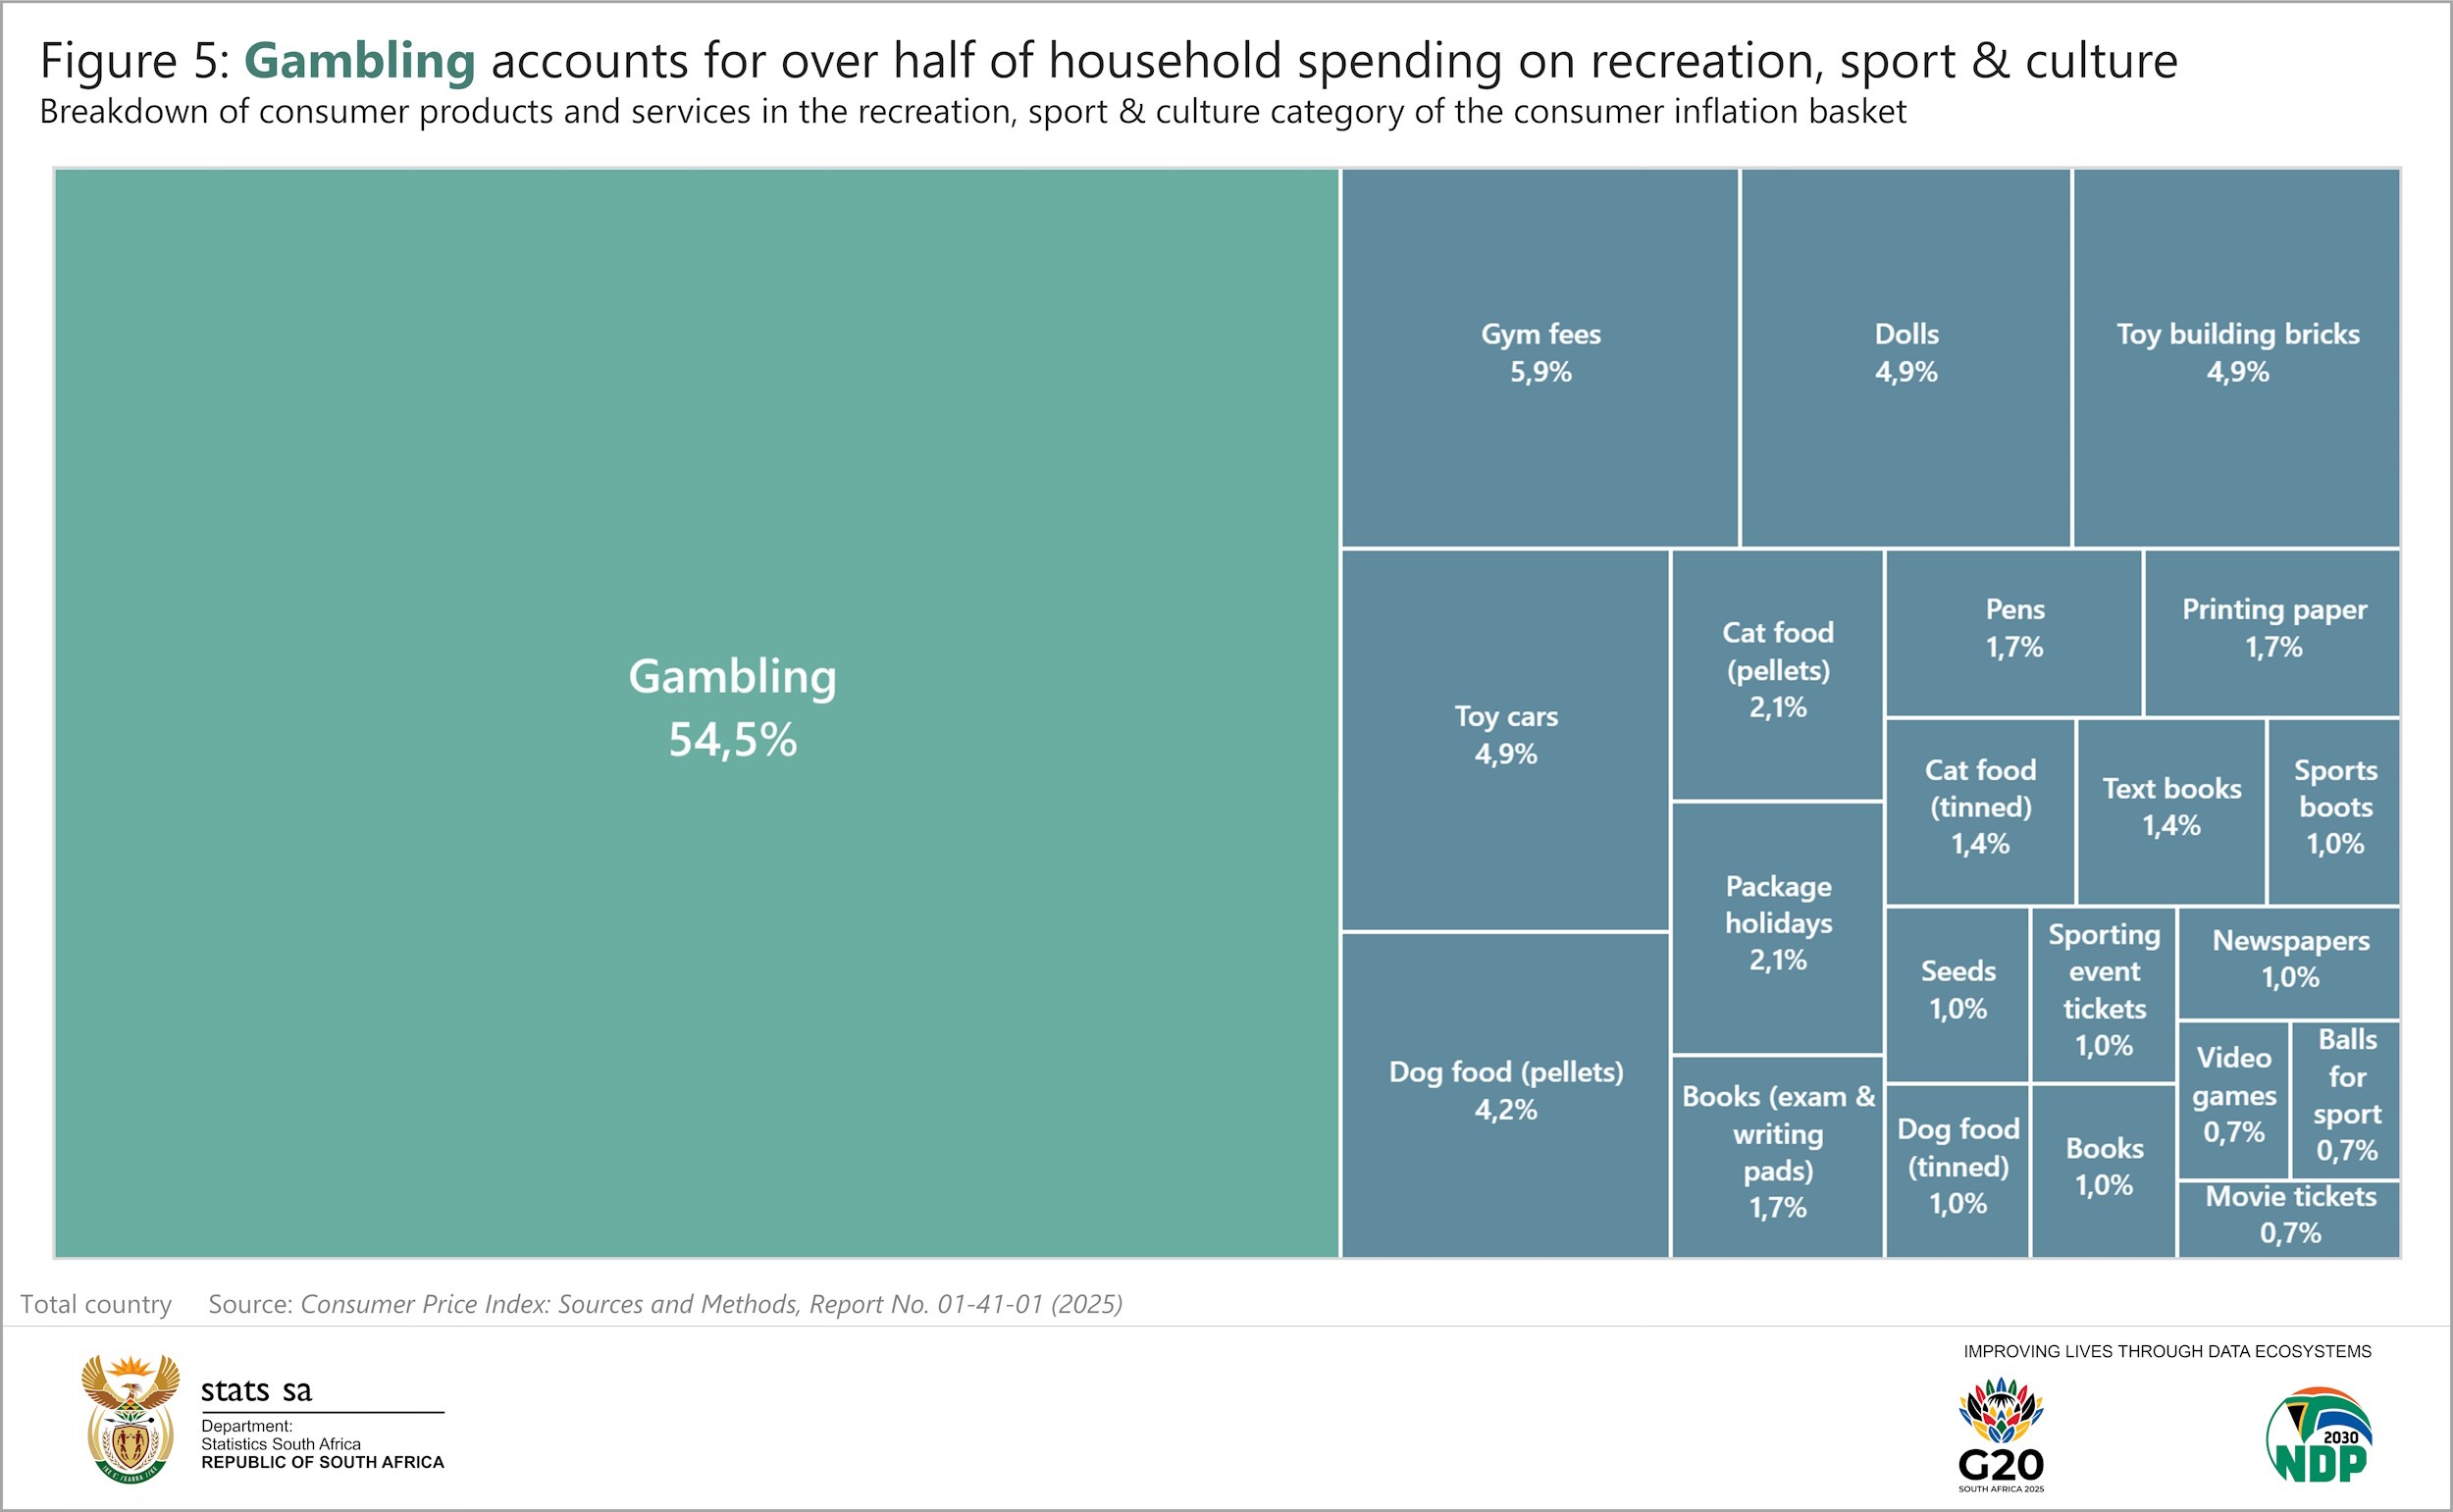
In the context of the consumer price index (CPI), gambling and betting activities (categorised as ‘gambling’) are listed as one of 391 products and services in the 2025 CPI basket.7 This includes lottery tickets, casinos, betting, bingo and Limited Payout Machines. The activity accounts for 1,6% of total household spending, placing it as the 12th highest weight in the basket, just behind beer.
Within the recreation, sport & culture group of products (weight of 2,86%), gambling dominates, taking just over half of household spending (Figure 5). Gym fees trail far behind at 5,9%.
Stats SA incorporates gambling and betting data in estimates of gross domestic product (GDP). It is included as part of household final consumption expenditure on recreation and culture as well as the production of personal services. In an article published in 2024, Stats SA made mention of the impact of gambling and betting on the GDP estimates.8
For more information, follow the links below.
1 National Gambling Board of South Africa. Gambling sector performance, FY2024. Figure 7 and Figure 10 (download here).
2 Gross gambling revenue is defined as the rand value of the gross revenue of an operator in terms of turnover, less winnings paid to players.
3 Stats SA. Personal services industry, Report No. 90-01-01 (2023) (download here).
4 Note that the personal services industry report does not include data on all gambling activities. Gambling takes place across other industries. For example, data on casino facilities at hotels are included in Stats SA’s accommodation industry report, available for download here.
5 Stats SA. Annual Financial Statistics (AFS). Disaggregated industry estimates 2022 2023 Excel file (download here).
6 Note that the ‘other recreational activities’ category in the Community, social & personal services industry does not include turnover from all gambling activities. Gambling activity can also be included in other industries. For example, in the AFS, casino facilities at hotels are included under accommodation in the category ‘hotels, camping sites & other provision of short-stay accommodation’.
7 Stats SA. Consumer Price Index: Sources and Methods, Report No. 01-41-01 (2025), pg 46 (download here).
8 Stats SA. Economic activity declines in the third quarter (read here).
Similar articles are available on the Stats SA website and can be accessed here.
For a monthly overview of economic indicators and infographics, catch the latest edition of the Stats Biz newsletter here.