

Stats SA recently published an update on the influence of Black Friday on November retail trade sales.1 The event has become synonymous with e-commerce. According to data quoted by BusinessDay, there was a sharp rise in online Black Friday purchases in 2025.2,3
While Stats SA does not publish data specifically on the influence of e-commerce on Black Friday, several statistical reports include figures and clues on the general use and growth of e-commerce in South Africa.
First, the monthly retail sales data are silent on e-commerce. The survey is designed to provide a quick, broad measure of total industry sales, enabling monthly results to be released. To meet these tight publication timelines, the survey does not delve into too many detailed breakdowns, such as a split between online and in-store sales.
For e-commerce data, we turn to the structural industry statistics report on retail trade. The periodic report provides a deeper look at the industry.4 Income from sales of goods and services through e-commerce grew notably in the period 2018 to 2022 (see Figure 1 below), from R37,4 billion to R86,8 billion, representing an annual rise of 23,4%. The increase also pushed up the contribution of e-commerce to total sales over this period, from 3,9% to 7,7%.
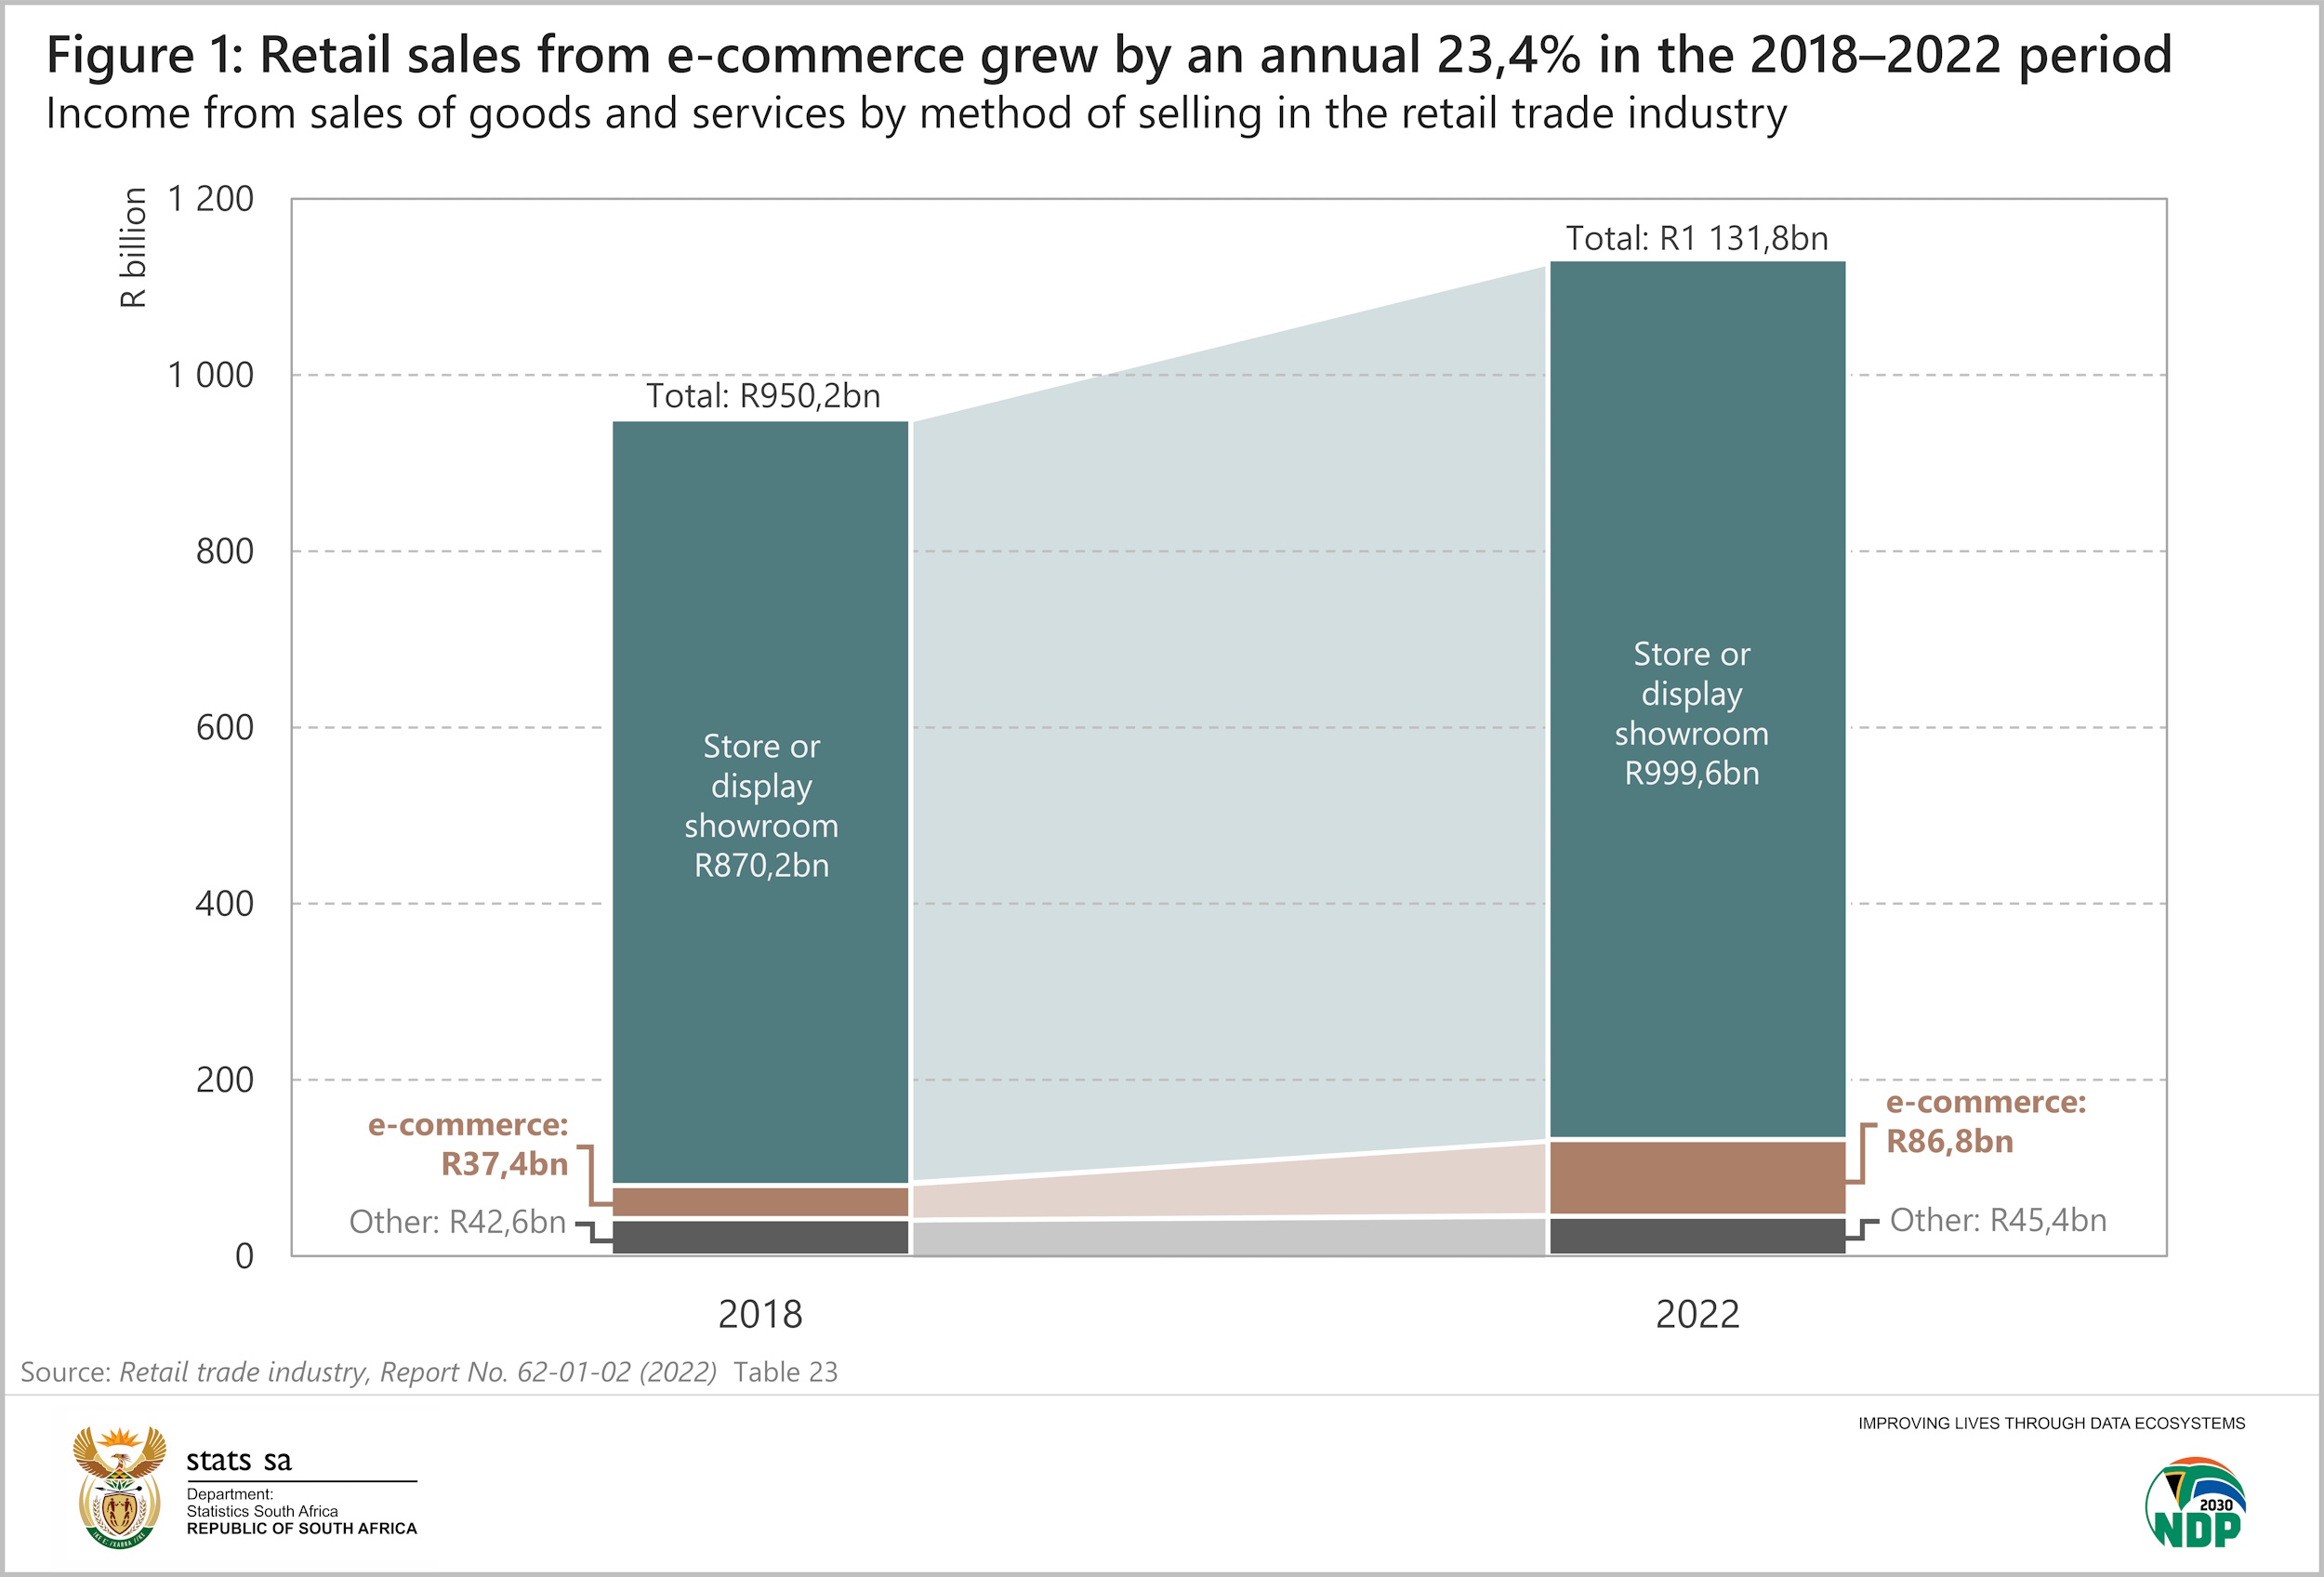
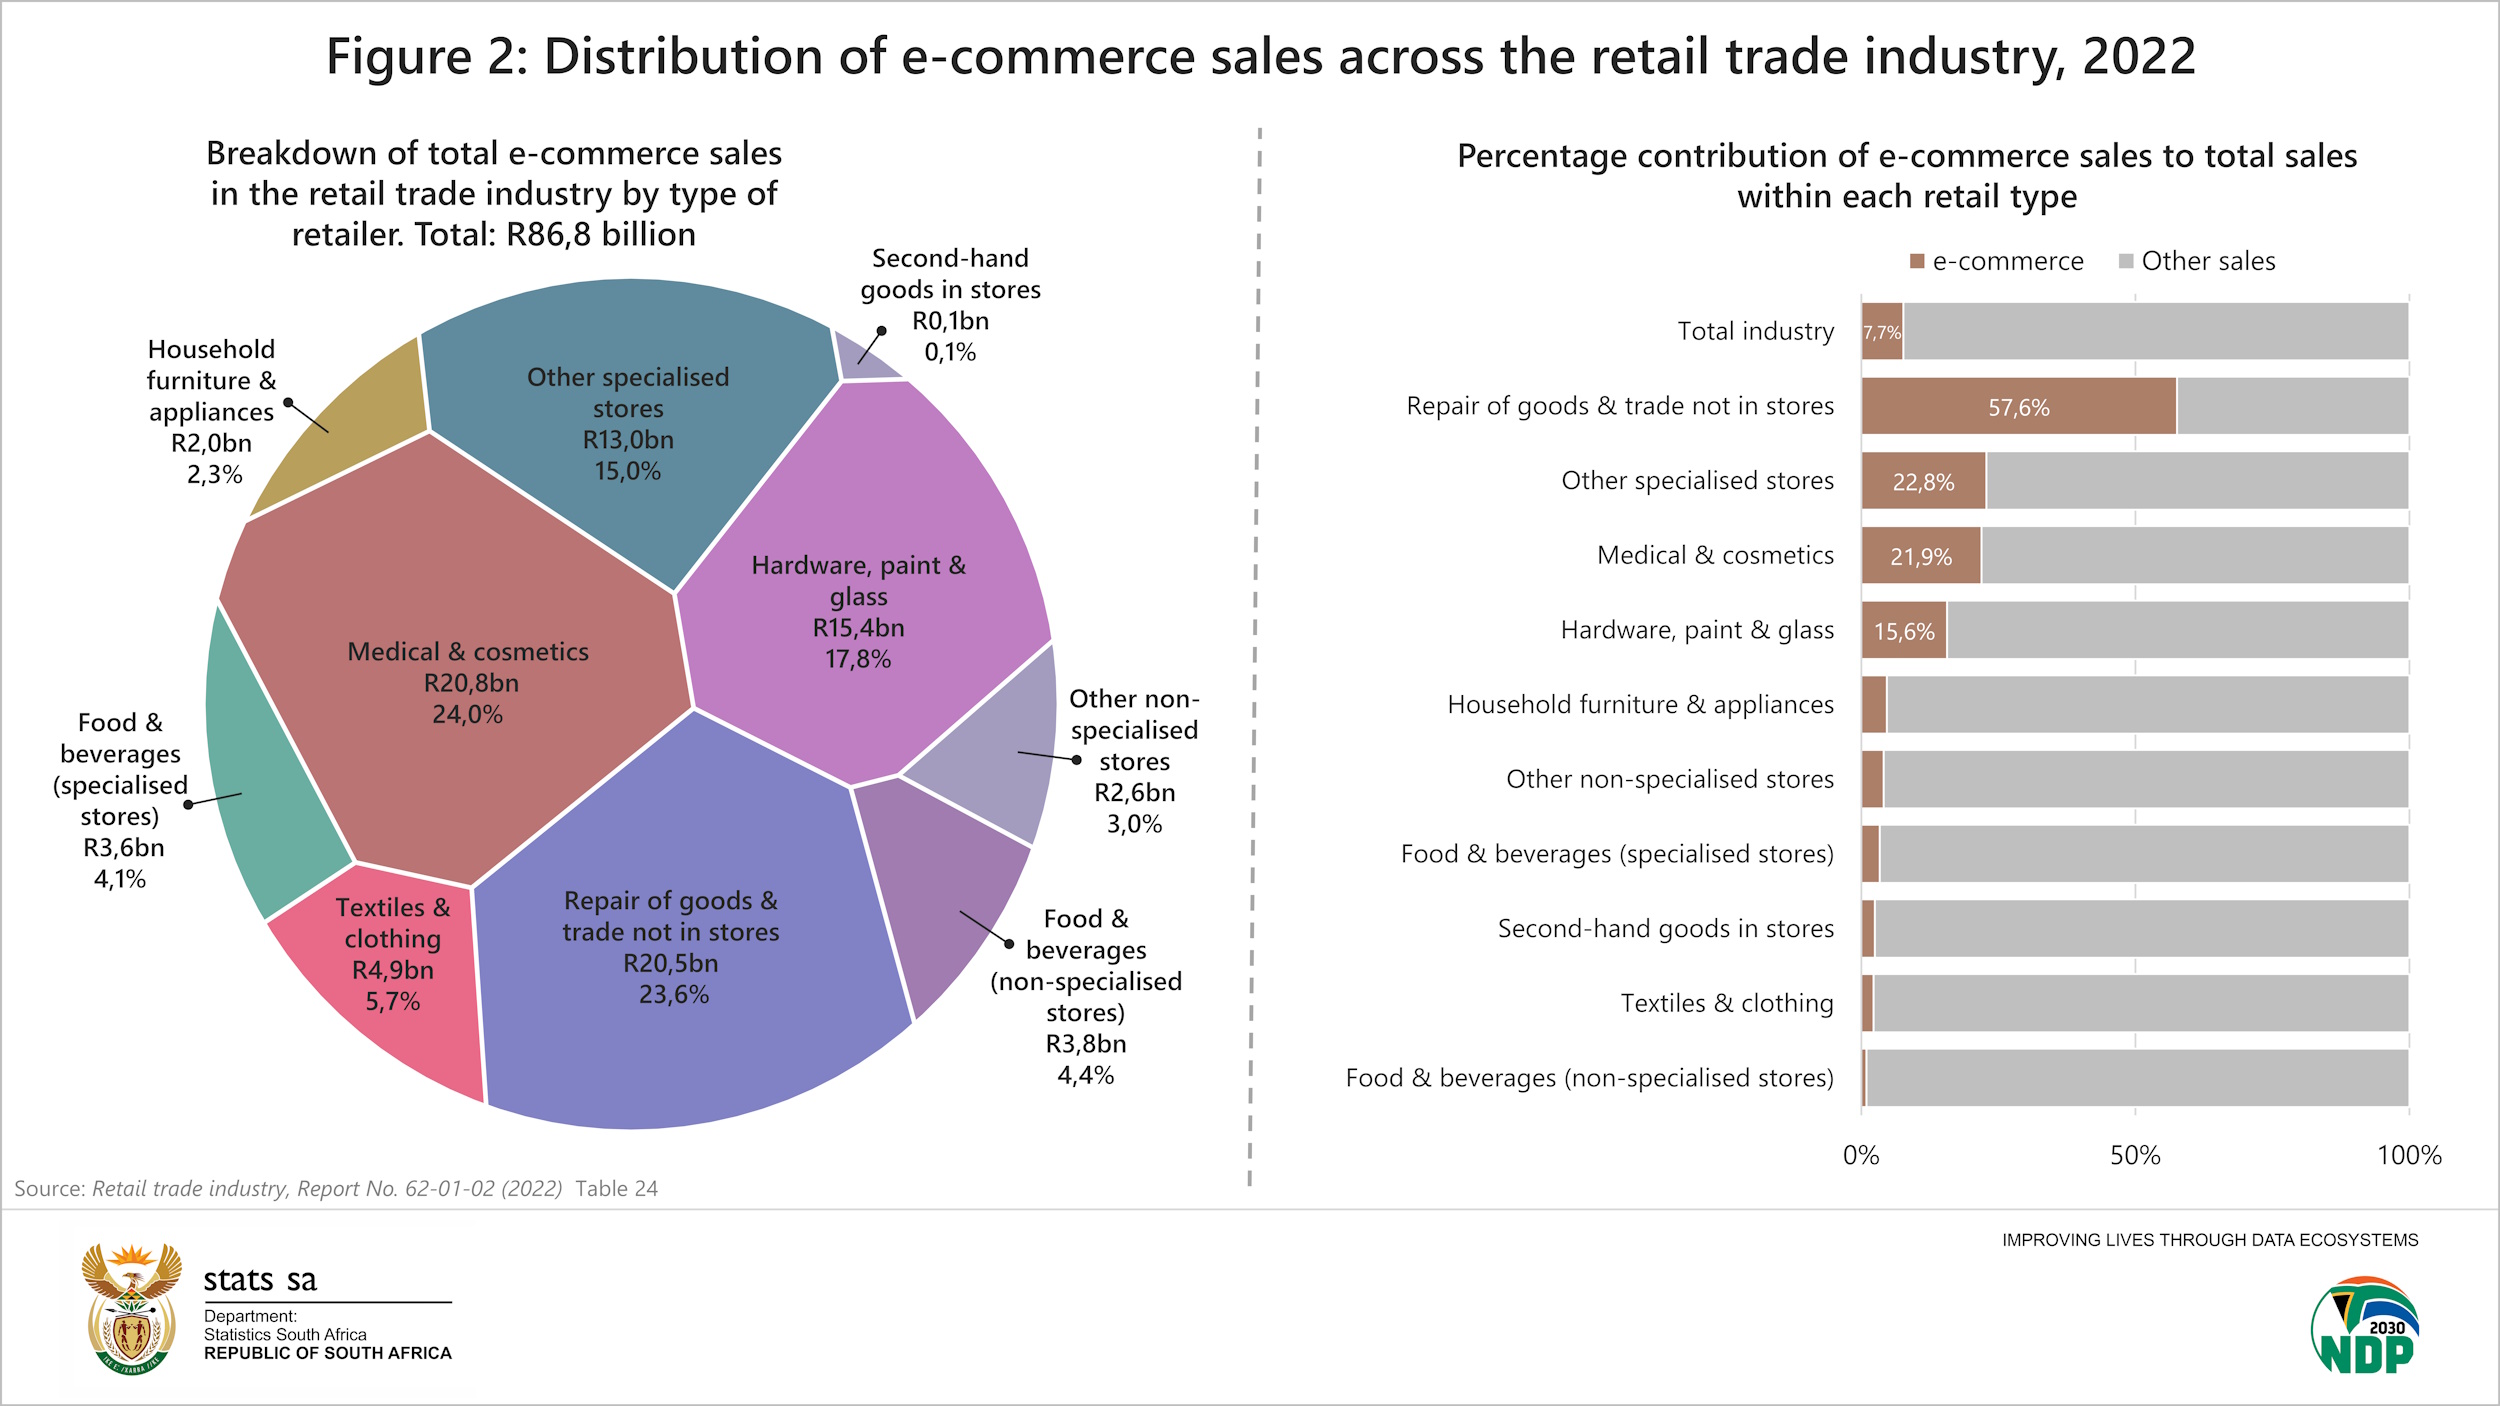
Figure 2 below draws from the same report. According to the graphic on the left, the medical & cosmetics category was the most active player in the e-commerce space in 2022, accounting for 24,0% of total retail e-commerce sales. The chart on the right shows the contribution of e-commerce to total sales within each retail type. Retailers in the category ‘repair of goods & trade not in stores’ depended the most on e-commerce that year.
The structural industry statistics report for wholesale trade also shows e-commerce growing in that industry too, with its contribution rising from 8,7% of total sales of goods and services in 2018 to 11,2% in 2022. Wholesale trade in agricultural raw materials & livestock made the most significant contribution, accounting for 24,3% of total e-commerce sales income in 2022.5
Structural industry statistics reports are available for several industries, but e-commerce is only detailed in the reports for retail trade and wholesale trade. Despite this, another variable provides a clue to e-commerce coverage. Figure 3 below draws on nine structural industry statistics reports to show the percentage of enterprises that receive orders online.
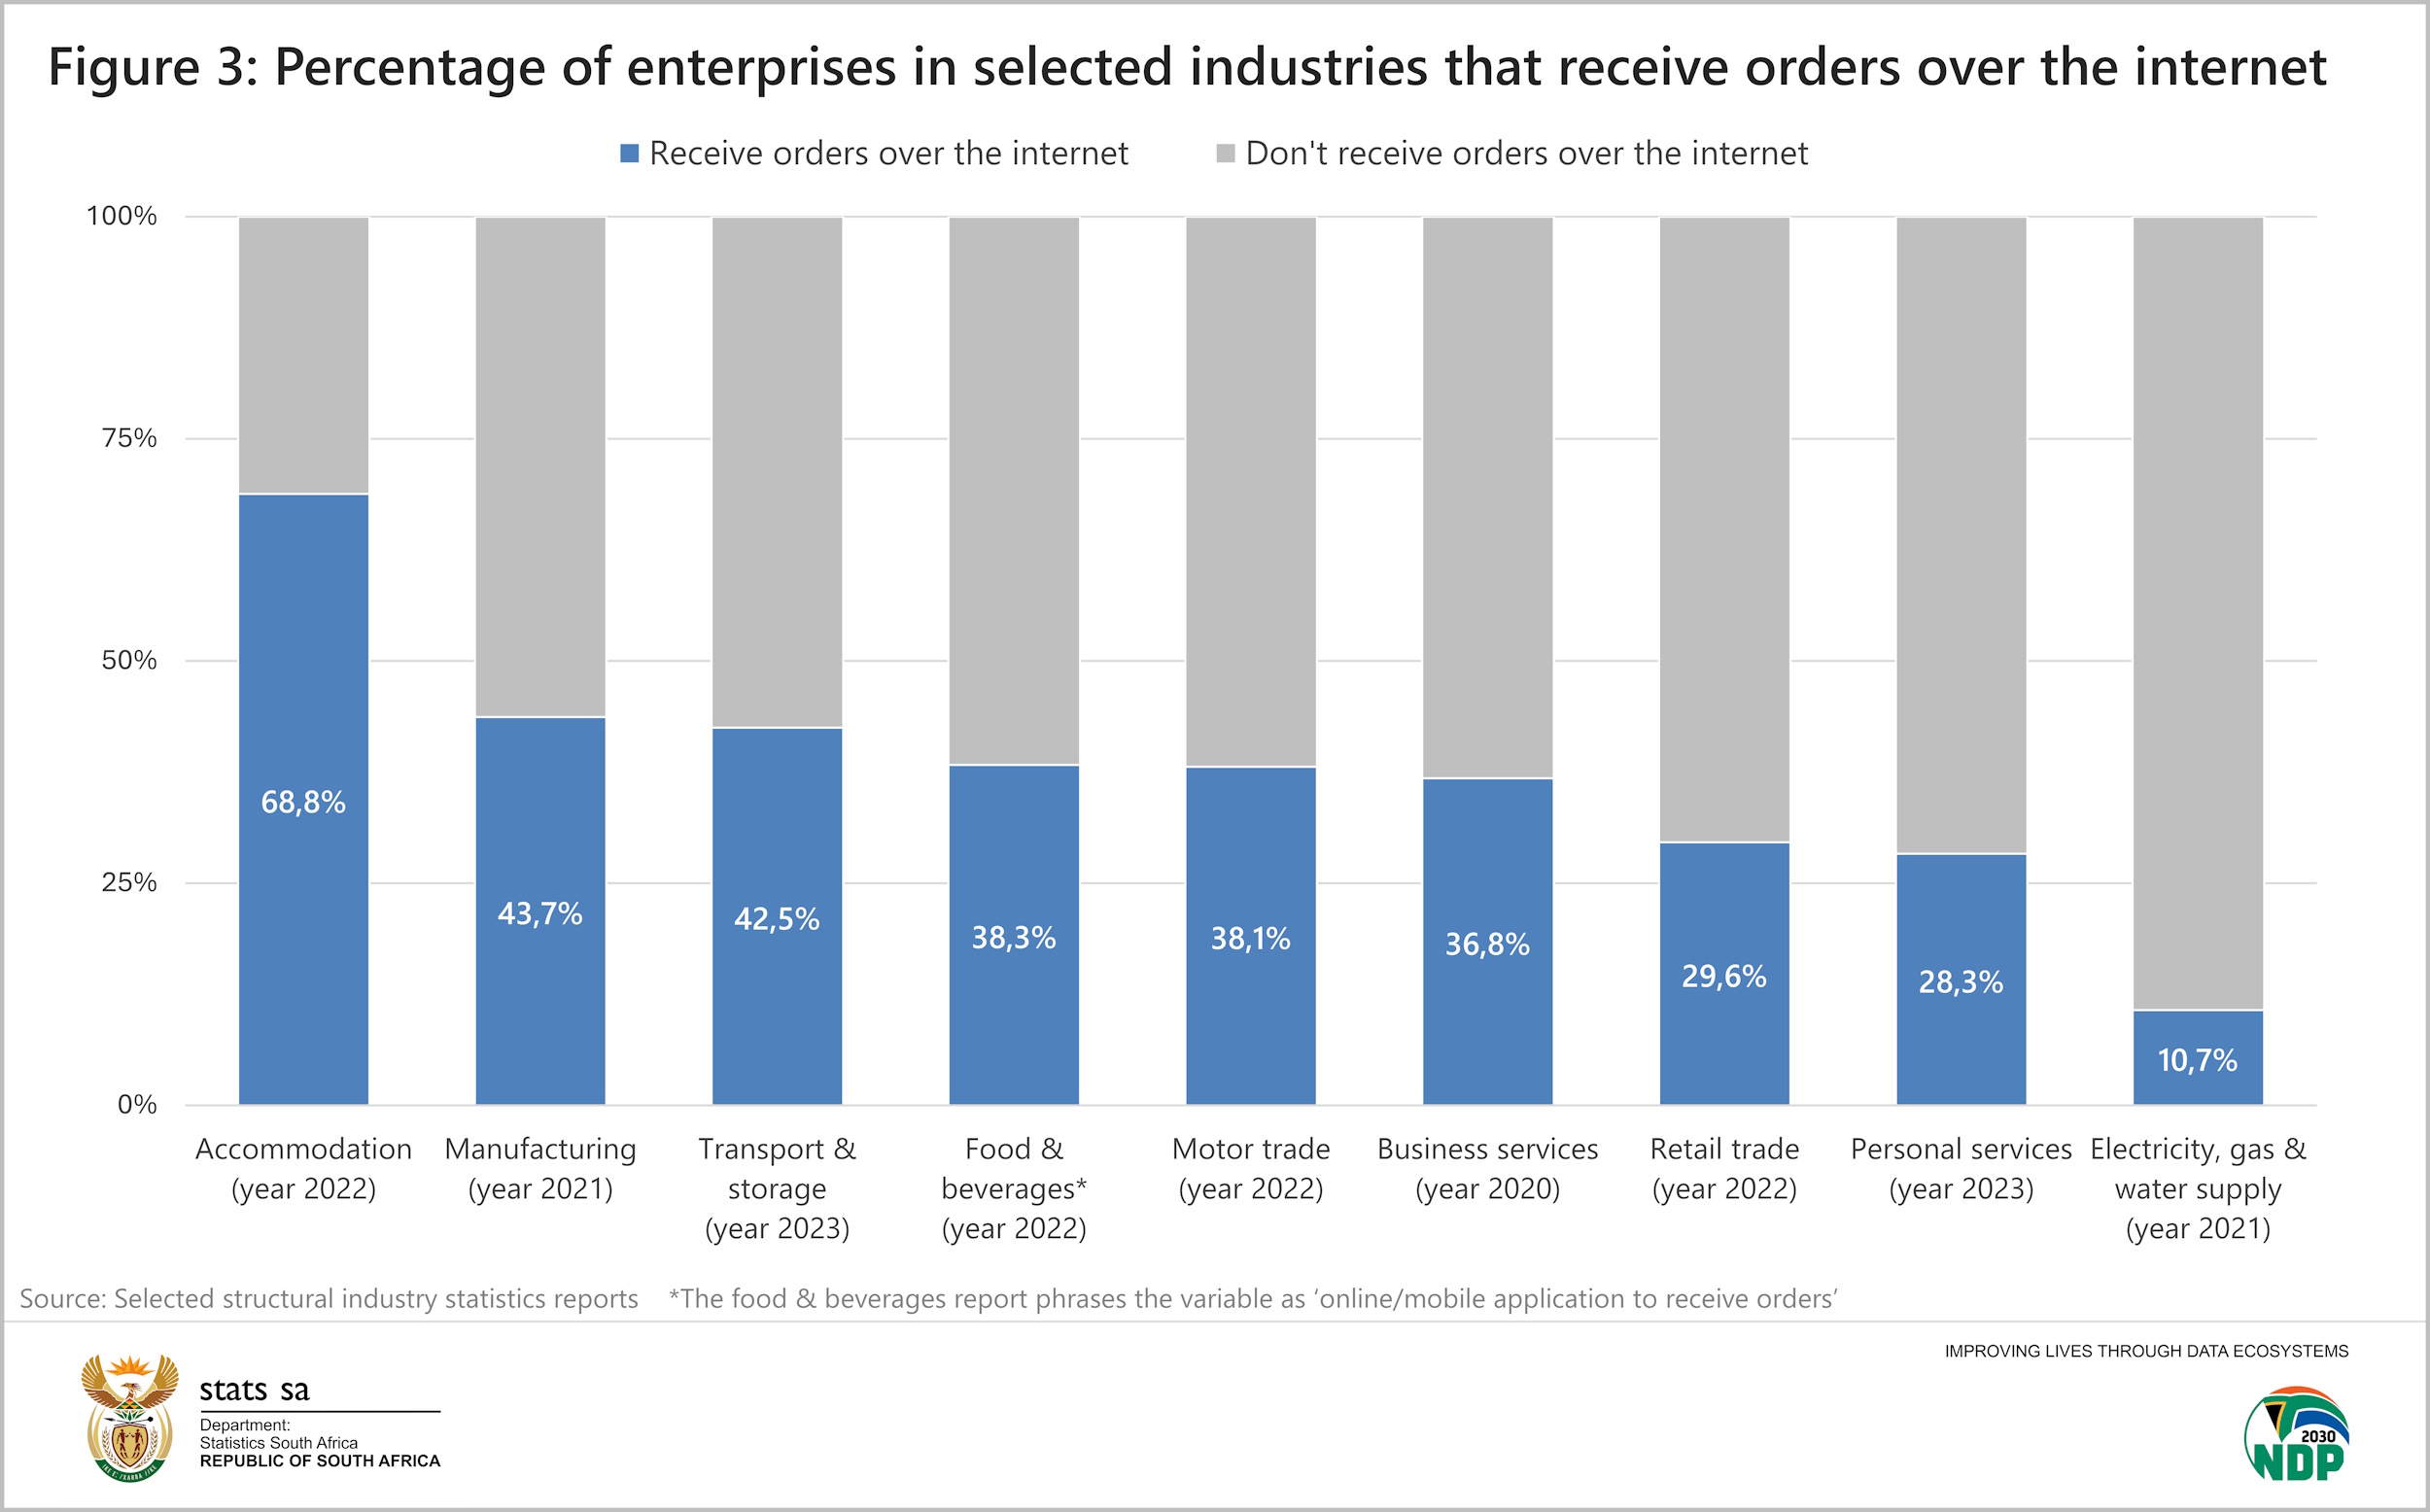
Over two-thirds of enterprises in the accommodation industry use the internet to receive orders. Within this industry, use was most popular among hotels, motels & inns (74,7%) and less so for guest-houses and guest farms (63,4%).
Travel agencies registered the highest percentage (59,9%) in the transport and storage industry.
In the food & beverages industry, 70,9% of takeaway and fast-food outlets used an online/mobile application to receive orders, followed by restaurants & coffee shops (55,8%).6
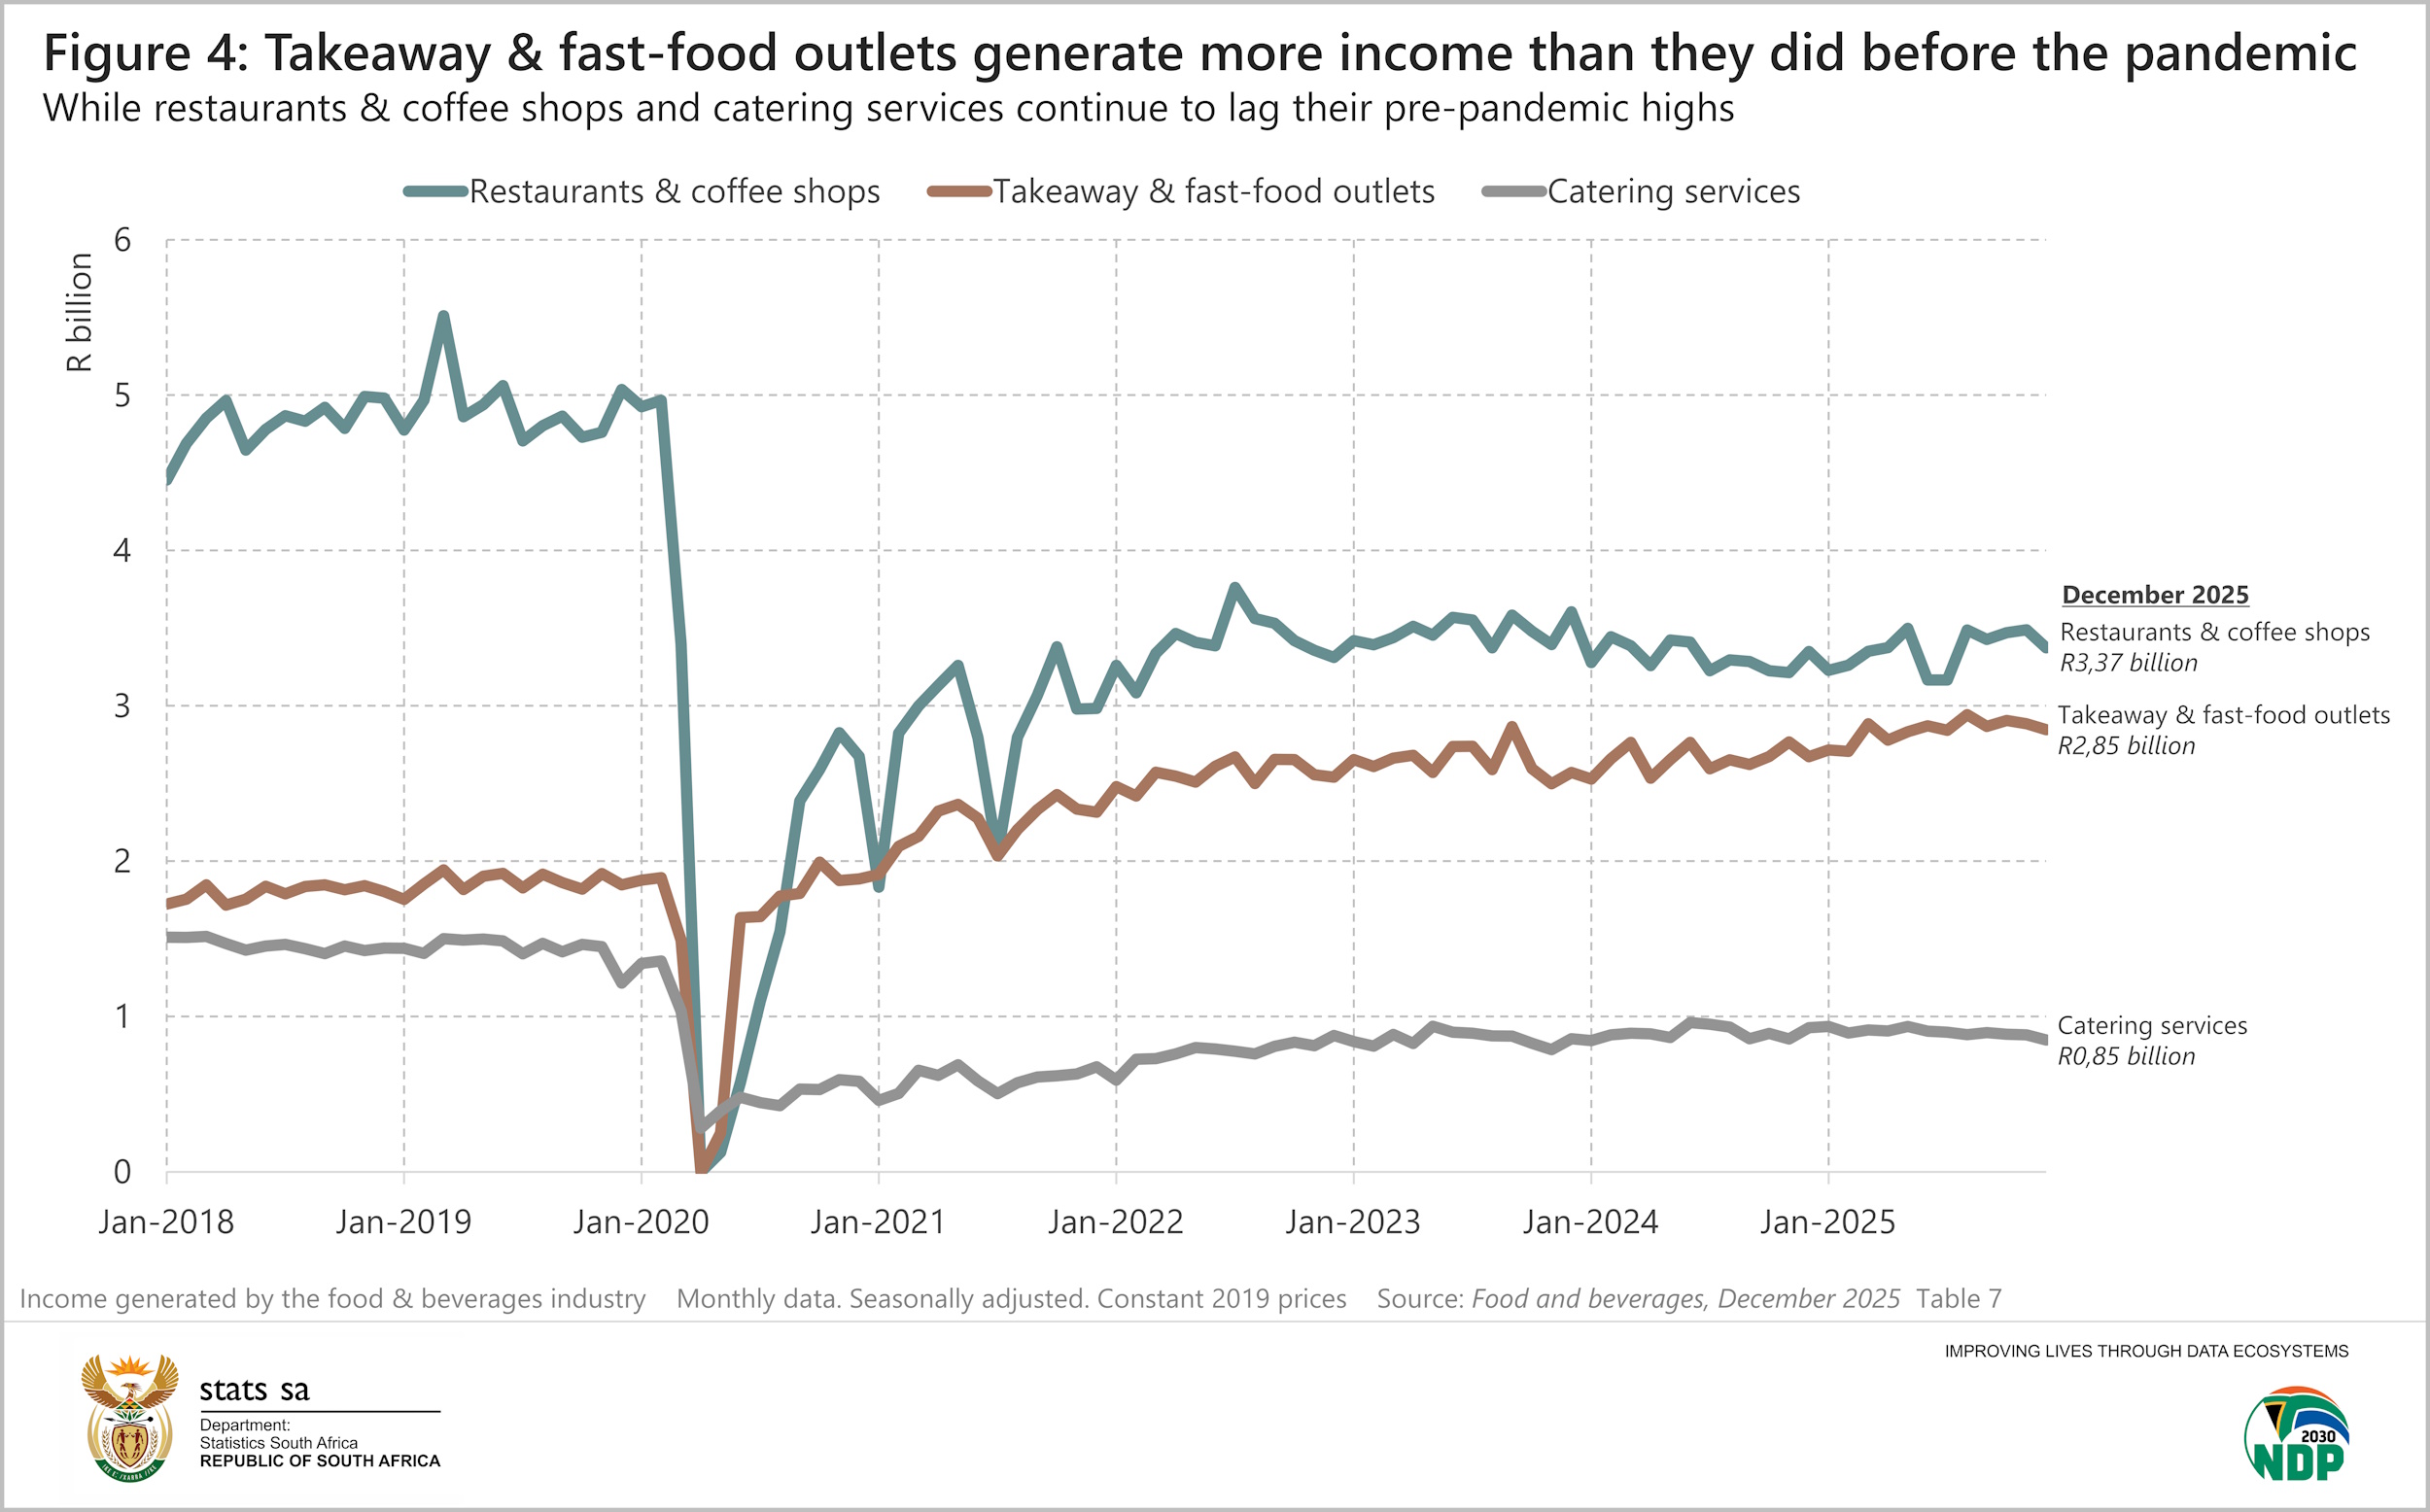
Staying with takeaway and fast-food outlets, the sector has shown resilience since the end of the COVID-19 pandemic, according to the monthly survey on the food & beverages industry.7 The survey does not provide data for online sales. However, it shows that total income generated by takeaway & fast-food outlets has risen past its pre-pandemic highs, recording R2,85 billion in December 2025 (see Figure 4 below). In contrast, the restaurants and coffee shops, as well as the catering services subsectors, have not yet recovered to their pre-pandemic levels, with activity still lagging 2019 benchmarks.
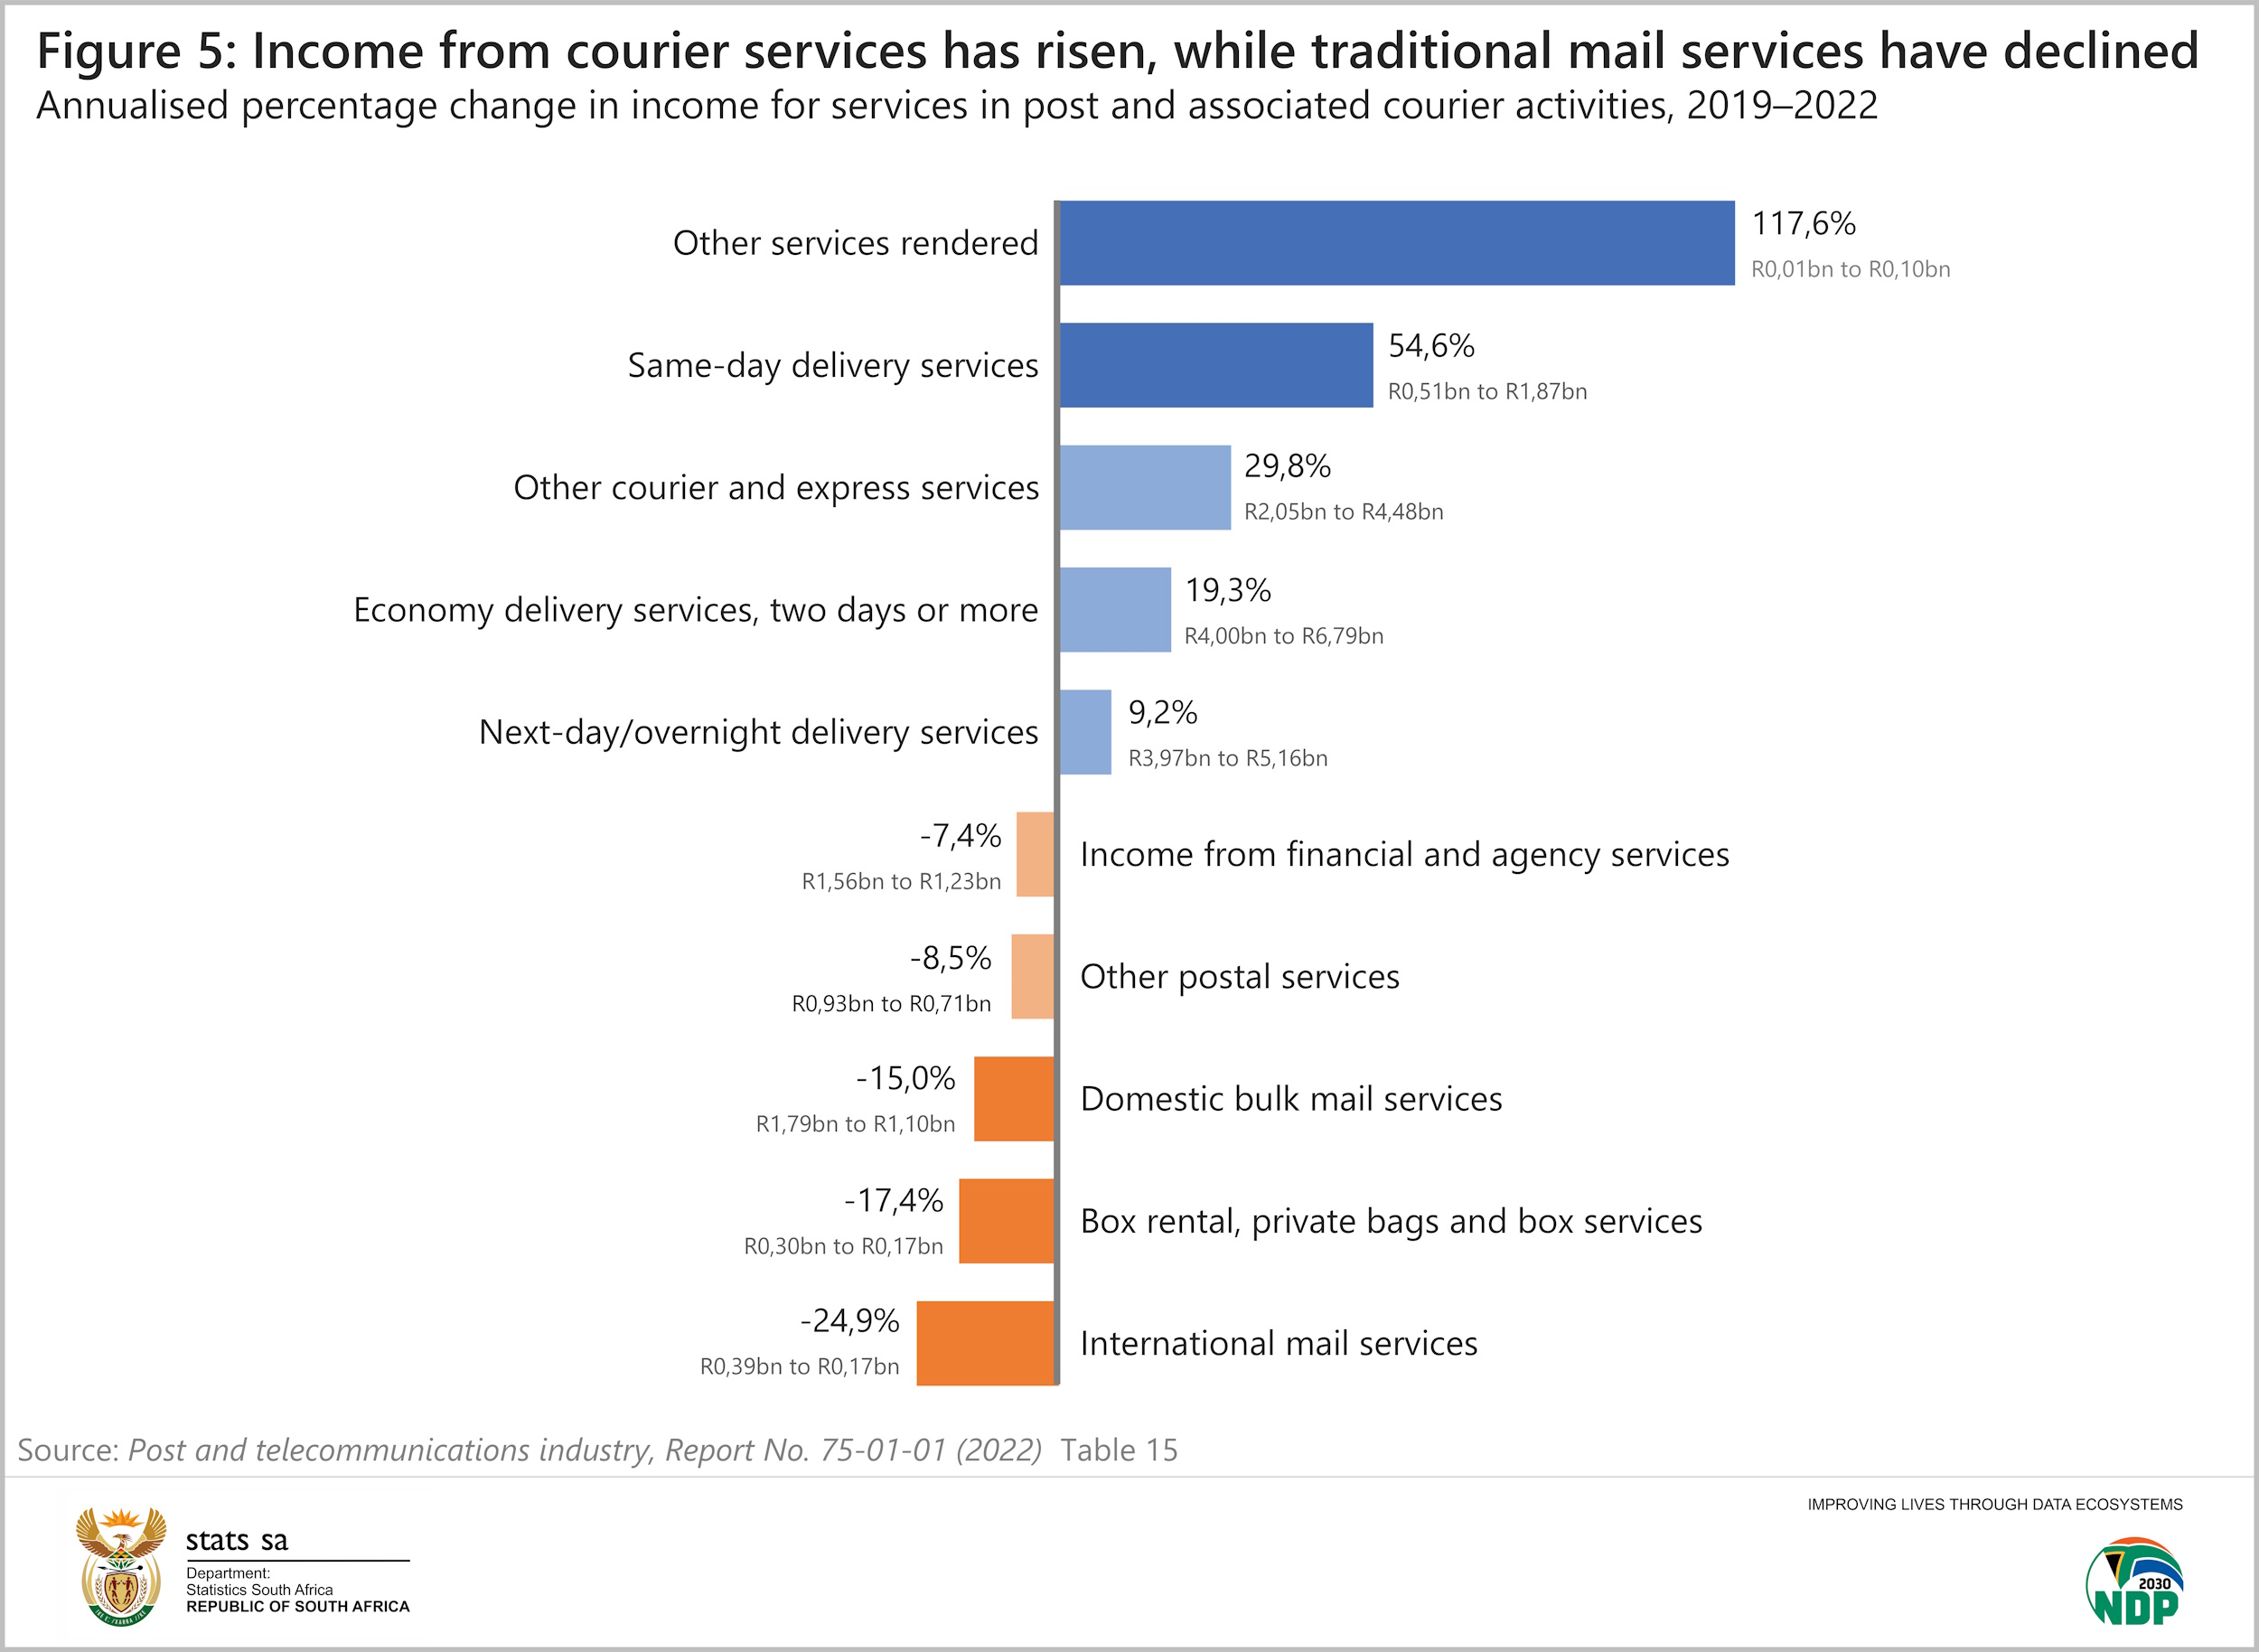
One last indirect hint on the rise of e-commerce is the growth of courier services. Figure 5 below, from the 2022 structural industry report for post and telecommunications, shows how courier-related activities (i.e. same-day delivery, express, economy delivery and overnight delivery services) grew in popularity in the period 2019 to 2022. Traditional postal options (i.e. bulk mail, box rental and international mail services) all declined.8
In a nutshell, what does all the available data tell us? First, e-commerce has grown across both retail and wholesale trade. Second, the use of the internet to receive orders was most common in the accommodation industry, particularly among hotels, motels & inns. Third, just over 7 in 10 takeaway & fast-food outlets used an online/mobile application to receive orders in 2022.
1 Stats SA, The Black Friday effect: Exploring the latest data [11 March 2026] (read here).
2 BusinessDay, Capitec customers spend three times as much at Shein [8 December 2025] (read here).
3 BusinessDay, Online retail spending soars 50% during 2025 holiday season [22 January 2025] (read here).
4 Stats SA, Retail trade industry, 2022. Table 23 and Table 24 (download here).
5 Stats SA, Wholesale trade industry, 2022. Table 23 and Table 24 (download here).
6 Note that the latest structural industry statistics reports don’t all cover the same year. Due to the size and complexity of these surveys, updates are published in a staggered cycle. Other structural industry statistics reports include:
7 Stats SA, Food and beverages, December 2025 (download here).
8 Stats SA, Current trends in the post and telecommunications industry [23 July 2024] (read here).
Similar articles are available on the Stats SA website and can be accessed here.
For a monthly overview of economic indicators and infographics, catch the latest edition of the Stats Biz newsletter here.