
Economic wrap-up for March 2026
Stats SA had a busy month in March, publishing 35 statistical releases. Key economic outputs include monthly business cycle indicators for January, gross domestic product (GDP) estimates for the fourth quarter of 2025 and fresh data on tourism from two separate sources.
January was a mixed bag
Mining; retail trade sales; motor trade sales; tourist accommodation; restaurants, catering & fast food; and rail transport (freight and passenger) were all positive year-on-year in January 2026. Manufacturing, electricity generation, construction (buildings completed as reported by large municipalities), wholesale trade sales, and road transport (freight and passenger) were all weaker (see Figure 1 below).
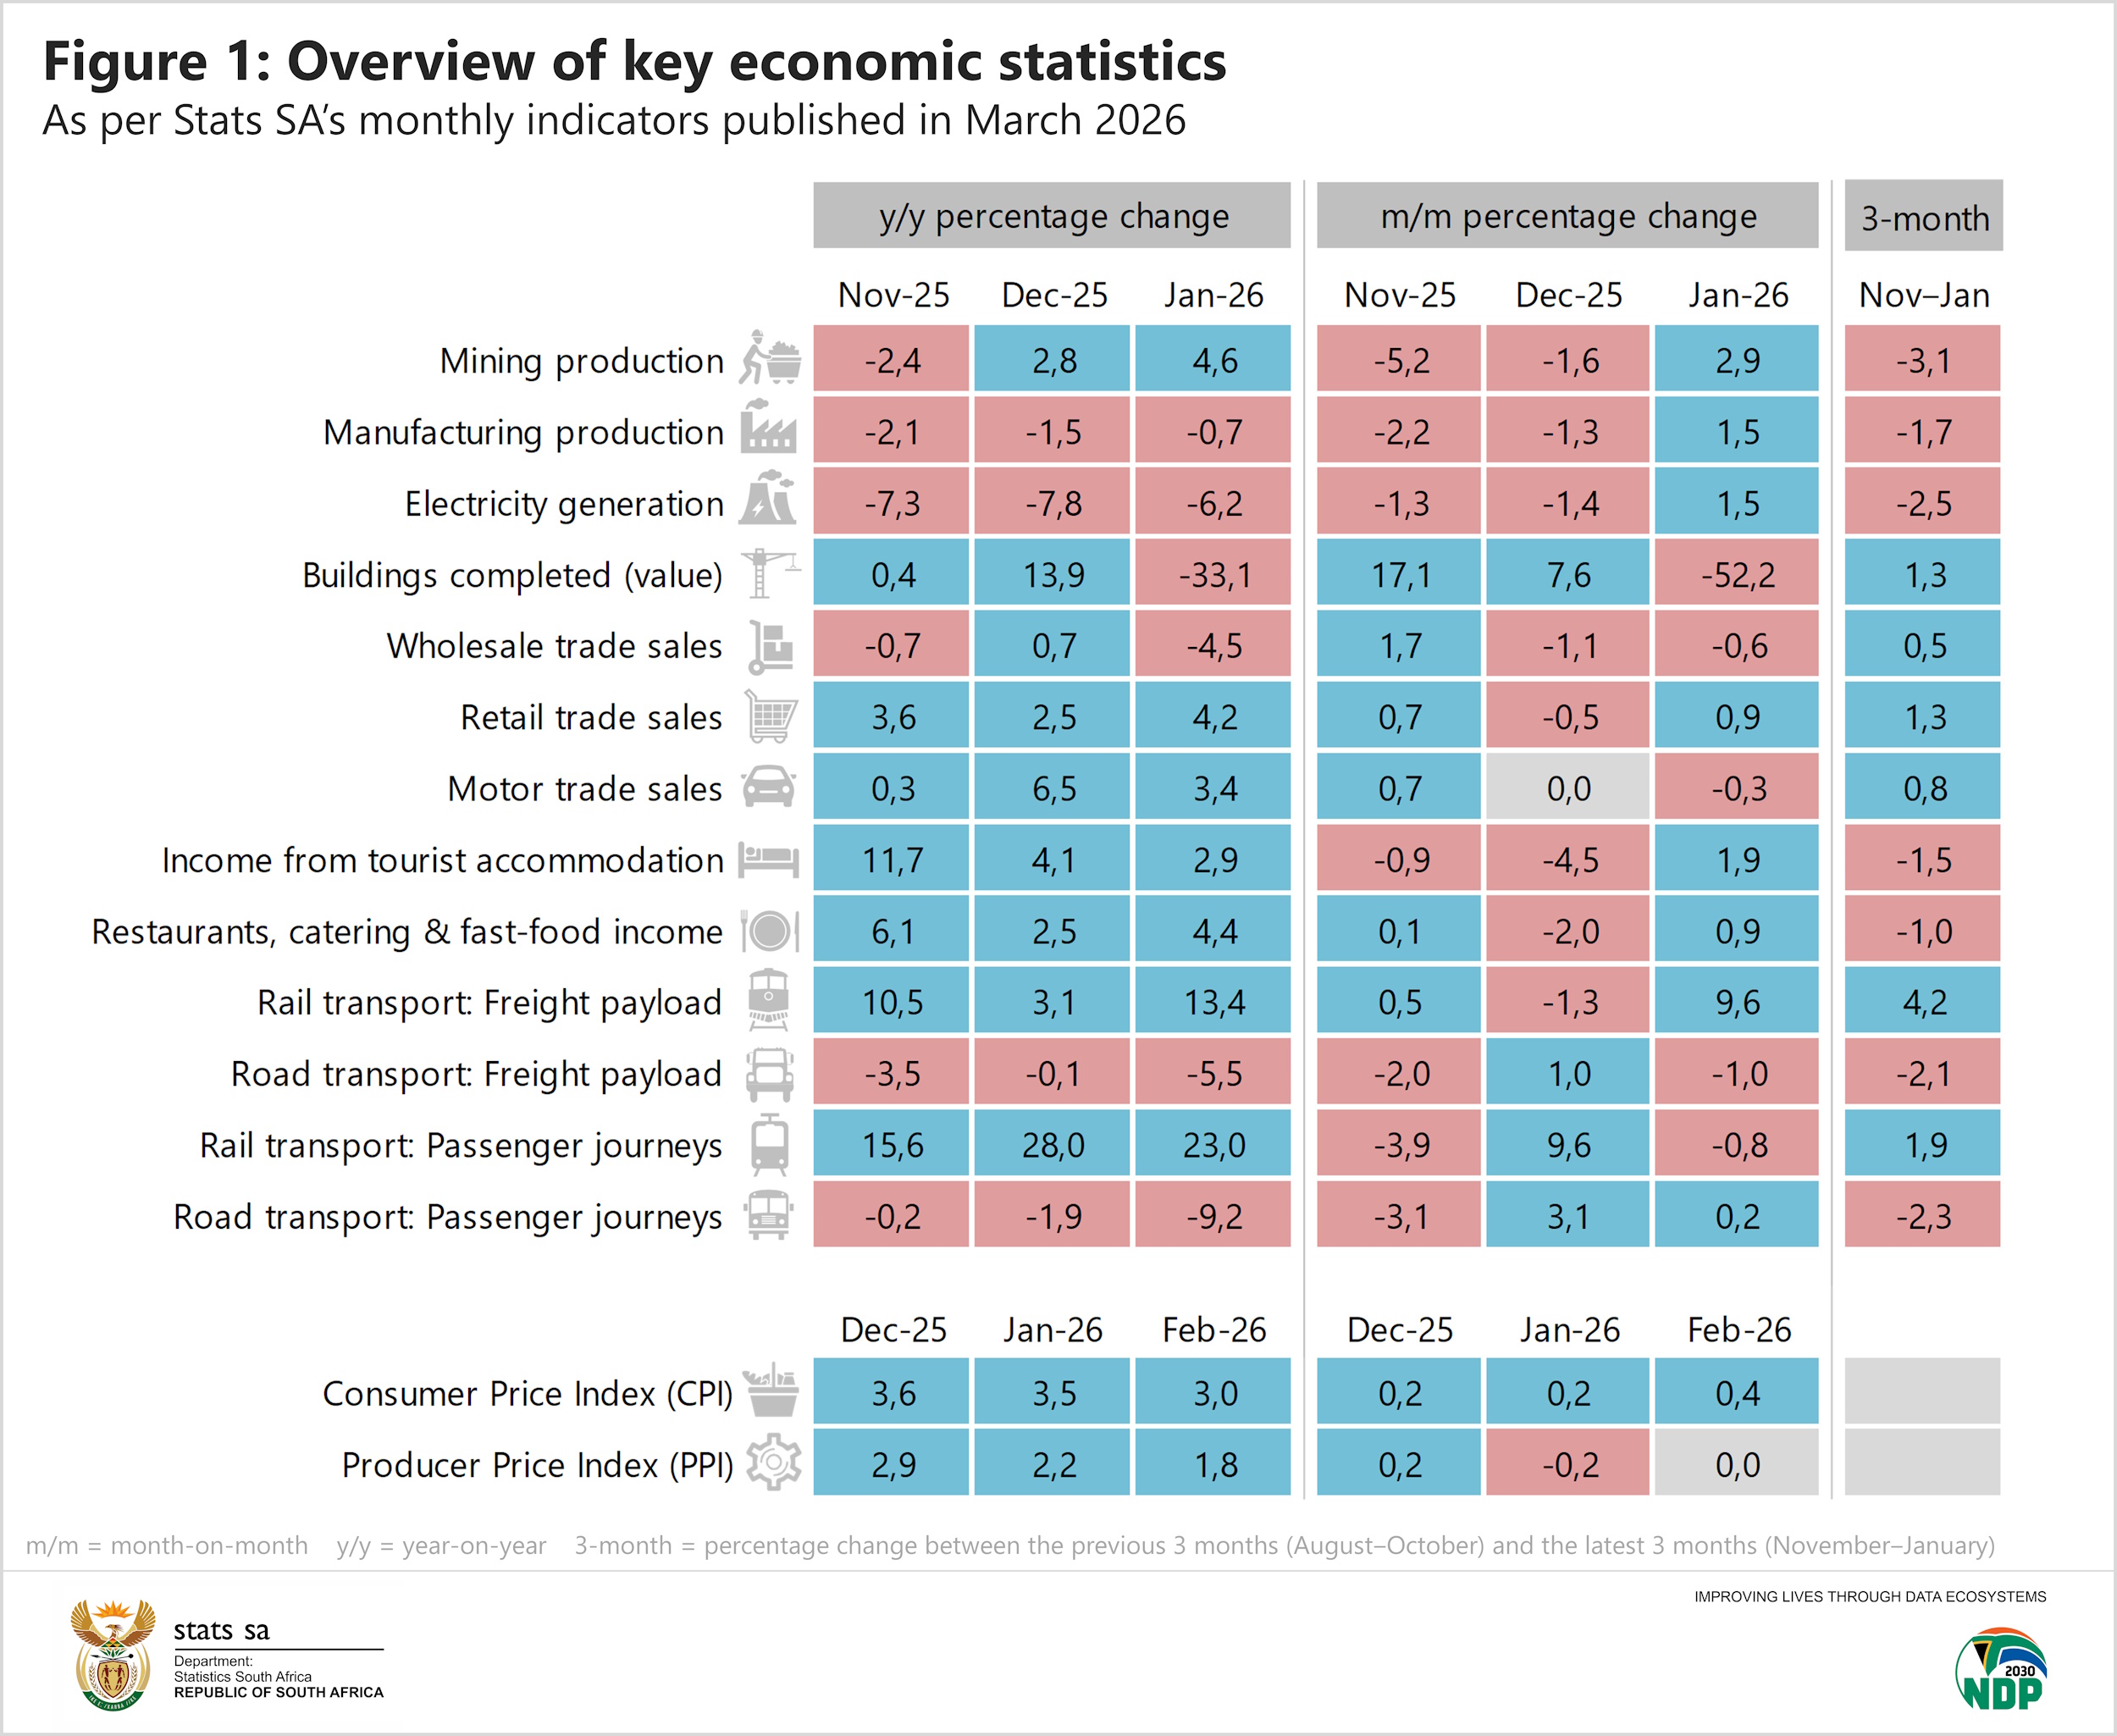
South African mining activity increased by 4,6% year-on-year, with platinum group metals, chromium ore and manganese ore driving most of the upward momentum. Together, these three minerals contributed 5,5 percentage points to overall growth. There was also an uptick in gold and diamonds. However, the industry produced less copper, nickel, iron ore and coal compared with January 2025.
Manufacturing output slipped by 0,7%. The decline was due to weaker activity in wood, paper, publishing & printing; iron, steel, metals & machinery; and food & beverages. Seven manufacturing divisions recorded stronger year-on-year growth, but this was not enough to lift the industry into favourable territory. The petroleum, chemical products, rubber & plastic products division was the most significant positive contributor, expanding by 6,7%.
Electricity generation continued a downward trend, shrinking by 6,2% year-on-year. The volume of electricity delivered to provinces was also weaker, with eight of the nine provinces recording a decline. Western Cape was the exception, registering a rise in electricity delivered.
The economy expands in 2025
The latest GDP estimates for the fourth quarter of 2025 provide an overview of the calendar year. South Africa’s economy grew by 1,1% in 2025, following increases of 0,5% in 2024 and 0,8% in 2023. Seven of the ten industries expanded in 2025, with agriculture recording the highest growth rate at 17,4%.
Manufacturing; electricity, gas & water; and construction contracted in 2025. The GDP time series shows construction recording its ninth consecutive year of decline. The size of the construction industry (in constant 2015 prices) was estimated at R156,0 billion in 2016, eroding to R99,1 billion in 2025.
Tourism on the upswing
Two statistical outputs in March paint a positive picture of tourism. The latest Tourism Satellite Account for South Africa statistical report showed an uptick in tourism’s contribution to both economic activity and employment in 2024. The size of the tourism sector’s workforce surpassed pre-pandemic levels for the first time, reaching just under one million individuals.
Visitor numbers were also up, according to the International Tourism statistical report for 2025. The country saw 10,5 million tourists grace its shores that year, up from 8,9 million in 2024 and surpassing the 2019 level of 10,2 million.
Interested to know more? Keep up to date with our publication schedule here. For a comprehensive list of products and releases, download our catalogue here. For a regular update of indicators and infographics, visit our data story feed and download the latest edition of the Stats Biz newsletter.