
Buoyant tourism records employment and economic gains
South Africa’s tourism sector had a rough time during the COVID-19 pandemic. Plummeting visitor numbers led to a decline in economic activity and job losses across the industry. Recovery has been slow, but recent data show a positive trend.
Employment, economic activity and domestic tourism expenditure have all rebounded, according to the latest Tourism Satellite Account for South Africa (TSA) statistical report. Inbound (non-resident) tourism expenditure, however, continues to lag pre-pandemic levels.
Tourism employment rises to almost 1 million
The most positive sign was on the employment front. In 2019, an estimated 777 686 individuals were directly employed by the tourism sector, declining sharply to 456 311 individuals in 2020 as the pandemic took hold (see Figure 1 below).
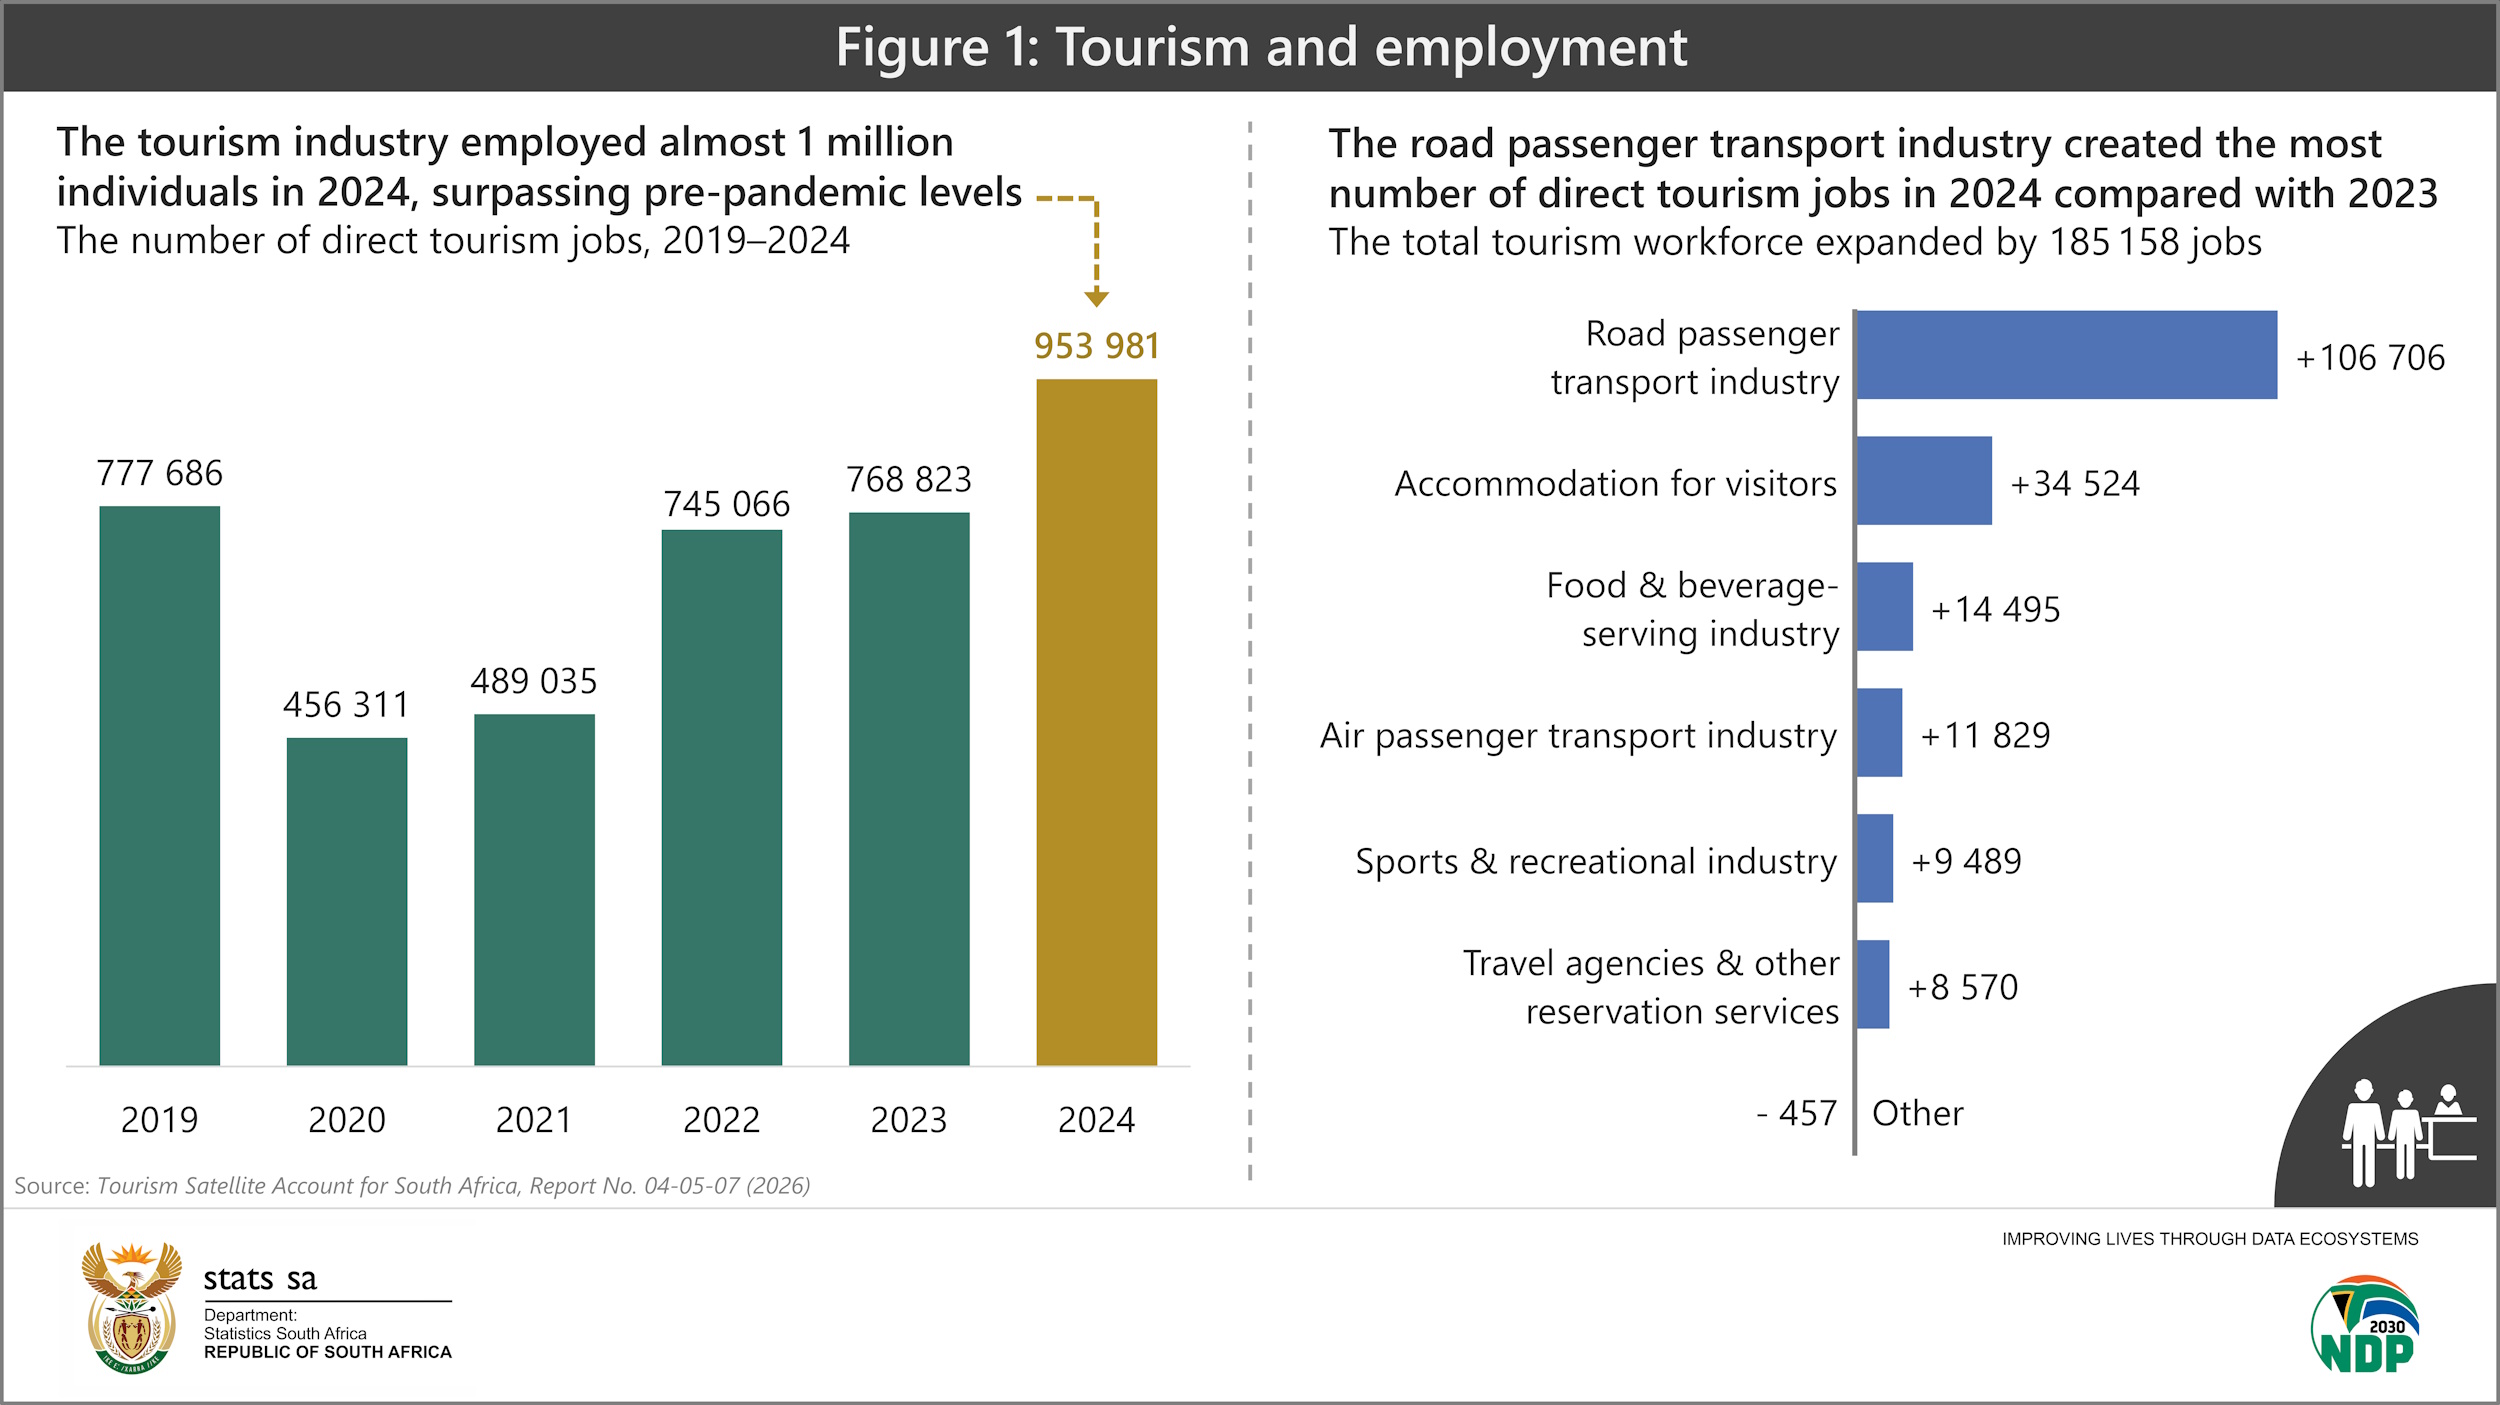
The workforce has slowly bounced back, rising to an estimated 953 981 individuals in 2024. The tourism sector created 185 158 jobs in 2024 alone, with the road passenger transport industry the main driver of employment growth.
The tourism sector now rivals several other industries in terms of workforce size. It employs more individuals than the respective industries of agriculture, mining and utilities (electricity, gas & water).1
In fact, the number of direct tourism jobs accounted for 5,7% of all jobs in the South African labour force, up from 4,8% in 2019. To put it another way, 1 in 18 workers was directly employed in tourism during 2024.
Tourism contributes 4,9% to GDP
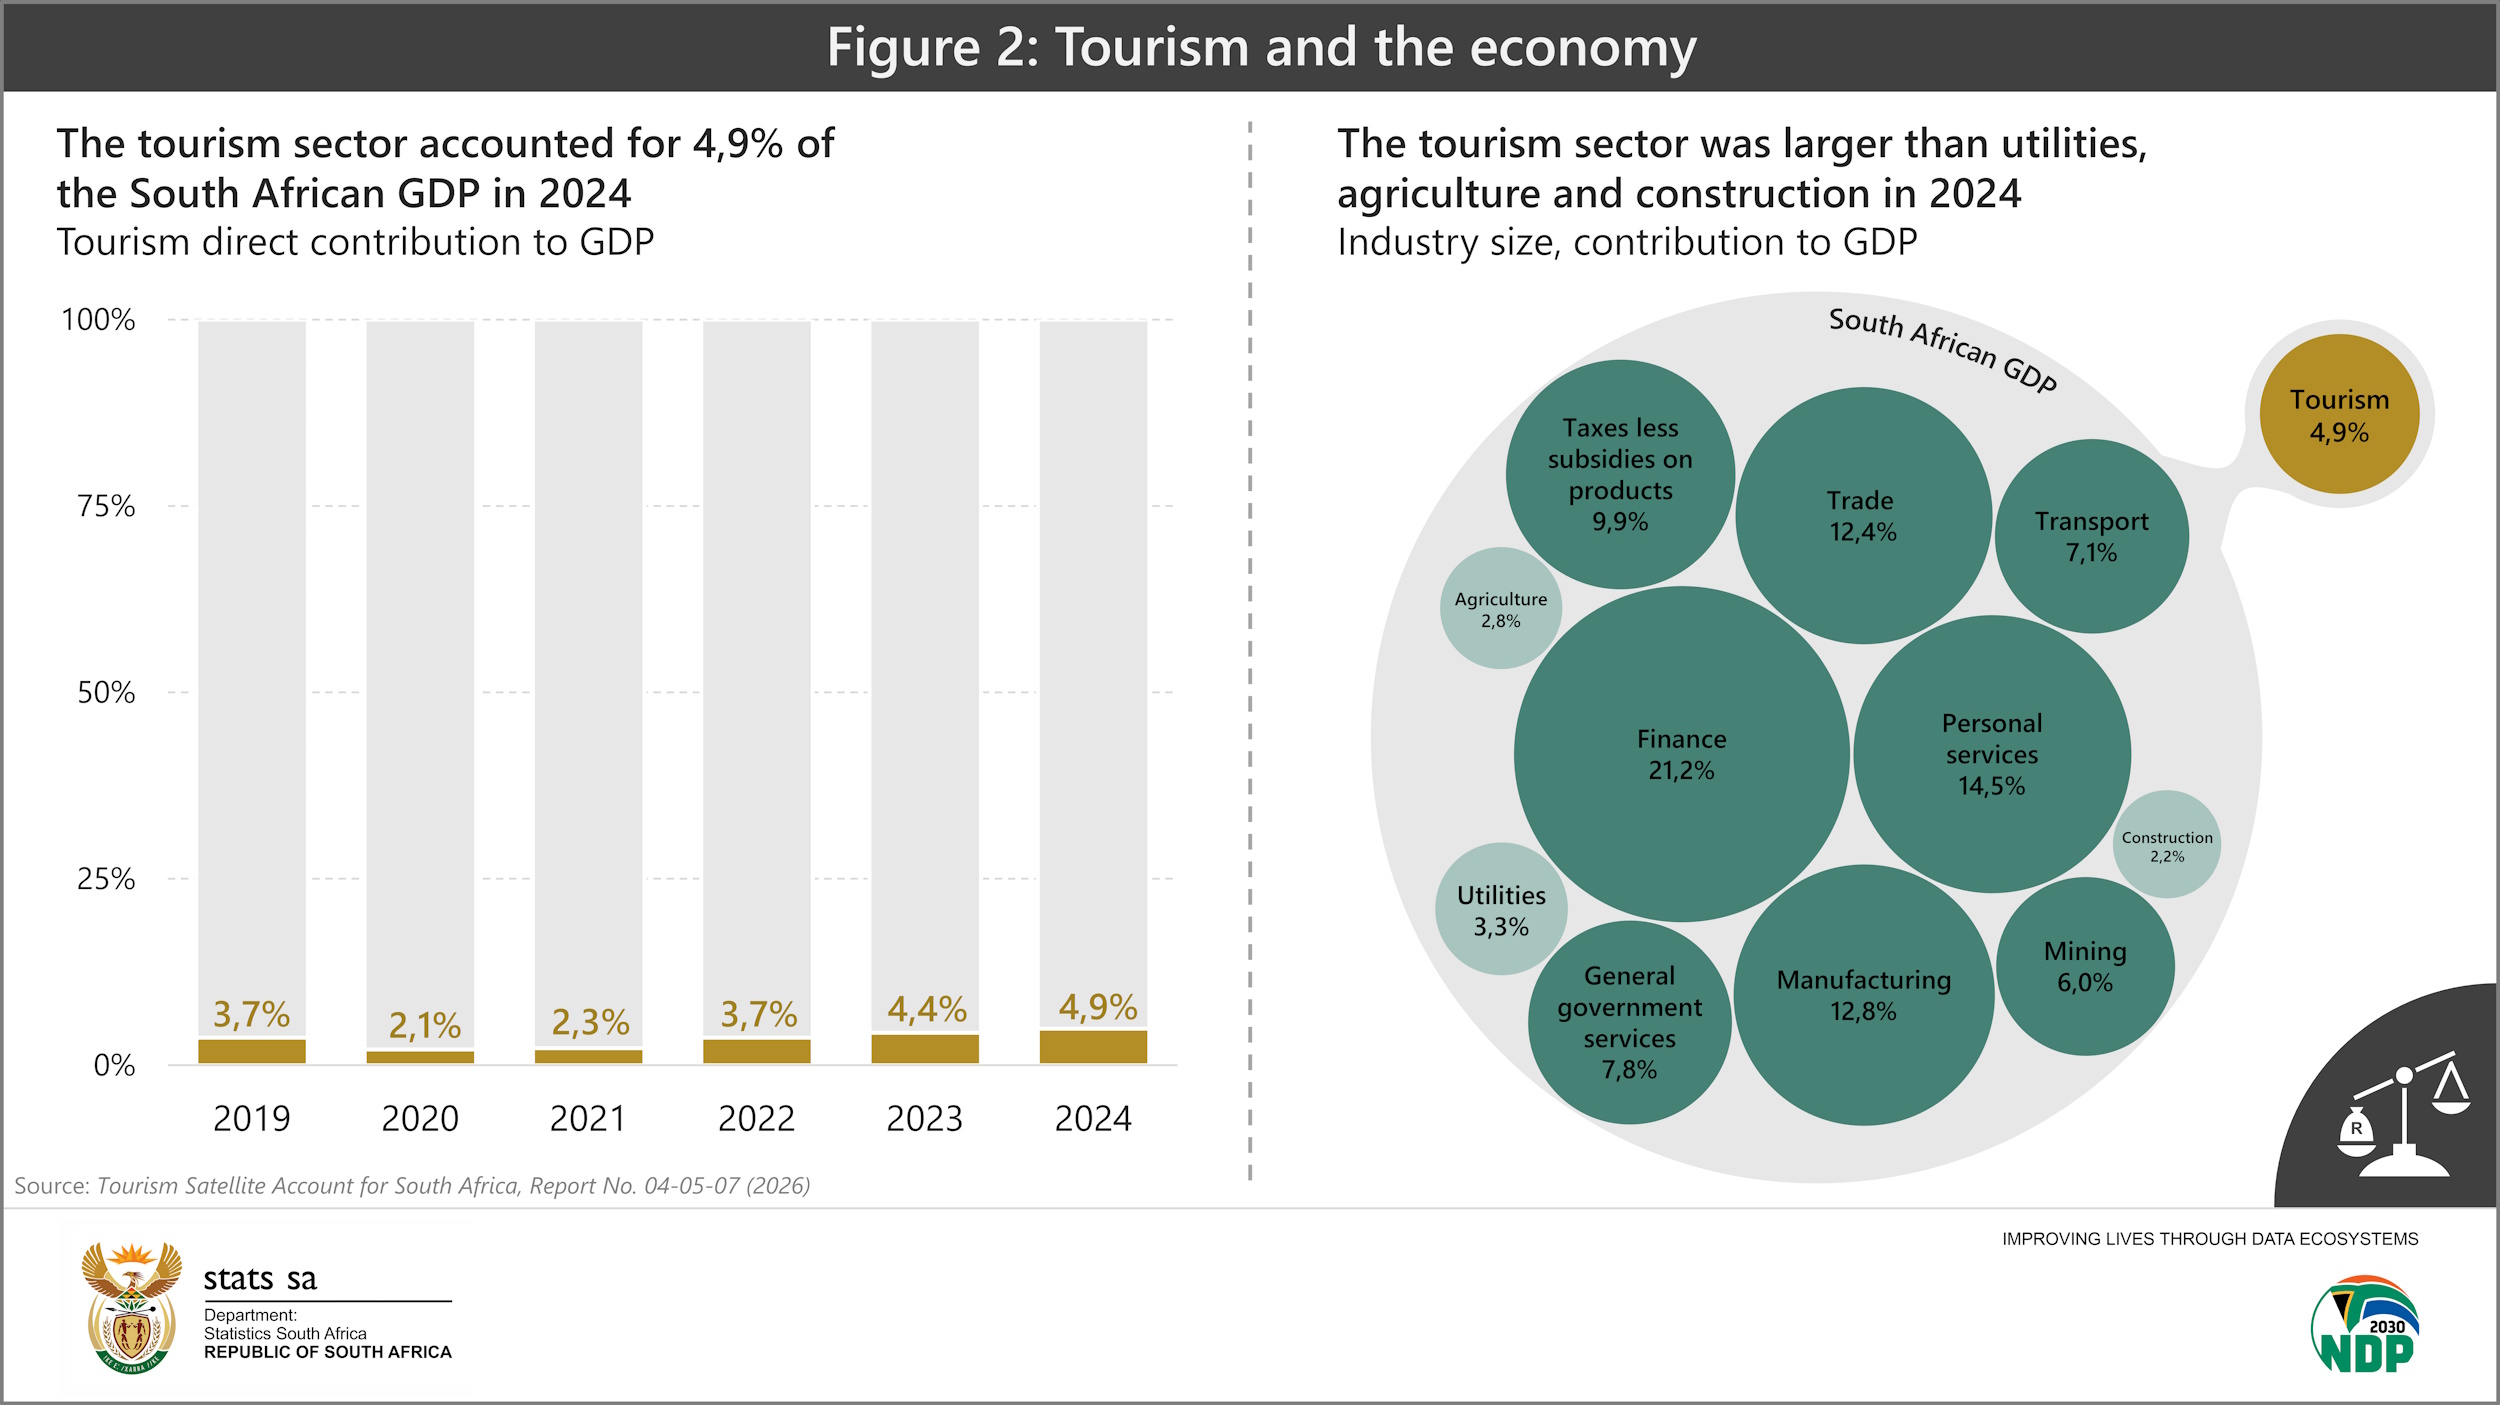
Tourism has strengthened its role as an engine of economic activity. The sector contributed R208,5 billion (or 3,7%) to the South African gross domestic product (GDP) in 2019. After dipping to 2,1% in 2020, its contribution grew to R361,7 billion (or 4,9%) in 2024.
In other words, for every R100 produced by the South African economy, R4,90 was generated by tourism, making the sector larger than utilities, agriculture and construction (see Figure 2 below).2
Inbound tourism expenditure is overshadowed by domestic spending
The TSA captures how much money visitors spend during their travels. Internal tourism expenditure refers to total tourism spending in the country by both domestic (resident) and inbound (non-resident) visitors. In 2024, internal tourism expenditure amounted to R779,2 billion. The chart on the left in Figure 3 below shows how domestic tourism expenditure dominates, accounting for 85% of the R779,2 billion. Inbound (non-resident) visitors contributed the remaining 15%.
Whereas domestic tourism expenditure has shown a notable recovery since the COVID-19 pandemic, inbound tourism expenditure remains subdued. Non-resident visitors spent R121,5 billion in 2019, declining to R25,2 billion in 2021. Despite there being some growth, inbound tourism expenditure remains below pre-pandemic levels at R113,9 billion in 2024.
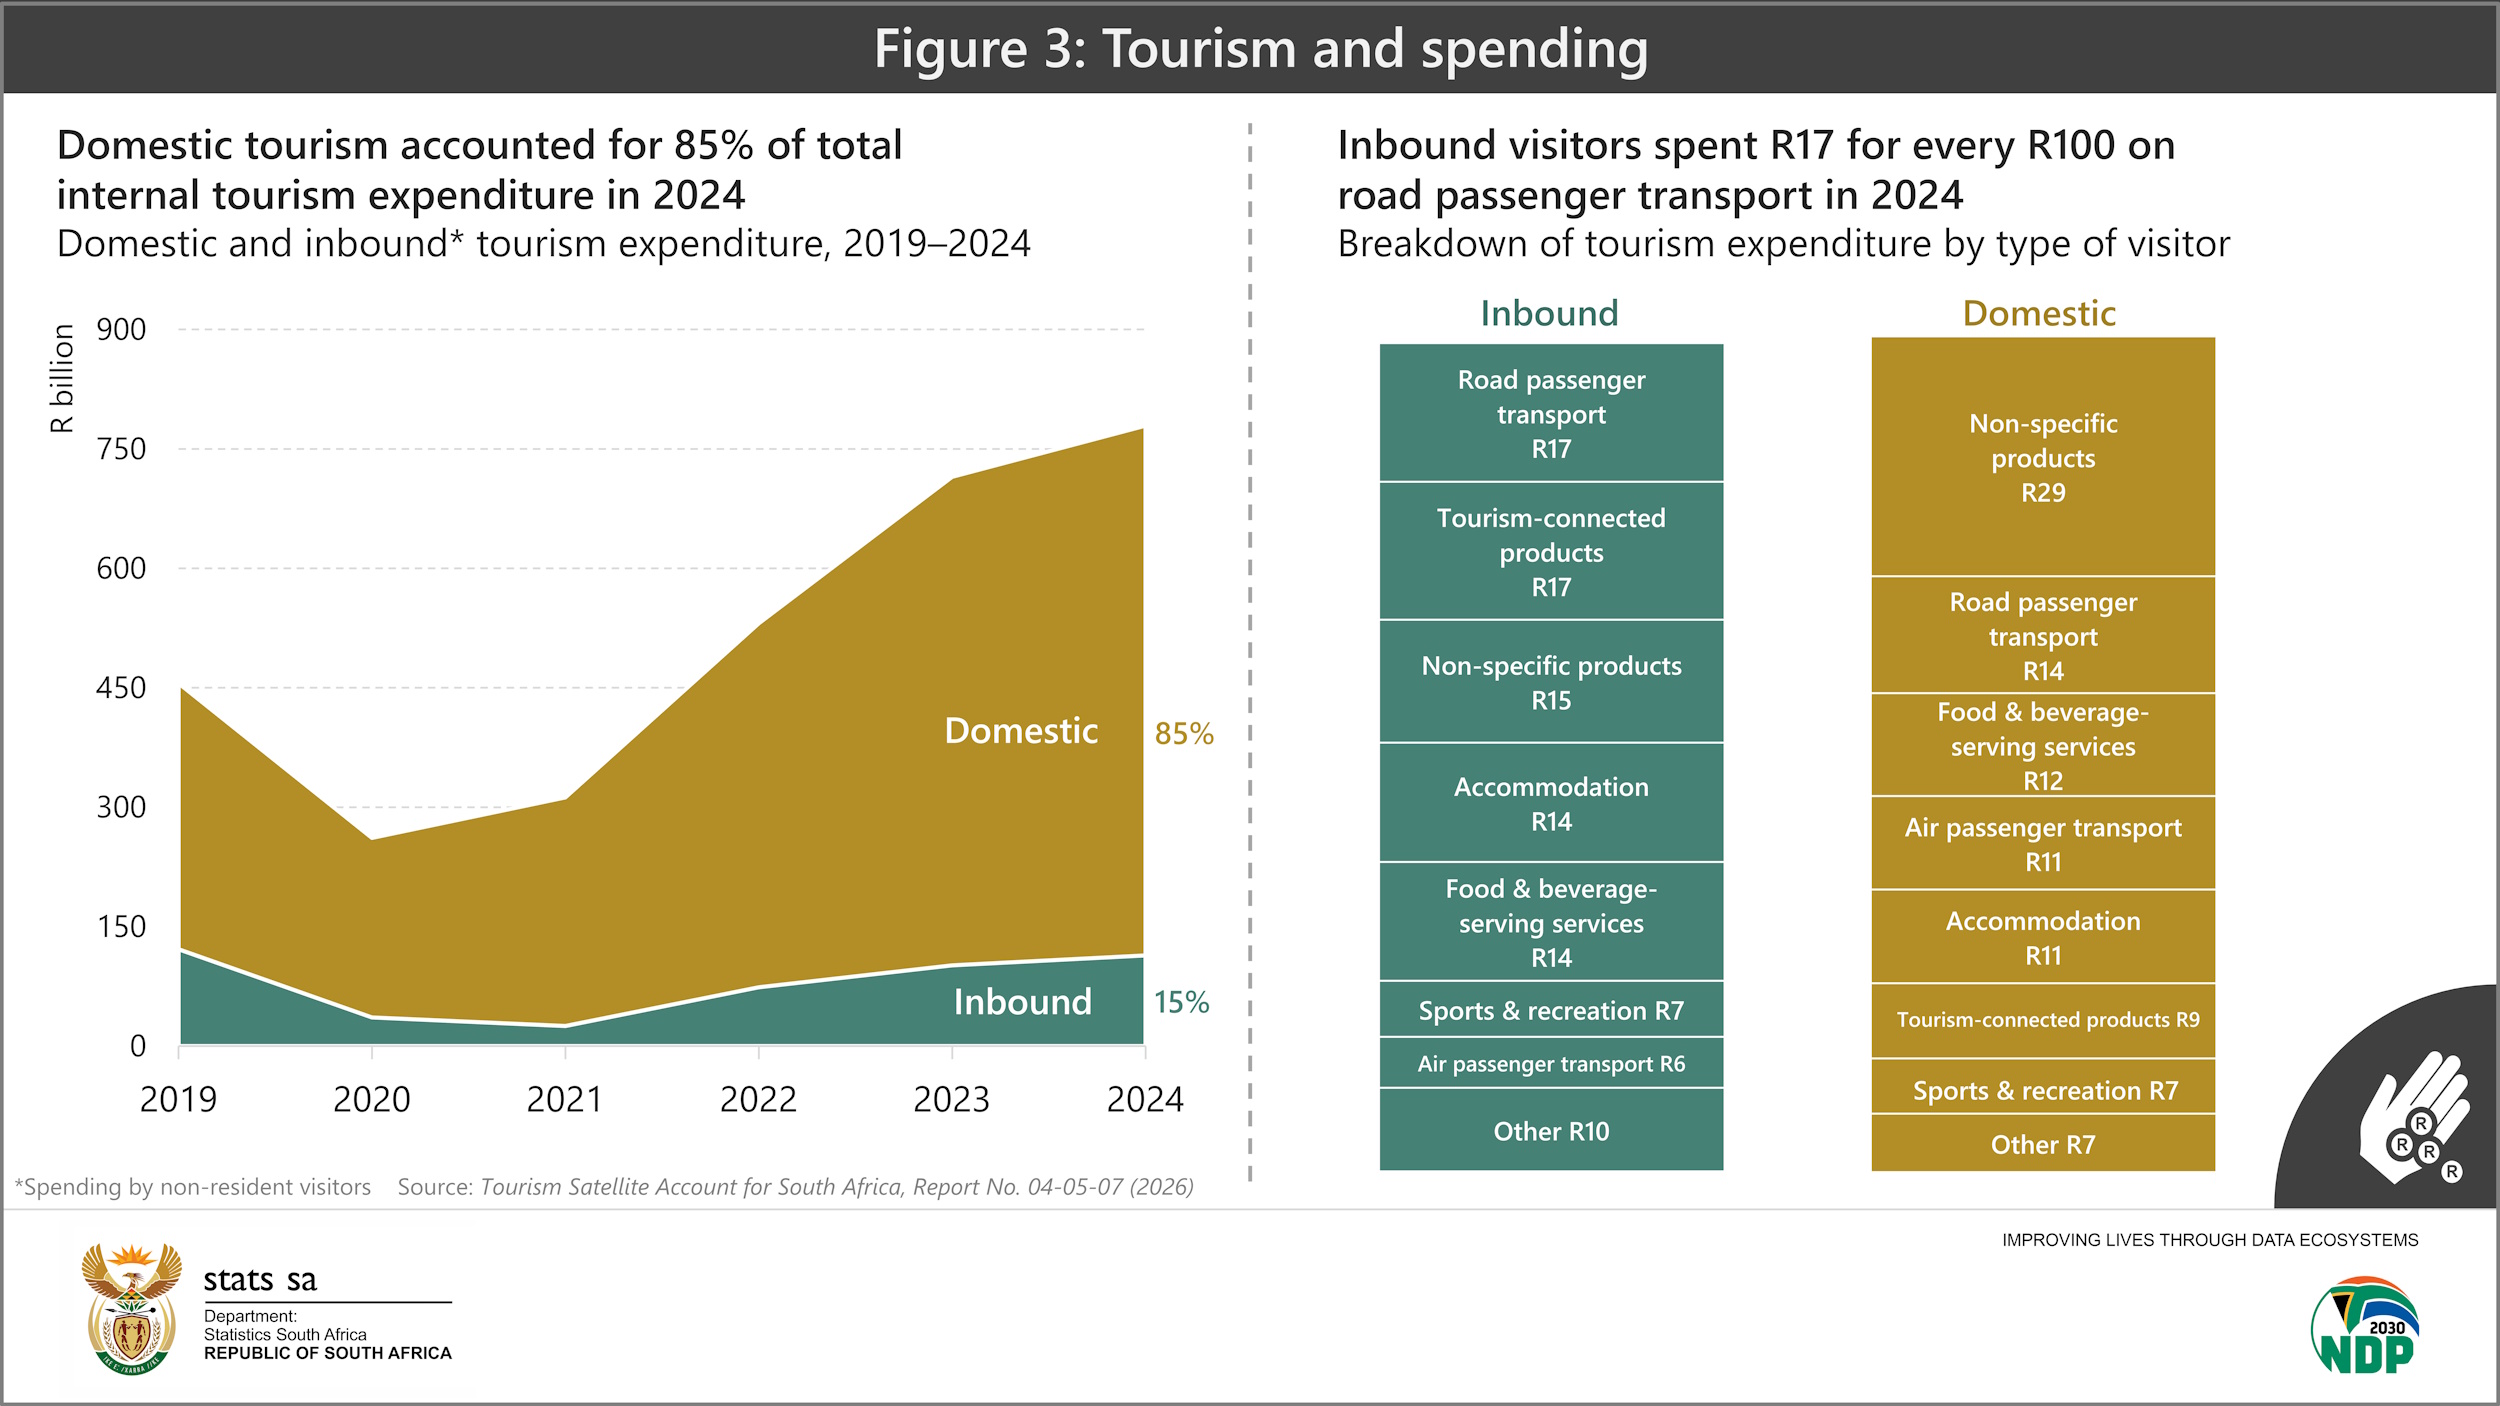
Spending patterns differ between inbound and domestic visitors. In 2024, inbound (non-resident) visitors spent R17 of every R100 on road passenger transport, followed by tourism-connected products. Domestic tourists spent R29 of every R100 on non-specific products.
What is the difference between tourism-characteristic, tourism-connected and non-specific products? The TSA classifies products into three general categories. First, there are tourism-characteristic products that are heavily dependent on visitor activity. These would largely cease to exist if visitors suddenly stopped travelling. Accommodation for visitors and air passenger transport are examples. Second, tourism-connected products are generally less dependent on tourism and include general retail items such as food, fuel, and clothing. Finally, non-specific products include all items that are not specifically tourism-related but are still consumed by visitors in small quantities.
In summary
The latest TSA provides insight into the current state of tourism in the country, painting a picture of a sector that has experienced some recovery from the COVID-19 pandemic, in terms of employment and economic activity. Domestic tourism expenditure continues to increase. Inbound (non-resident) expenditure, however, remains below pre-pandemic levels.
For more information, download the Tourism Satellite Account for South Africa, final 2020, 2021 and provisional 2022, 2023 and 2024 statistical report here.
1 For an employment breakdown of all industries in 2024, see Table 4.1 (page 40) in the Labour Market Dynamics in South Africa statistical report here.
2 An industry breakdown of the gross domestic product (GDP) is available in tab 1 of the ‘GDP P0441- Q4 2025’ Excel file, available for download here.
Similar articles are available on the Stats SA website and can be accessed here.
For a monthly overview of economic indicators and infographics, catch the latest edition of the Stats Biz newsletter here.