

In cities and townships, on busy streets and in small neighbourhood markets, a significant part of South Africa’s economy goes about its work. It operates without being covered by formal arrangements, yet it supports millions of people. The informal sector is a vital source of income in a country facing persistent unemployment and inequality.
This has become even more relevant since the third quarter of 2025, when South Africa adopted the refined definitions for informality recommended by the 21st International Conference of Labour Statisticians (ICLS). Under these updated guidelines, the informal sector is now defined primarily by whether a business is registered for VAT or income tax, or whether the business keeps records for tax purposes, or registration with the Companies and Intellectual Property Commission (CIPC). The size of the enterprise, once a key indicator, is no longer the main criterion.
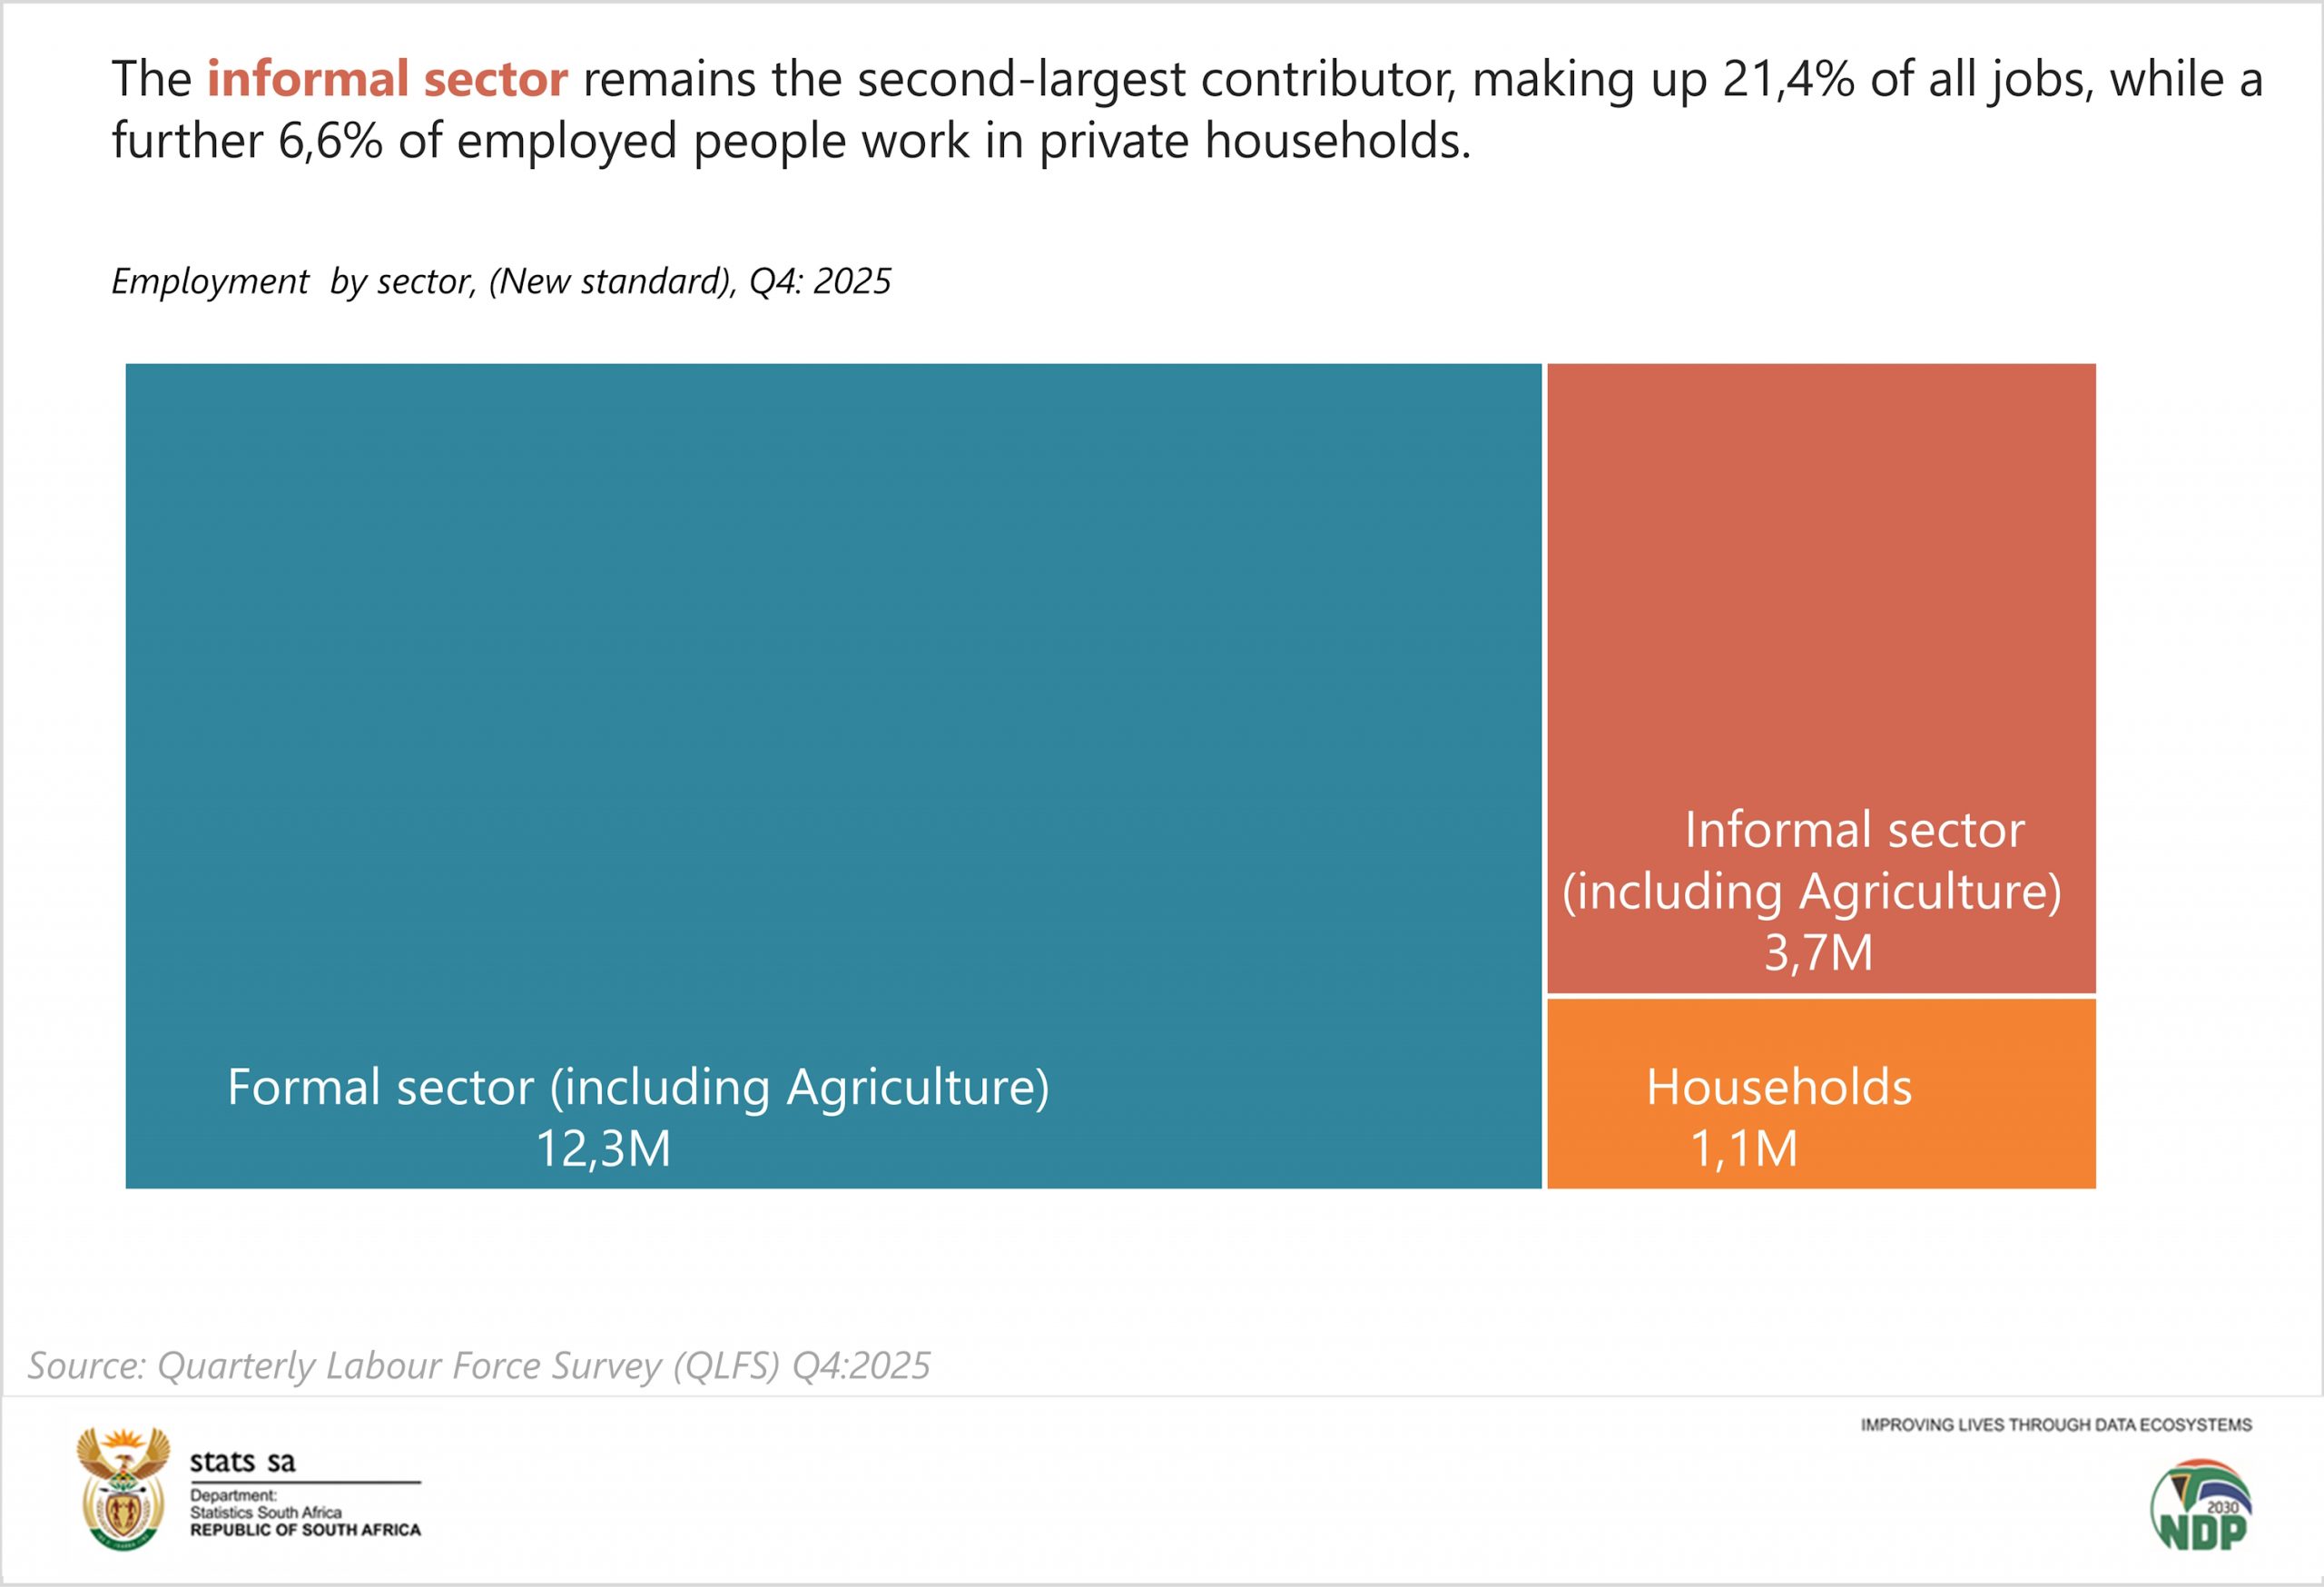
According to the Quarterly Labour Force Survey (QLFS Q4:2025), there were 17,1 million employed people in South Africa in the fourth quarter of 2025 – an increase of 44 000 compared with the previous quarter. Most of these workers are found in the formal sector, which still dominates the labour market and accounts for 72,0% of total employment. The informal sector remains the second‑largest contributor, making up 21,4% of all jobs, while a further 6,6% of employed people work in the household sector.
The shifts between the third and fourth quarters of 2025 show how uneven employment changes can be across different parts of the economy. Most of the gains came from the formal sector, which added 320 000 jobs. Employment in private households also increased, although on a much smaller scale, with an increase of 18 000 people. In contrast, the informal sector saw a decline, losing 293 000 workers over the same period.
Looking across industries within both the formal and informal sectors, the overall increase in employment was driven by growth in Community and social services (46 000), Construction (35 000), Finance (32 000) and Agriculture (30 000). Conversely, Trade recorded the biggest loss at 98 000 jobs, followed by Manufacturing (61 000) and Mining (5 000).
The informal sector was particularly affected, with most of its job losses coming from Trade, which shed 100 000 jobs. Agriculture followed with 79 000 fewer informal sector workers, along with Manufacturing (58 000) and Finance (39 000). These shifts show how sensitive informal sector work is to changing economic conditions and highlight the sectors where workers face the greatest instability.
Informal employment, meanwhile, focuses on the nature of the job rather than the type of business. It identifies workers who lack access to essential employment protections, including social insurance like pensions, paid annual and paid sick leave-regardless of whether they work in the formal or informal sector. This shift brings greater clarity to how informal employment is measured and offers a more accurate picture of the vulnerabilities many workers face.
The data also shows how employment is distributed across different employment arrangements. Of the 17,1 million people who were employed in the fourth quarter of 2025, 11,4 million people were in formal employment, while 5,7 million were in informal employment. These numbers show the significant role that informality continues to play, remaining a defining feature of South Africa’s labour market. About one in three employed people (33,5%) were in informal employment i.e. they worked without access to a pension or paid annual leave and paid sick leave. While informality affects both men and women, a slightly larger share of men were in informal employment: 34,6% compared with 32,0% of women. This pattern points to broader trends in who is most affected by job insecurity.
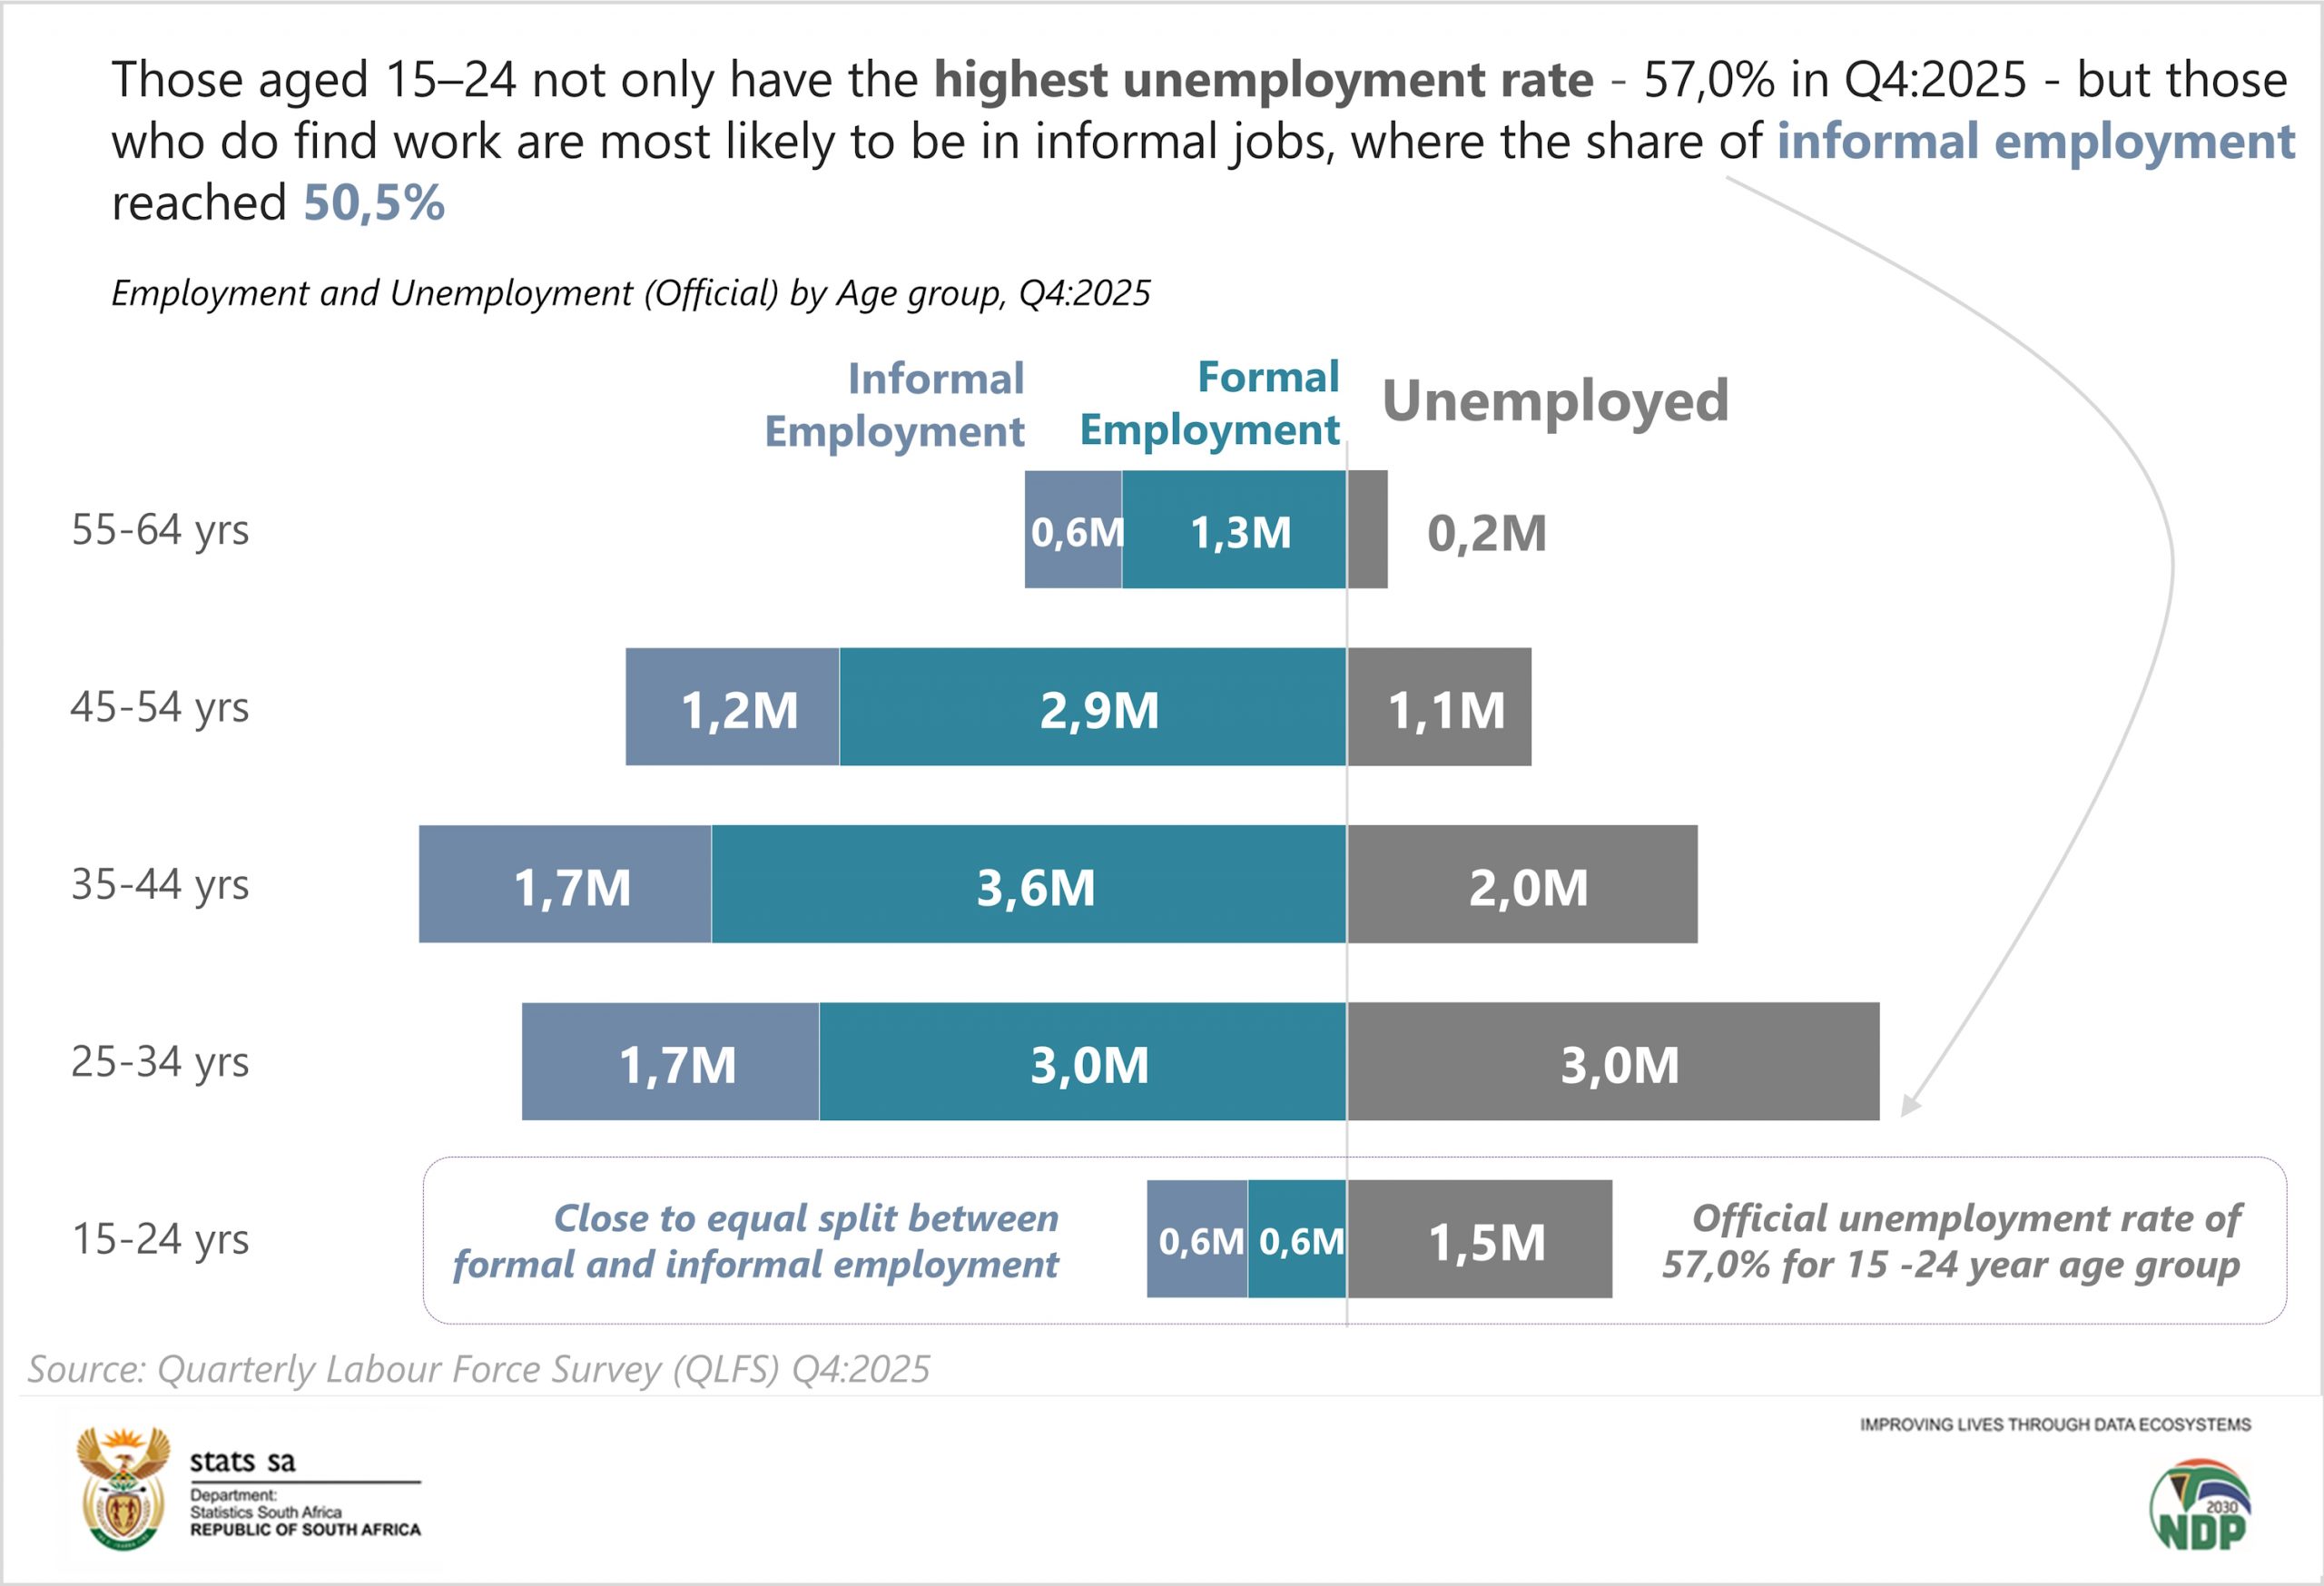
For young people, these challenges are even more pronounced. Those aged 15-24 not only have the highest unemployment rate – 57,0% in Q4:2025 – but those who do find work are most likely to be in informal employment. In this age group, the share of informal employment reached 50,5%, of total employment, the highest of any cohort.
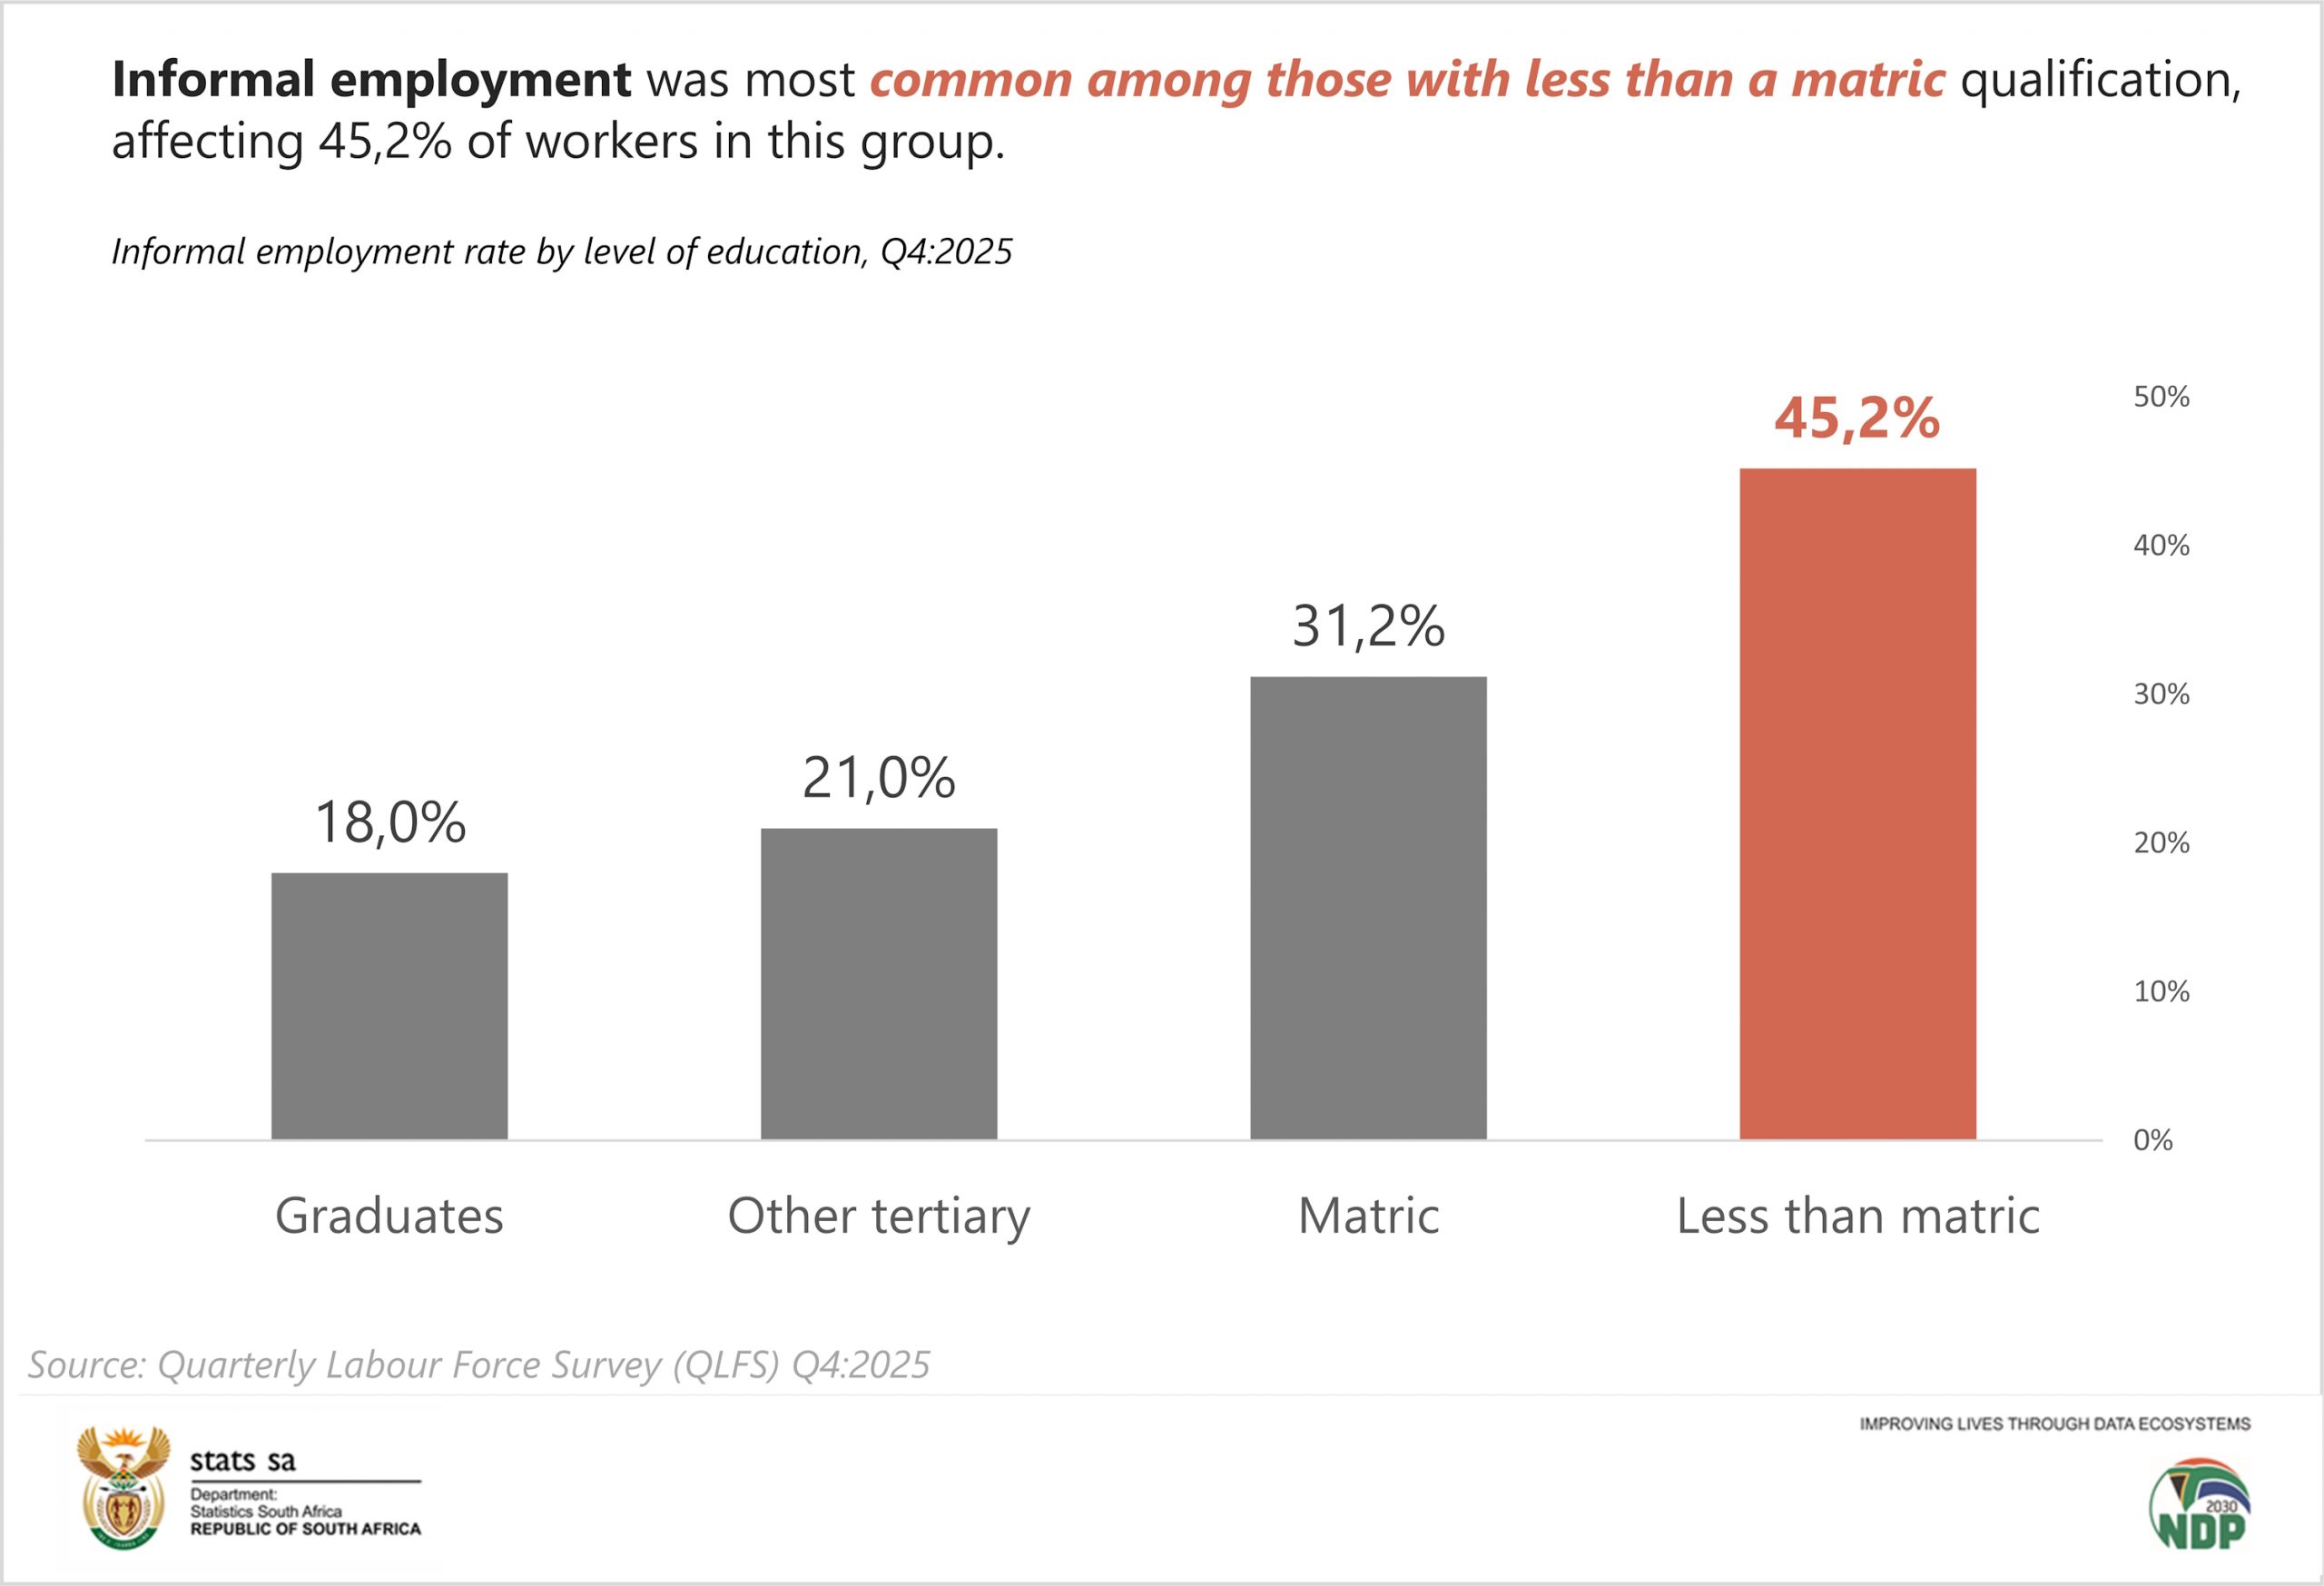
In Q4:2025, informal employment was most observed among those with less than a matric qualification, affecting 45,2% of workers in this group. The likelihood of being in informal employment drops to 31,2% for people who have completed matric, declines further to 21,0% for those with other tertiary qualifications, and reaches its lowest level – 18,0% – among graduates.
For more information, download the Quarterly Labour Force Survey (QLFS Q4:2025) here.