
A decade on from #FeesMustFall: Trends in tertiary education fees
Several tertiary education institutions are starting a new academic year this month. Stats SA provides the latest update on how higher education fees have shifted over time.
Just over 10 years ago, students across the country launched widespread protests against rising tuition fees. This had an impact on the finances of higher education institutions, covered in previous articles by Stats SA (most notably in 20201 and 20242).
More recent data provide a fresh perspective.
Tertiary education fees are increasing at a slower rate
Before 2016, annual tuition fee increases ran hot in the 8–10% range, consistently higher than general inflation.3 The largest rise in Figure 1 occurred in 2015, when fees jumped by 9,8%. The University of the Witwatersrand, for example, argued at the time that fee increases were needed to offset escalating costs caused by a weakening currency, salary increases, high inflation and a sharp rise in utility charges.4
Fee increases, however, make it more difficult for poorer students to access education.5
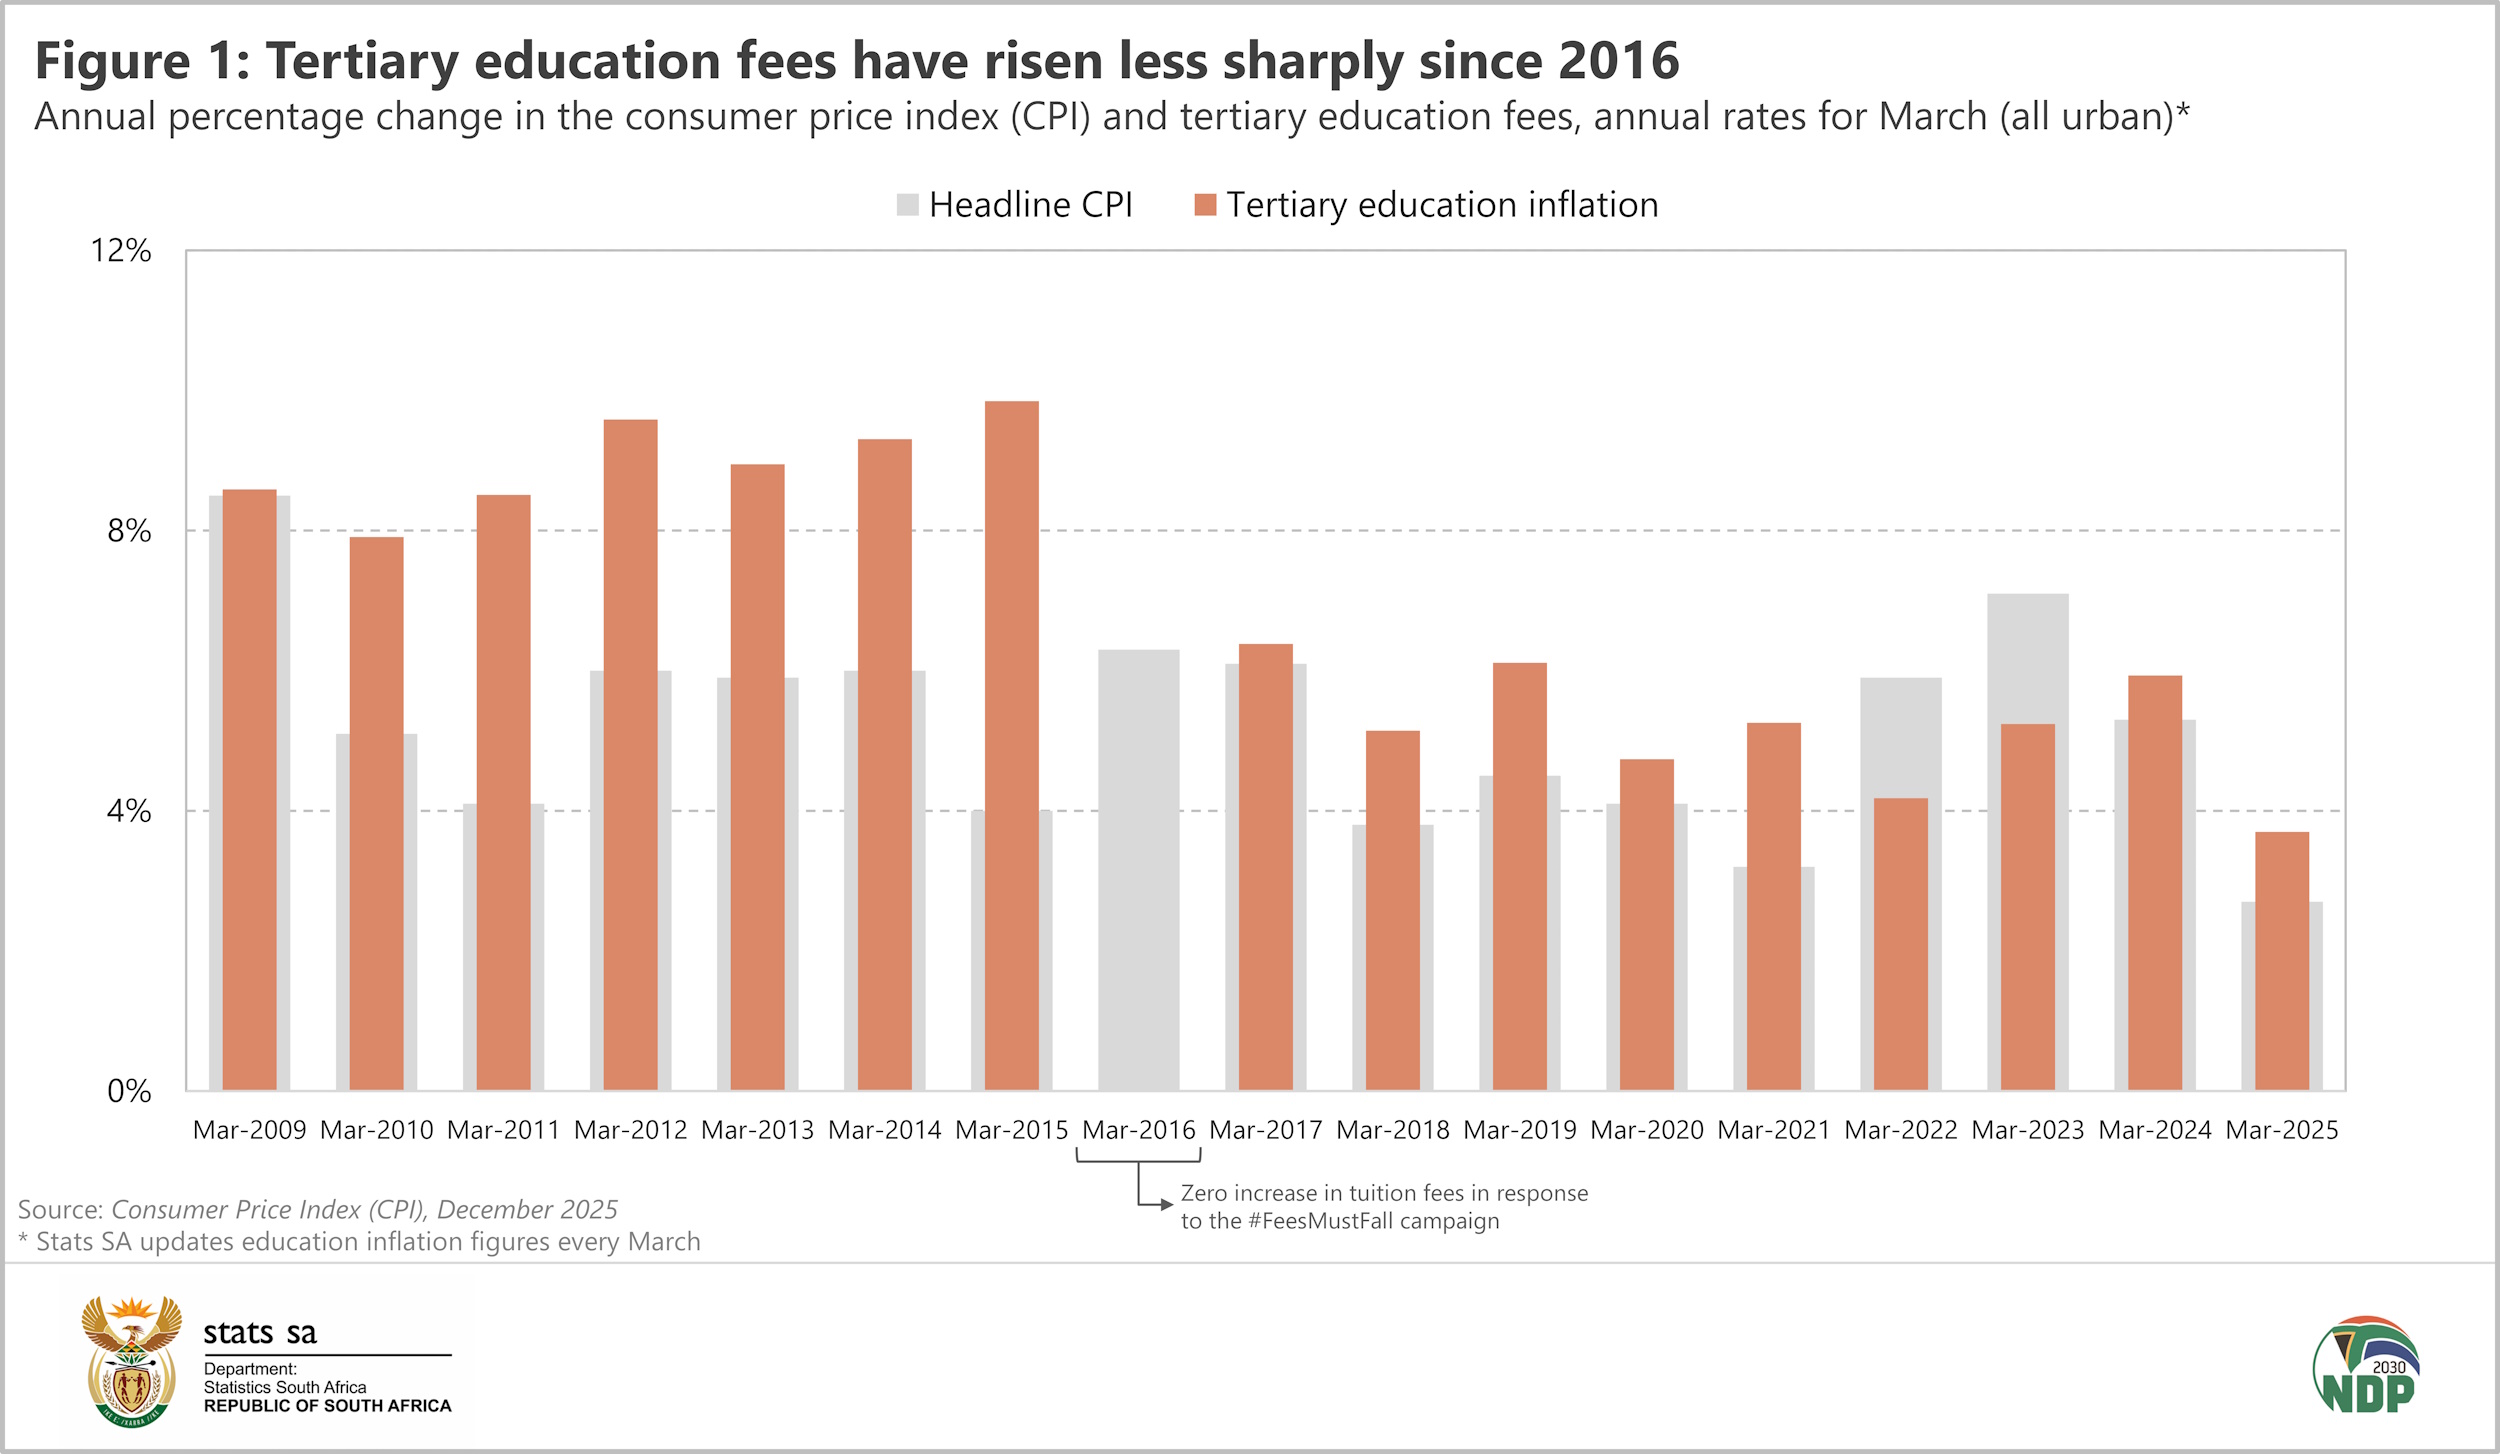
The impact of the #FeesMustFall movement is clear in the data. The government announced a 0% rise in tuition fees in 2016 in response to the 2015 protests. This is reflected by the missing orange bar for that year in Figure 1.
The 0% rise was once off. Increases resumed in 2017, but at a much slower pace.
Following a five-year rise, government funding has slowed
Higher education revenue from tuition fees flatlined in 2016 due to the 0% increase (Figure 2), according to Stats SA’s 2024 Financial statistics of higher education institutions statistical release. Grants (financial transfers from the government) rose sharply in the same year.
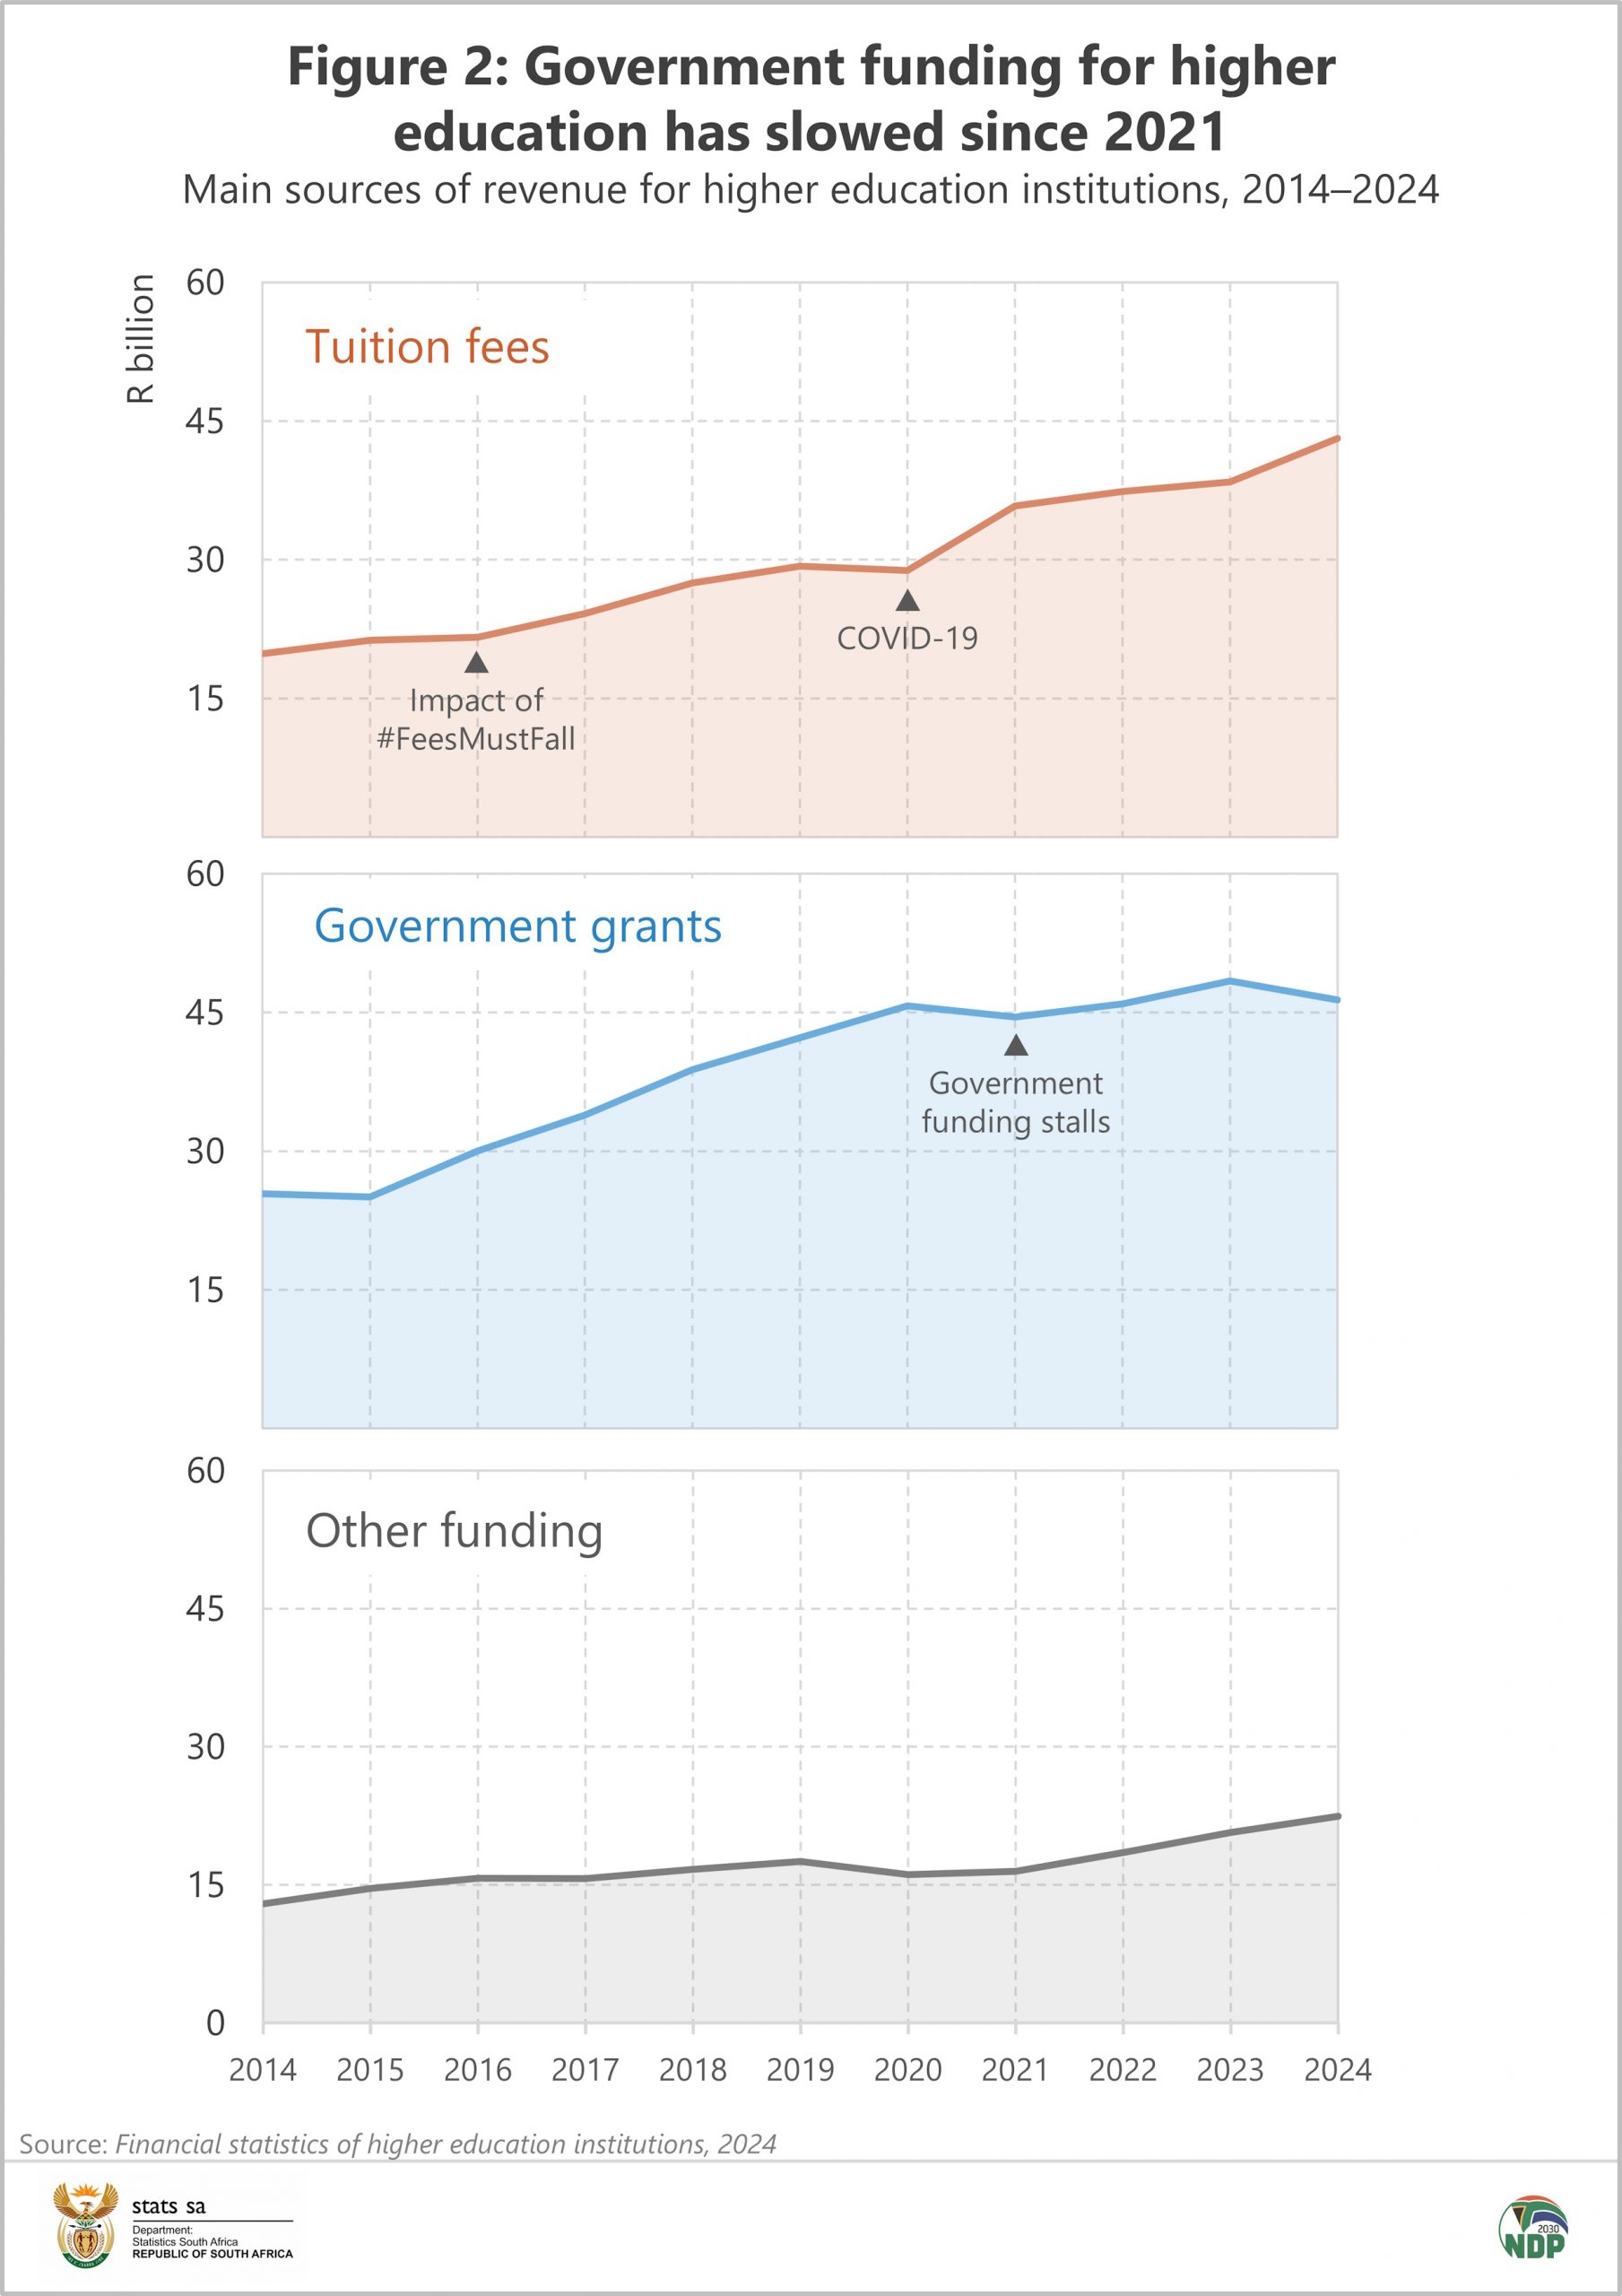
Government funding rose consistently for another four years before stalling in 2021. It witnessed relatively subdued growth since the end of the COVID-19 pandemic, remaining below R50 billion per year.
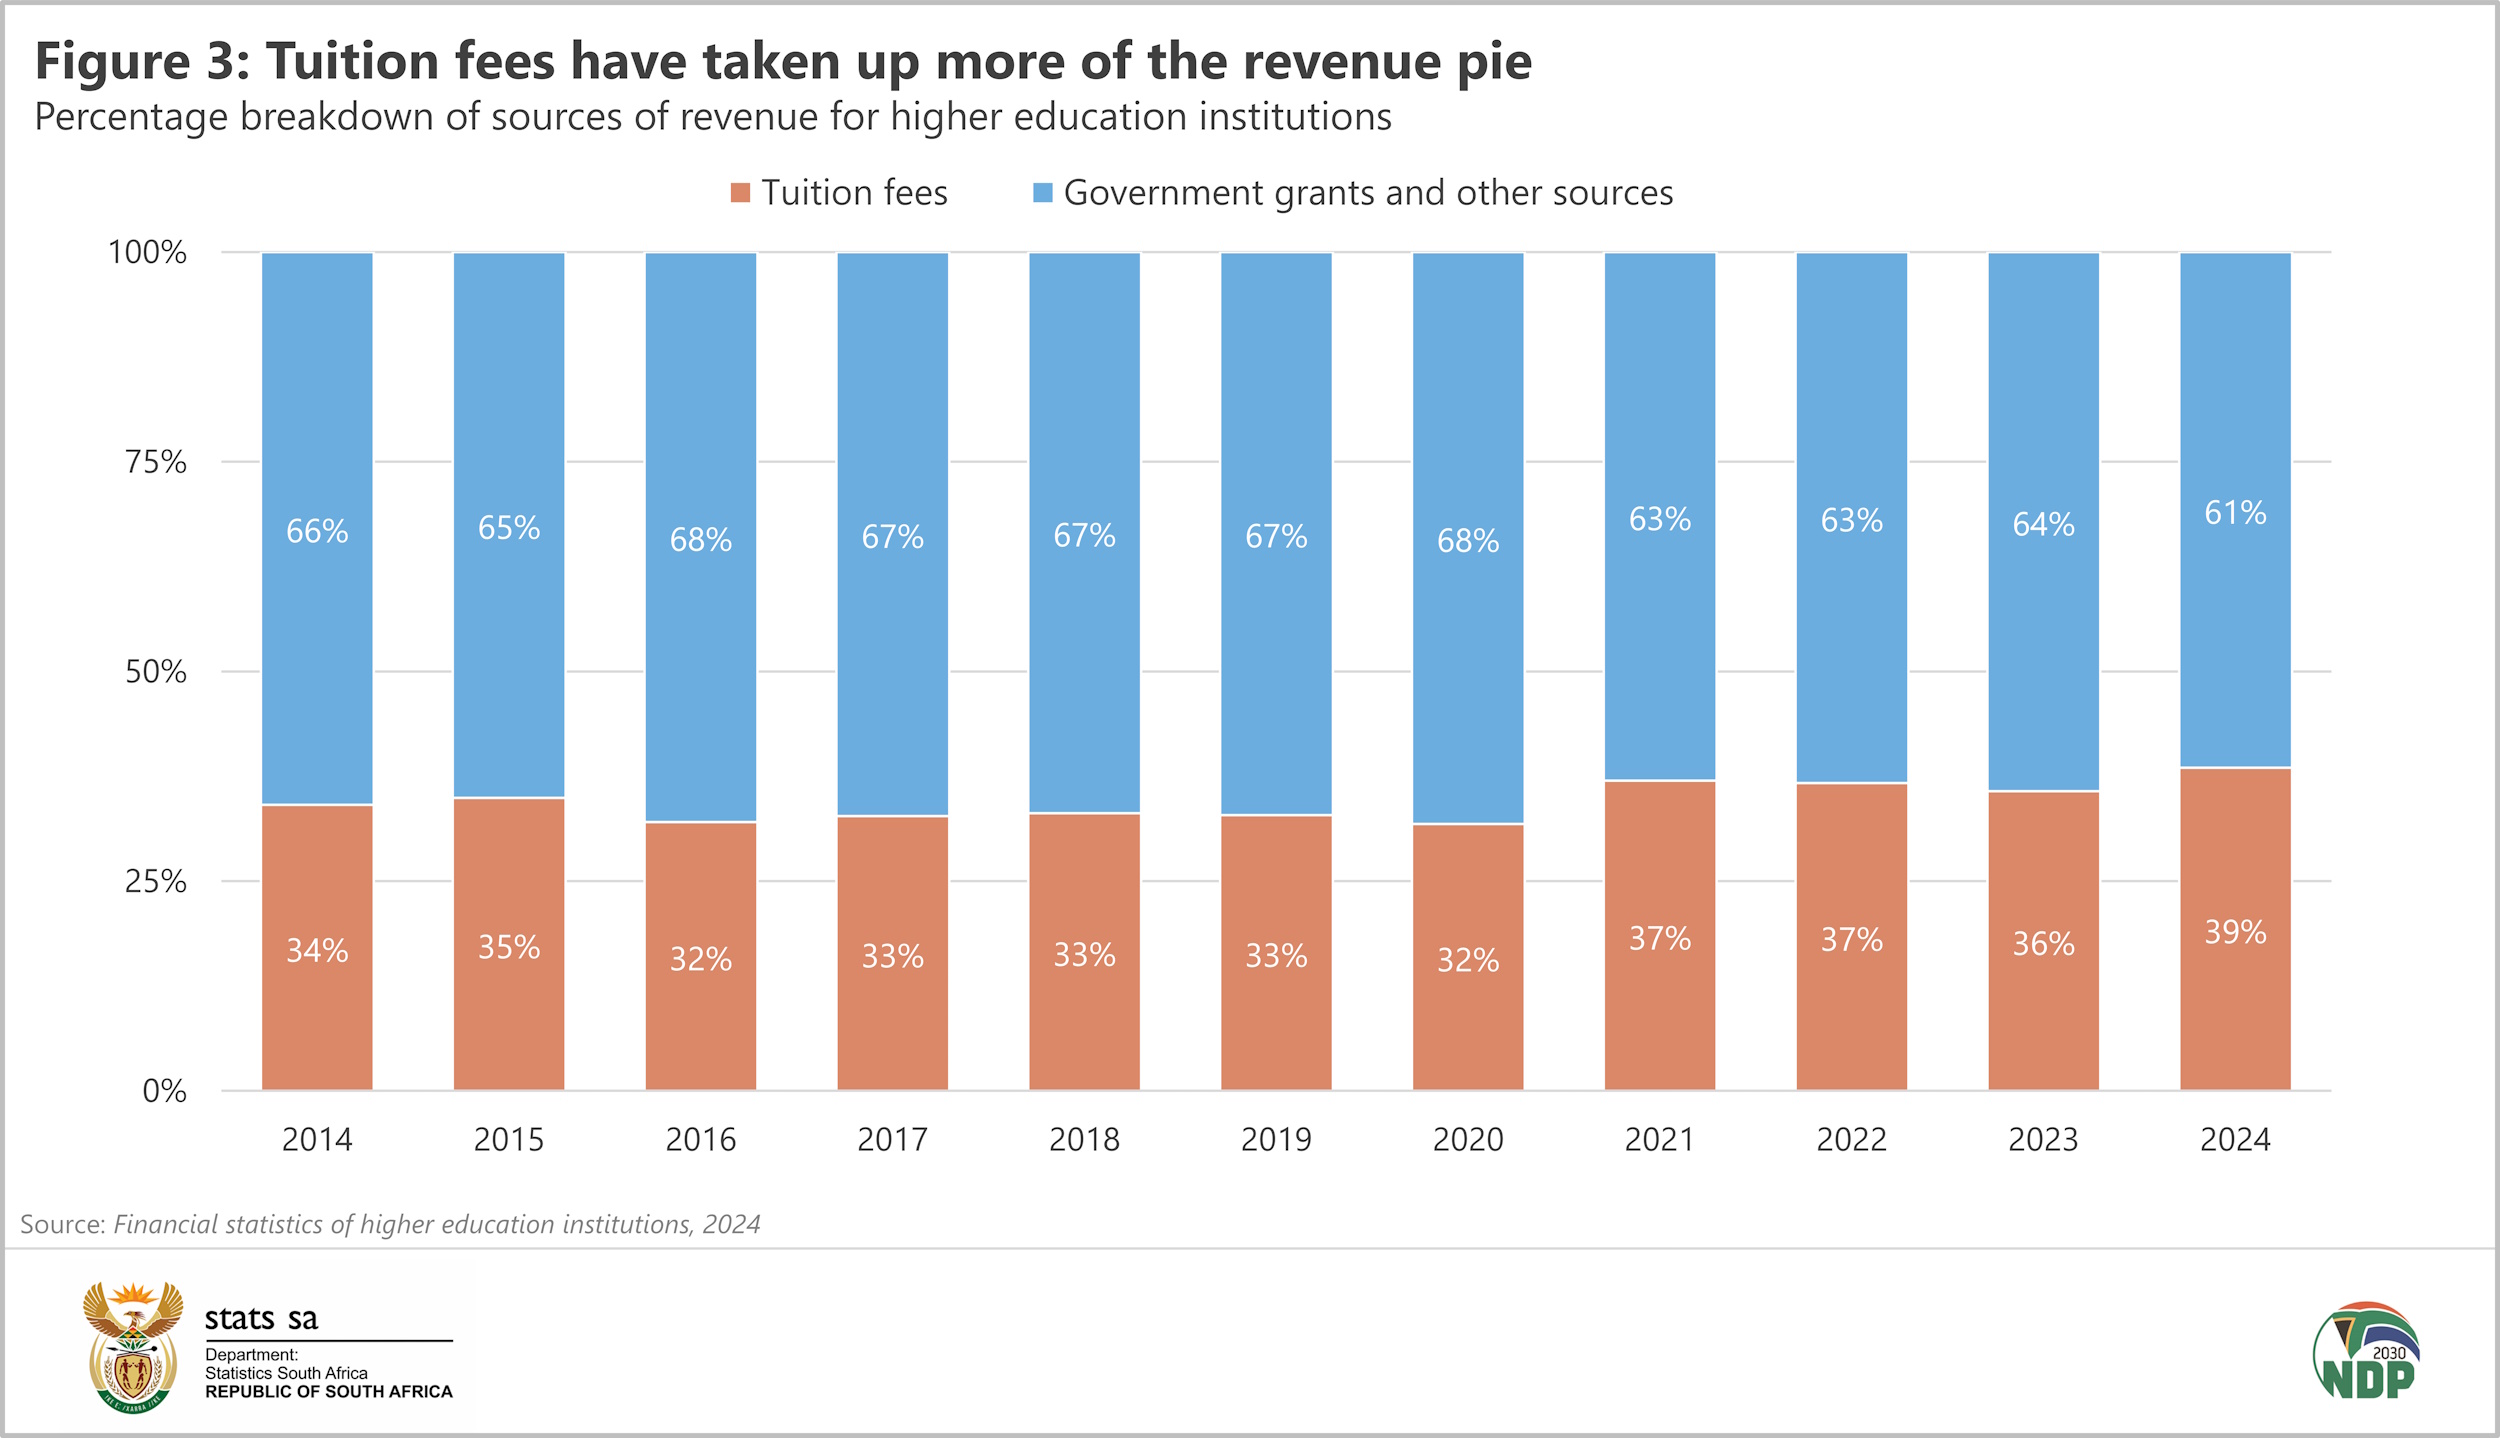
Note that the share of revenue derived from tuition fees includes both the fees paid directly by students as well as those funded through financial aid schemes.
Higher education institutions rely more on tuition fees
This slowdown in government funding was accompanied by a rise in the contribution of tuition fees to total revenue. Tuition fees accounted for 39% of revenue in 2024, its largest contribution in the last decade (Figure 3).
The data can be broken down further, showing how this contribution has shifted by institution since 2019, just before the COVID-19 pandemic (Figure 4). Walter Sisulu University relied most on tuition fees in 2024, with tuition fees accounting for 56% of total revenue. The University of Zululand recorded the lowest share (29%).
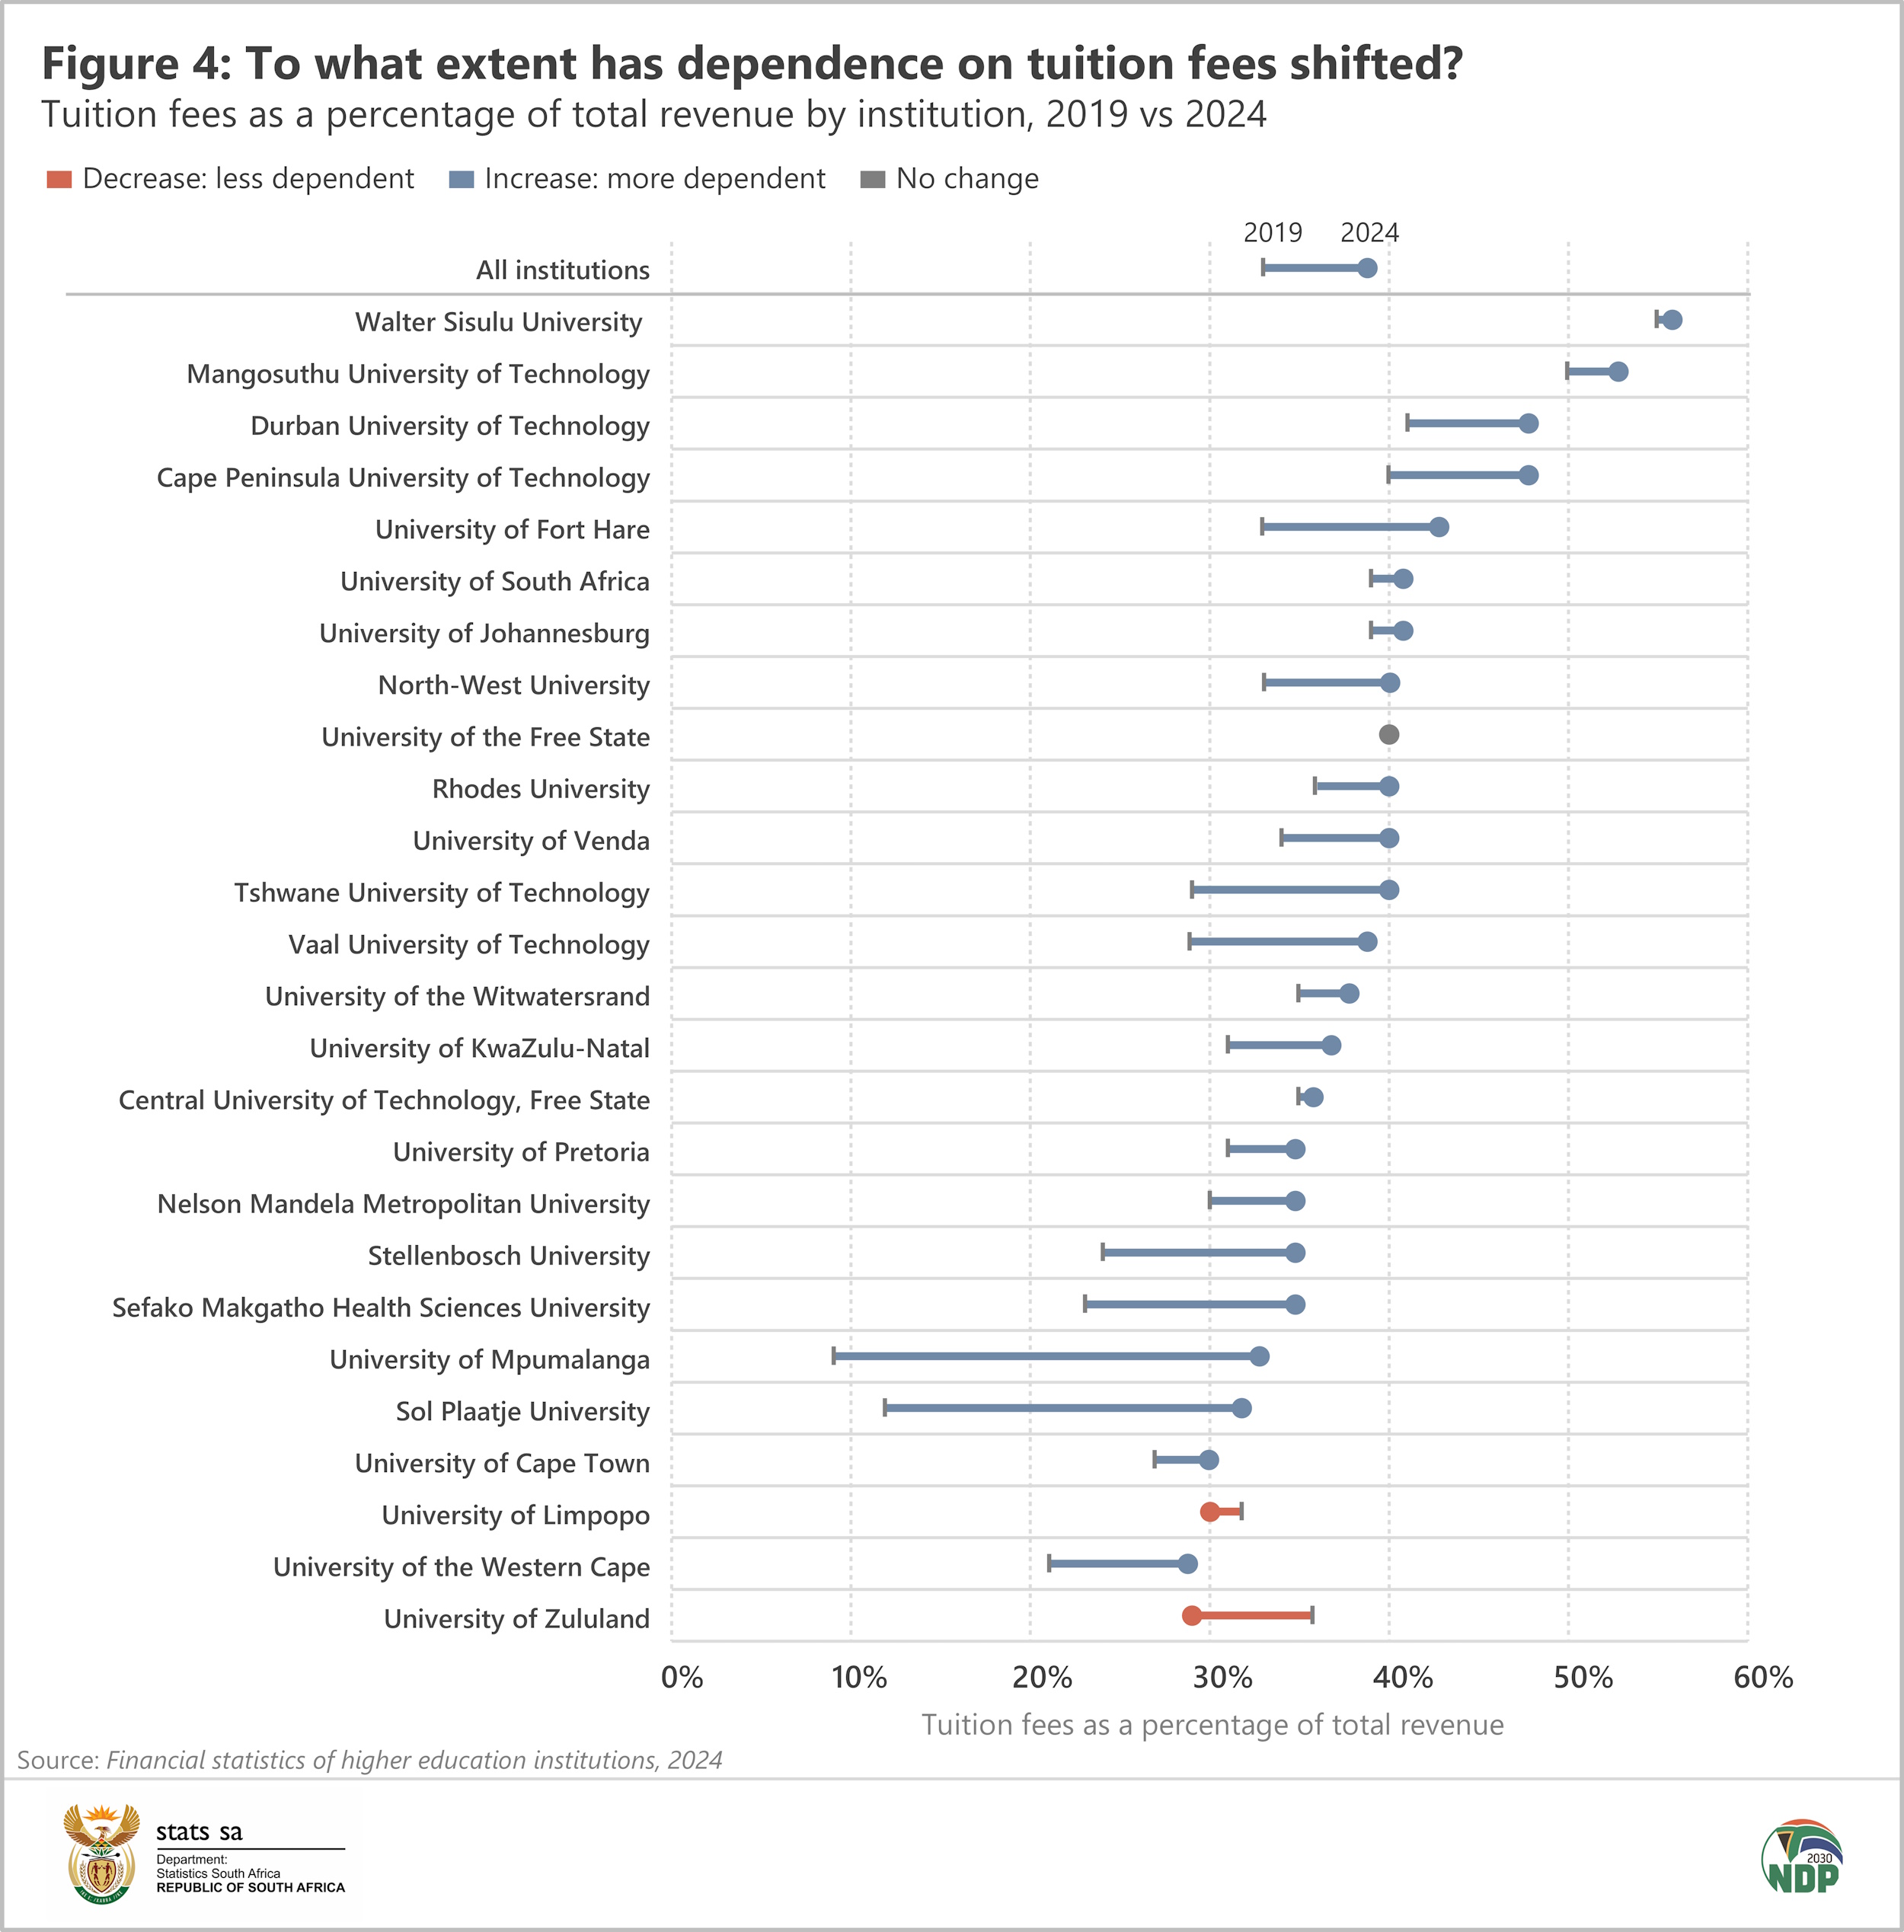
Of the 26 higher education institutions, 23 registered a rise in the contribution of tuition fees to total revenue in 2024 compared with 2019. The University of Free State recorded no change, while two universities (Limpopo and Zululand) recorded a decline.
The low contributions recorded by Sol Plaatje University and the University of Mpumalanga in 2019 are striking. Both institutions were established in 2014, starting with a small number of students. Tuition fees accounted for a small portion of revenue at the time, with the government providing the bulk of funding for both institutions.6 As the years passed, both recorded a steady rise in the share of tuition fees.
For more information, download the latest Financial statistics of higher education institutions statistical release here.
The recently published Household and Government Expenditure on Education, 2025 statistical release provides more data on how cost remains a barrier to education. Read more here.
1 Stats SA, Universities depend more on government for funding [28 October 2020] (read here).
2 Stats SA, University funding: Looking back at #FeesMustFall and COVID-19 [6 November 2024] (read here).
3 Stats SA, Consumer Price Index (CPI), Excel – CPI (COICOP) from January 2008 (202512) Excel file (available for download here).
4 Jarvis L, Why fee increases are necessary. Wits University [14 October 2015] (read here).
5 Department of Higher Education and Training. 2013. White Paper for Post‑School Education and Training: Building an expanded, effective and integrated post‑school system, pg 37 (download here).
6 Stats SA, A tale of two universities [6 November 2023] (read here)
Similar articles are available on the Stats SA website and can be accessed here.
For a monthly overview of economic indicators and infographics, catch the latest edition of the Stats Biz newsletter here.