
A tale of two universities
South Africa’s two newest universities had their origins back in 2010. That year, the South African Government announced its intention to establish two new institutions of higher learning. In late 2011, the Department of Higher Education and Training, together with the University of Witwatersrand, formed the New Universities Project Management Team. This team was responsible for ensuring the establishment of both institutions.1
Sol Plaatje University (SPU) and the University of Mpumalanga (UMP) opened their doors for the first time in 2014. Both exhibit unique revenue and spending patterns, according to data from Stats SA’s Financial statistics of higher education institutions statistical release.
Reliance on government
Higher education institutions receive revenue from two main sources: funding from government and tuition fees. SPU and UMP rely on government for most of their revenue.
This reliance, however, has declined over the years on the back of higher student numbers. Both universities began their first academic year in 2014 with a modest intake of students, with SPU recording a headcount of 124 and UMP 140.2 That year, tuition fees accounted for 3% of total revenue at SPU and 2% at UMP (Figure 1).
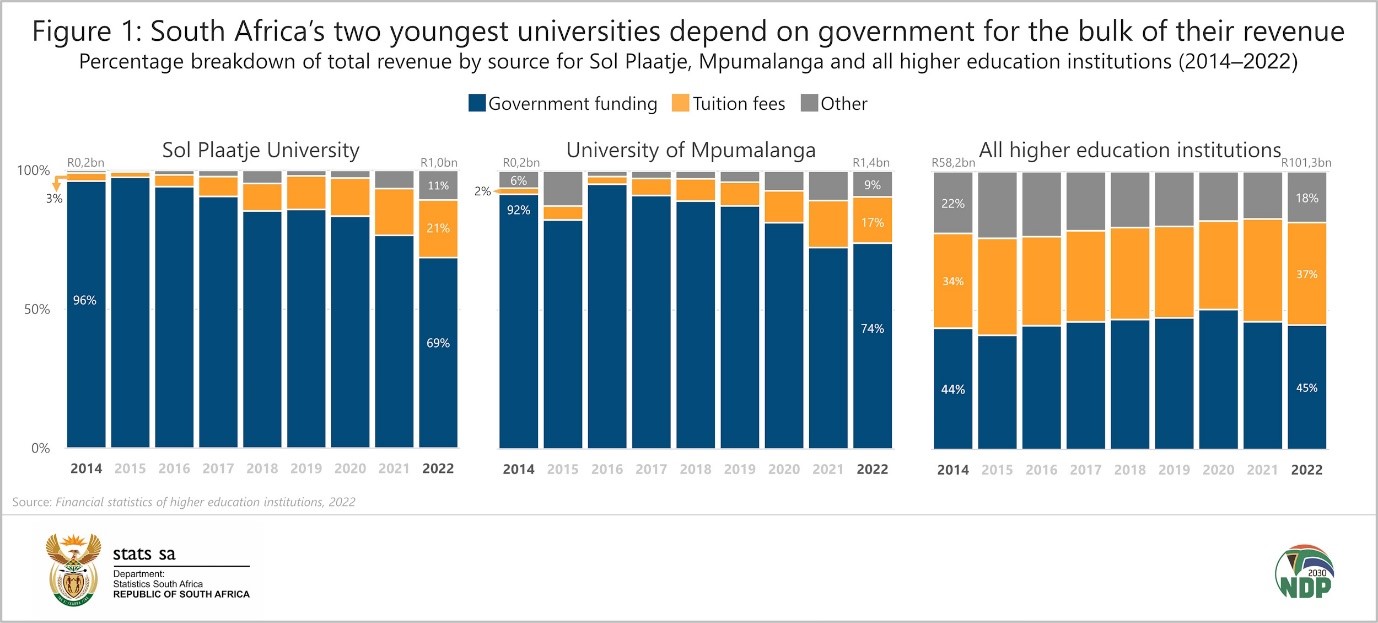
In 2022, tuition fees accounted for 21% of revenue at SPU and 17% at UMP. Enrolment numbers are not yet available for 2022, but 2021 data show that it increased at different rates over time, with SPU having 2 829 students compared with 5 435 students at UMP.3
Despite the growing influence of tuition fees, the two universities lag other higher education institutions. As a collective, South Africa’s 26 higher education institutions sourced 37% of revenue from tuition fees in 2022.
Brick and mortar
SUP and UMP also exhibit unique spending patterns. New institutions often require an initial burst of investment in capital expenditure, which includes the development of buildings and infrastructure. Both SPU and UMP spent the bulk of their budgets on capital expenditure in their early years (Figure 2).
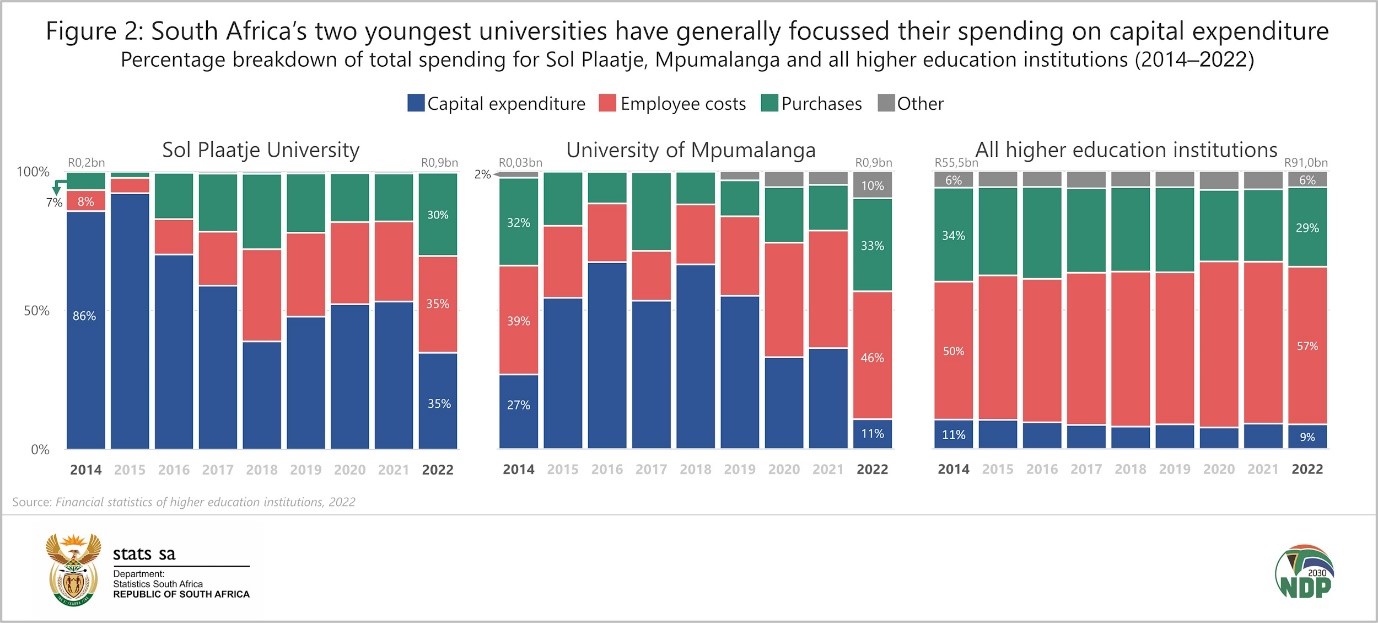
Capital expenditure accounted for 86% of spending at SPU in 2014, rising to 92% in 2015. Before new construction work had begun, other buildings in Kimberley were refurbished to cater for the first intake of SPU students. These included the Old Provincial Legislature and buildings at the William Pescod High School. Two other buildings acquired by SPU were upgraded for student accommodation.
Capital expenditure contributed 27% of total spending at UMP in 2014, rising to 54% in 2015 and 67% in 2016. To cater for the first two academic years (2014 and 2015), buildings belonging to the former Lowveld College of Agriculture and Ndebele College of Education (now incorporated into UMP) were refurbished.
Construction on new buildings began at both locations in October 2014, with 16 new buildings completed by early 2016. Infrastructure development during this time continued to rely on the New Universities Project Management Team and on the financial management and procurement process at the University of Witwatersrand.
In 2022, the contribution of capital expenditure was much lower for both universities. UMP recorded a contribution of 11% in 2022, more in line with the 9% average recorded by higher education institutions in general.
Figure 2 also shows other major expenditure items. The contribution of employee-related costs, which includes the payment of salaries and wages to staff, was higher in 2022 than in 2014 for both universities. In rand terms, both institutions recorded a consistent increase in employee-related costs as the number of staff increased. In 2014, SUP employed 29 permanent staff, rising to 609 in 2021. For UMP, the number climbed from 160 to 570 over the same period.2,3
For more information, download the latest Financial statistics of higher education institutions statistical release and Excel files here.
1 New Universities Project Management Team, Close out Report of the New Universities Project Management Team on the Development of New Universities in Mpumalanga and the Northern Cape (download here).
2 Department of Higher Education and Training, Statistics on Post-School Education and Training in South Africa: 2014 (download here).
3 Department of Higher Education and Training, Statistics on Post-School Education and Training in South Africa: 2021 (download here).
Similar articles are available on the Stats SA website and can be accessed here.
For a monthly overview of economic indicators and infographics, catch the latest edition of the Stats Biz newsletter here.