

The provision of free basic services to millions of households stems from the Free Basic Services (FBS) policy adopted in 2001. The policy outlined government’s intention to provide free services to the poorest (indigent) households.
Over time, the FBS has expanded to include policies for free basic water, electricity, sewerage & sanitation and solid waste (refuse) removal. A Free Basic Water (FBW) policy was established in 2001.1 In 2003, the Department of Mineral Resources & Energy launched a Free Basic Electricity (FBE) policy.2 The Department of Water and Sanitation followed up with a Free Basic Sanitation Implementation Strategy in 2008. In 2009, a National Policy on Free Basic Refuse Removal was developed.
Municipalities are responsible for providing free basic services. The Municipal Indigent Policy Framework provides guidelines for the municipal development of indigent policies, specifically related to free basic services.3
Each municipality has its own criteria for deciding which households qualify for indigent status. This determination is largely based on the resources available. Municipalities can also decide on the extent to which they subsidise an indigent household. The general rule is that indigent households are entitled to 6 kl of free water and 50 kWh of free electricity per household per month. The extent to which sanitation and refuse removal services are subsidised varies from municipality to municipality.
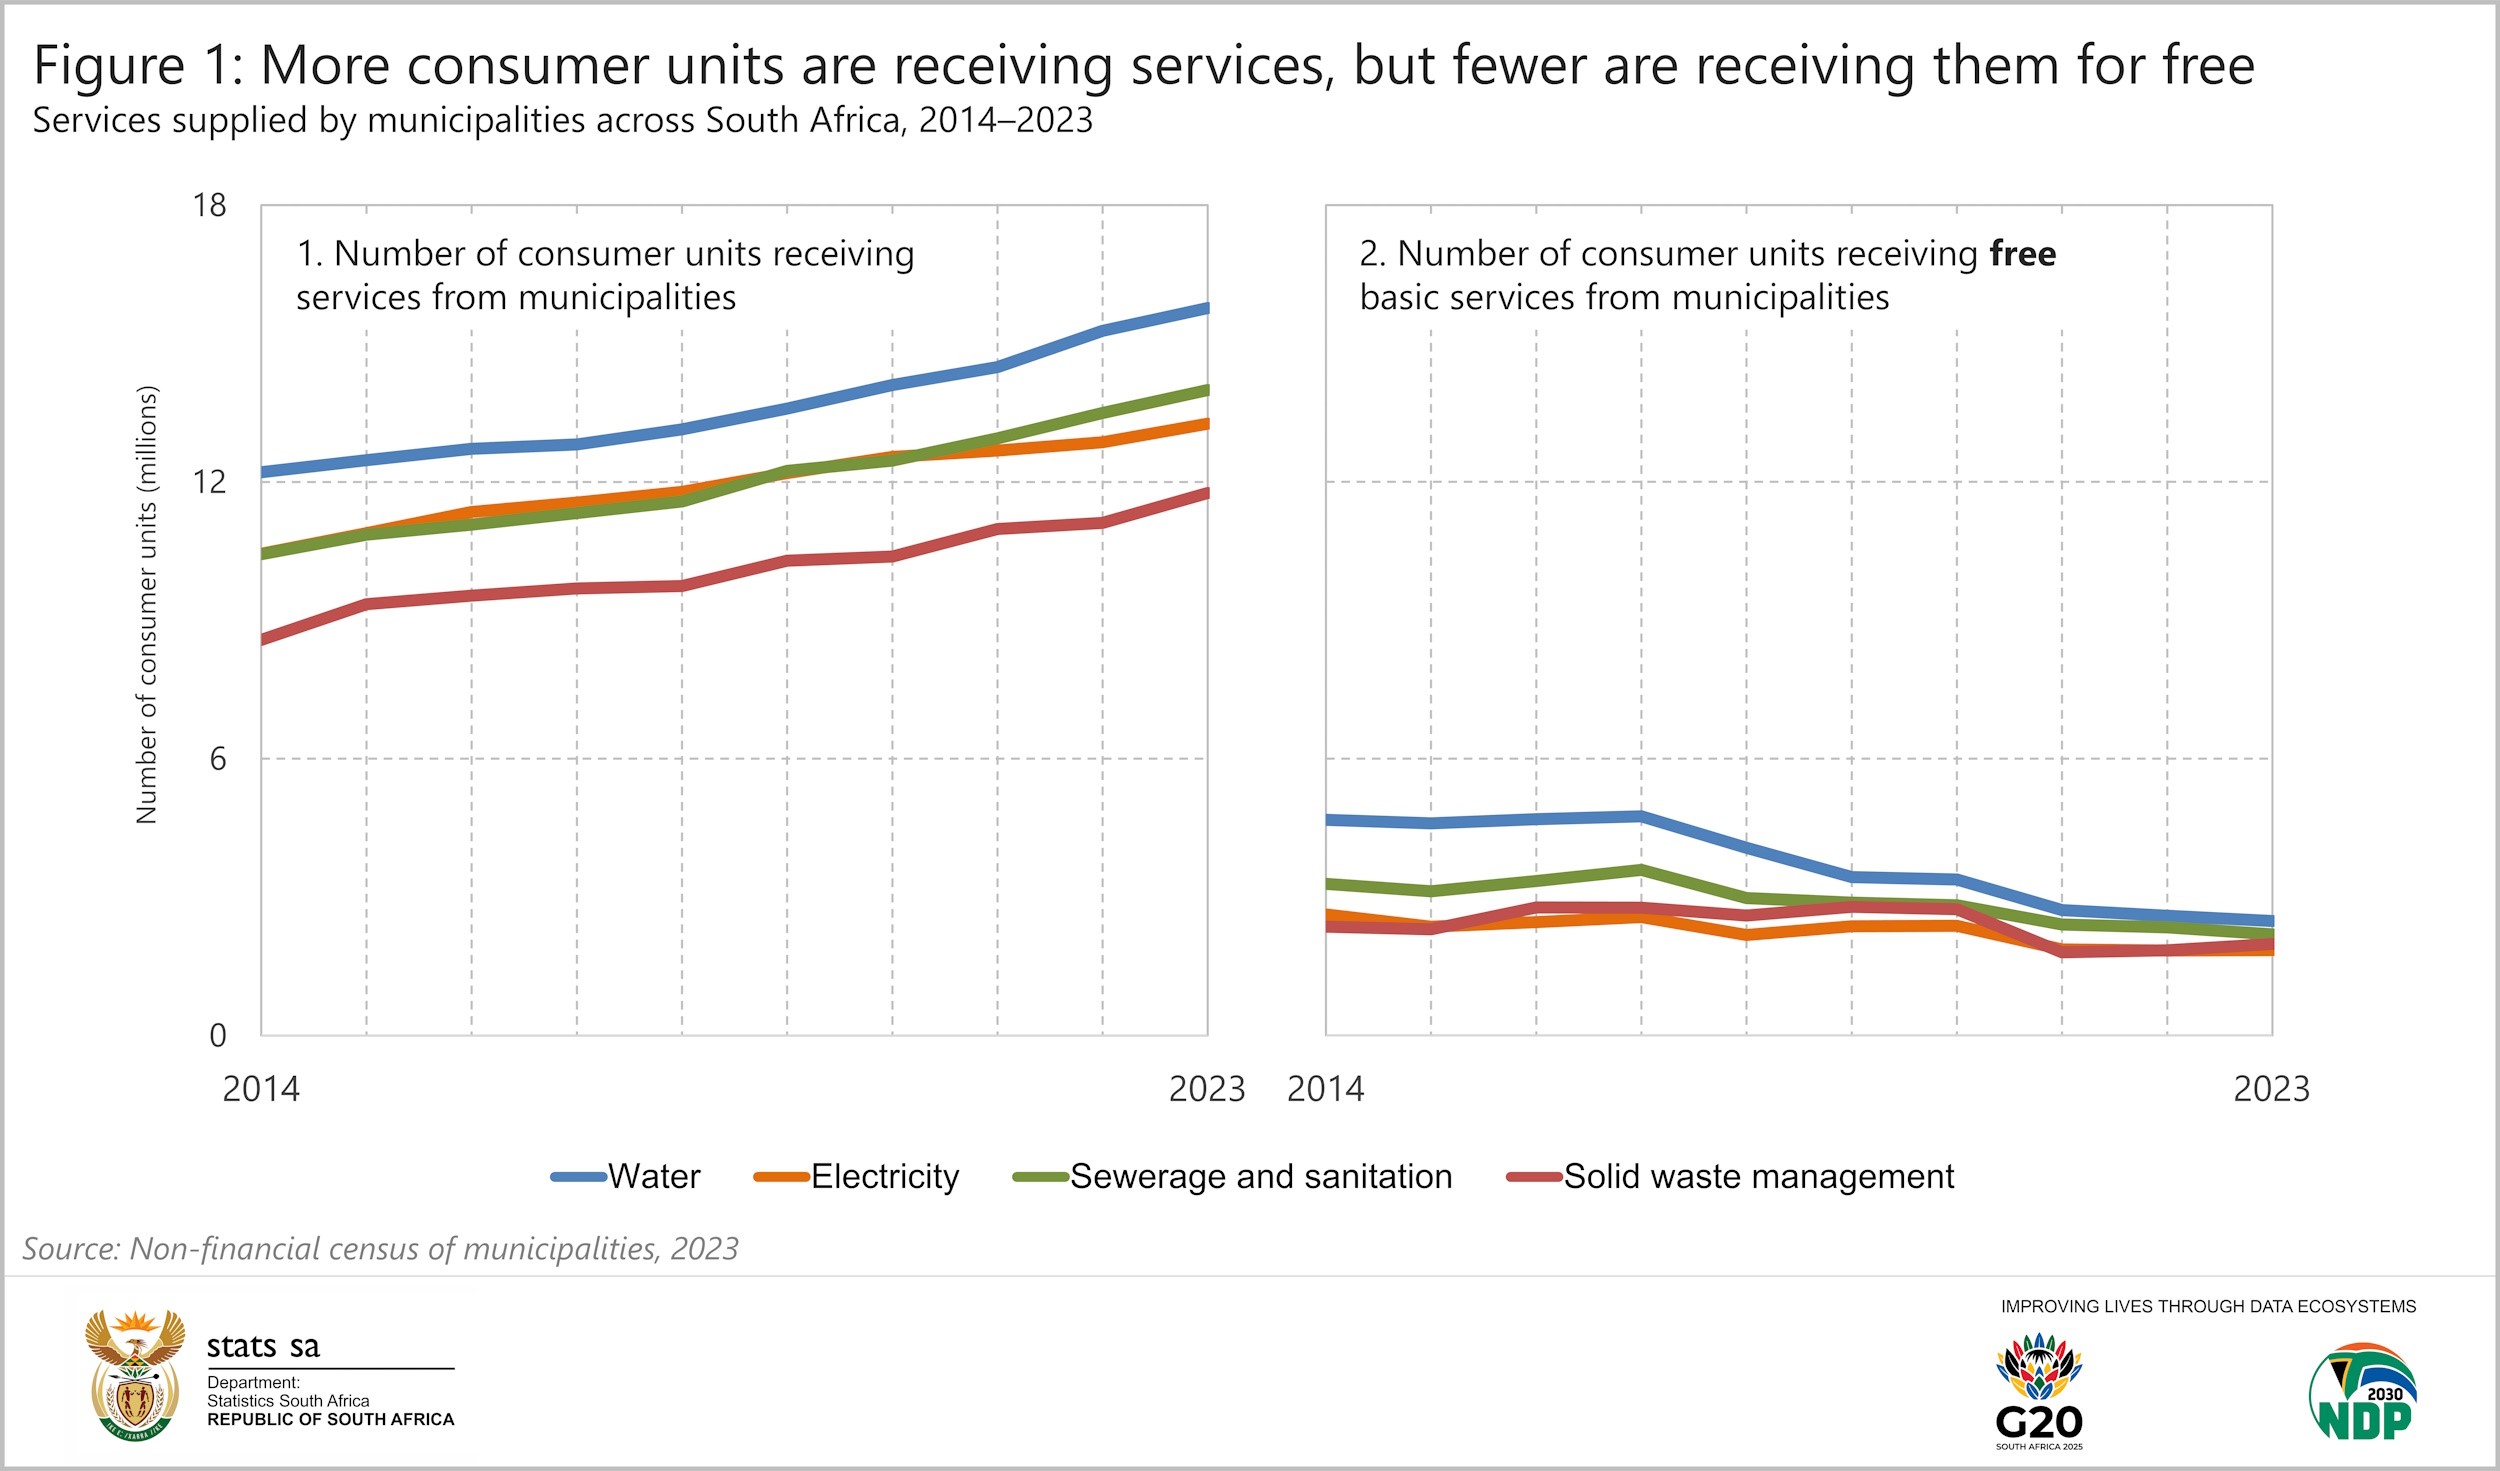
Free service coverage dropped in 2023, except for solid waste
Stats SA publishes data on free basic services in its Non-financial census of municipalities statistical report. Municipalities provided water to 15,3 million consumer units4 in 2022, with 17% receiving the service at no charge (or at a subsidised rate). The number increased to 15,8 million consumer units in 2023. However, the percentage benefiting from free basic water softened to 16%.
The same held true for electricity and sewerage & sanitation. The exception was solid waste removal. The number of consumer units receiving solid waste services expanded from 11,1 million to 11,8 million while the proportion receiving the service for free also increased, albeit marginally from 16,6% to 16,8%.
Changes over the last decade
The decline in 2023 continues a downward trend. From 2014 to 2023, there was an increase in the number of consumer units receiving services in general (paid or free). However, there was a decrease in the number benefiting from free services over this period.
The widening gap has dragged the coverage rate lower. Nationally, the percentage of consumer units benefiting from free basic water declined from 38% in 2014 to 16% in 2023. All provinces registered declines in this period (Figure 2). Eastern Cape recorded a sharp decline from 49% in 2018 to 18% in 2023. As a group, municipalities in Western Cape recorded the highest percentage in 2023, while municipalities in Mpumalanga registered the lowest.
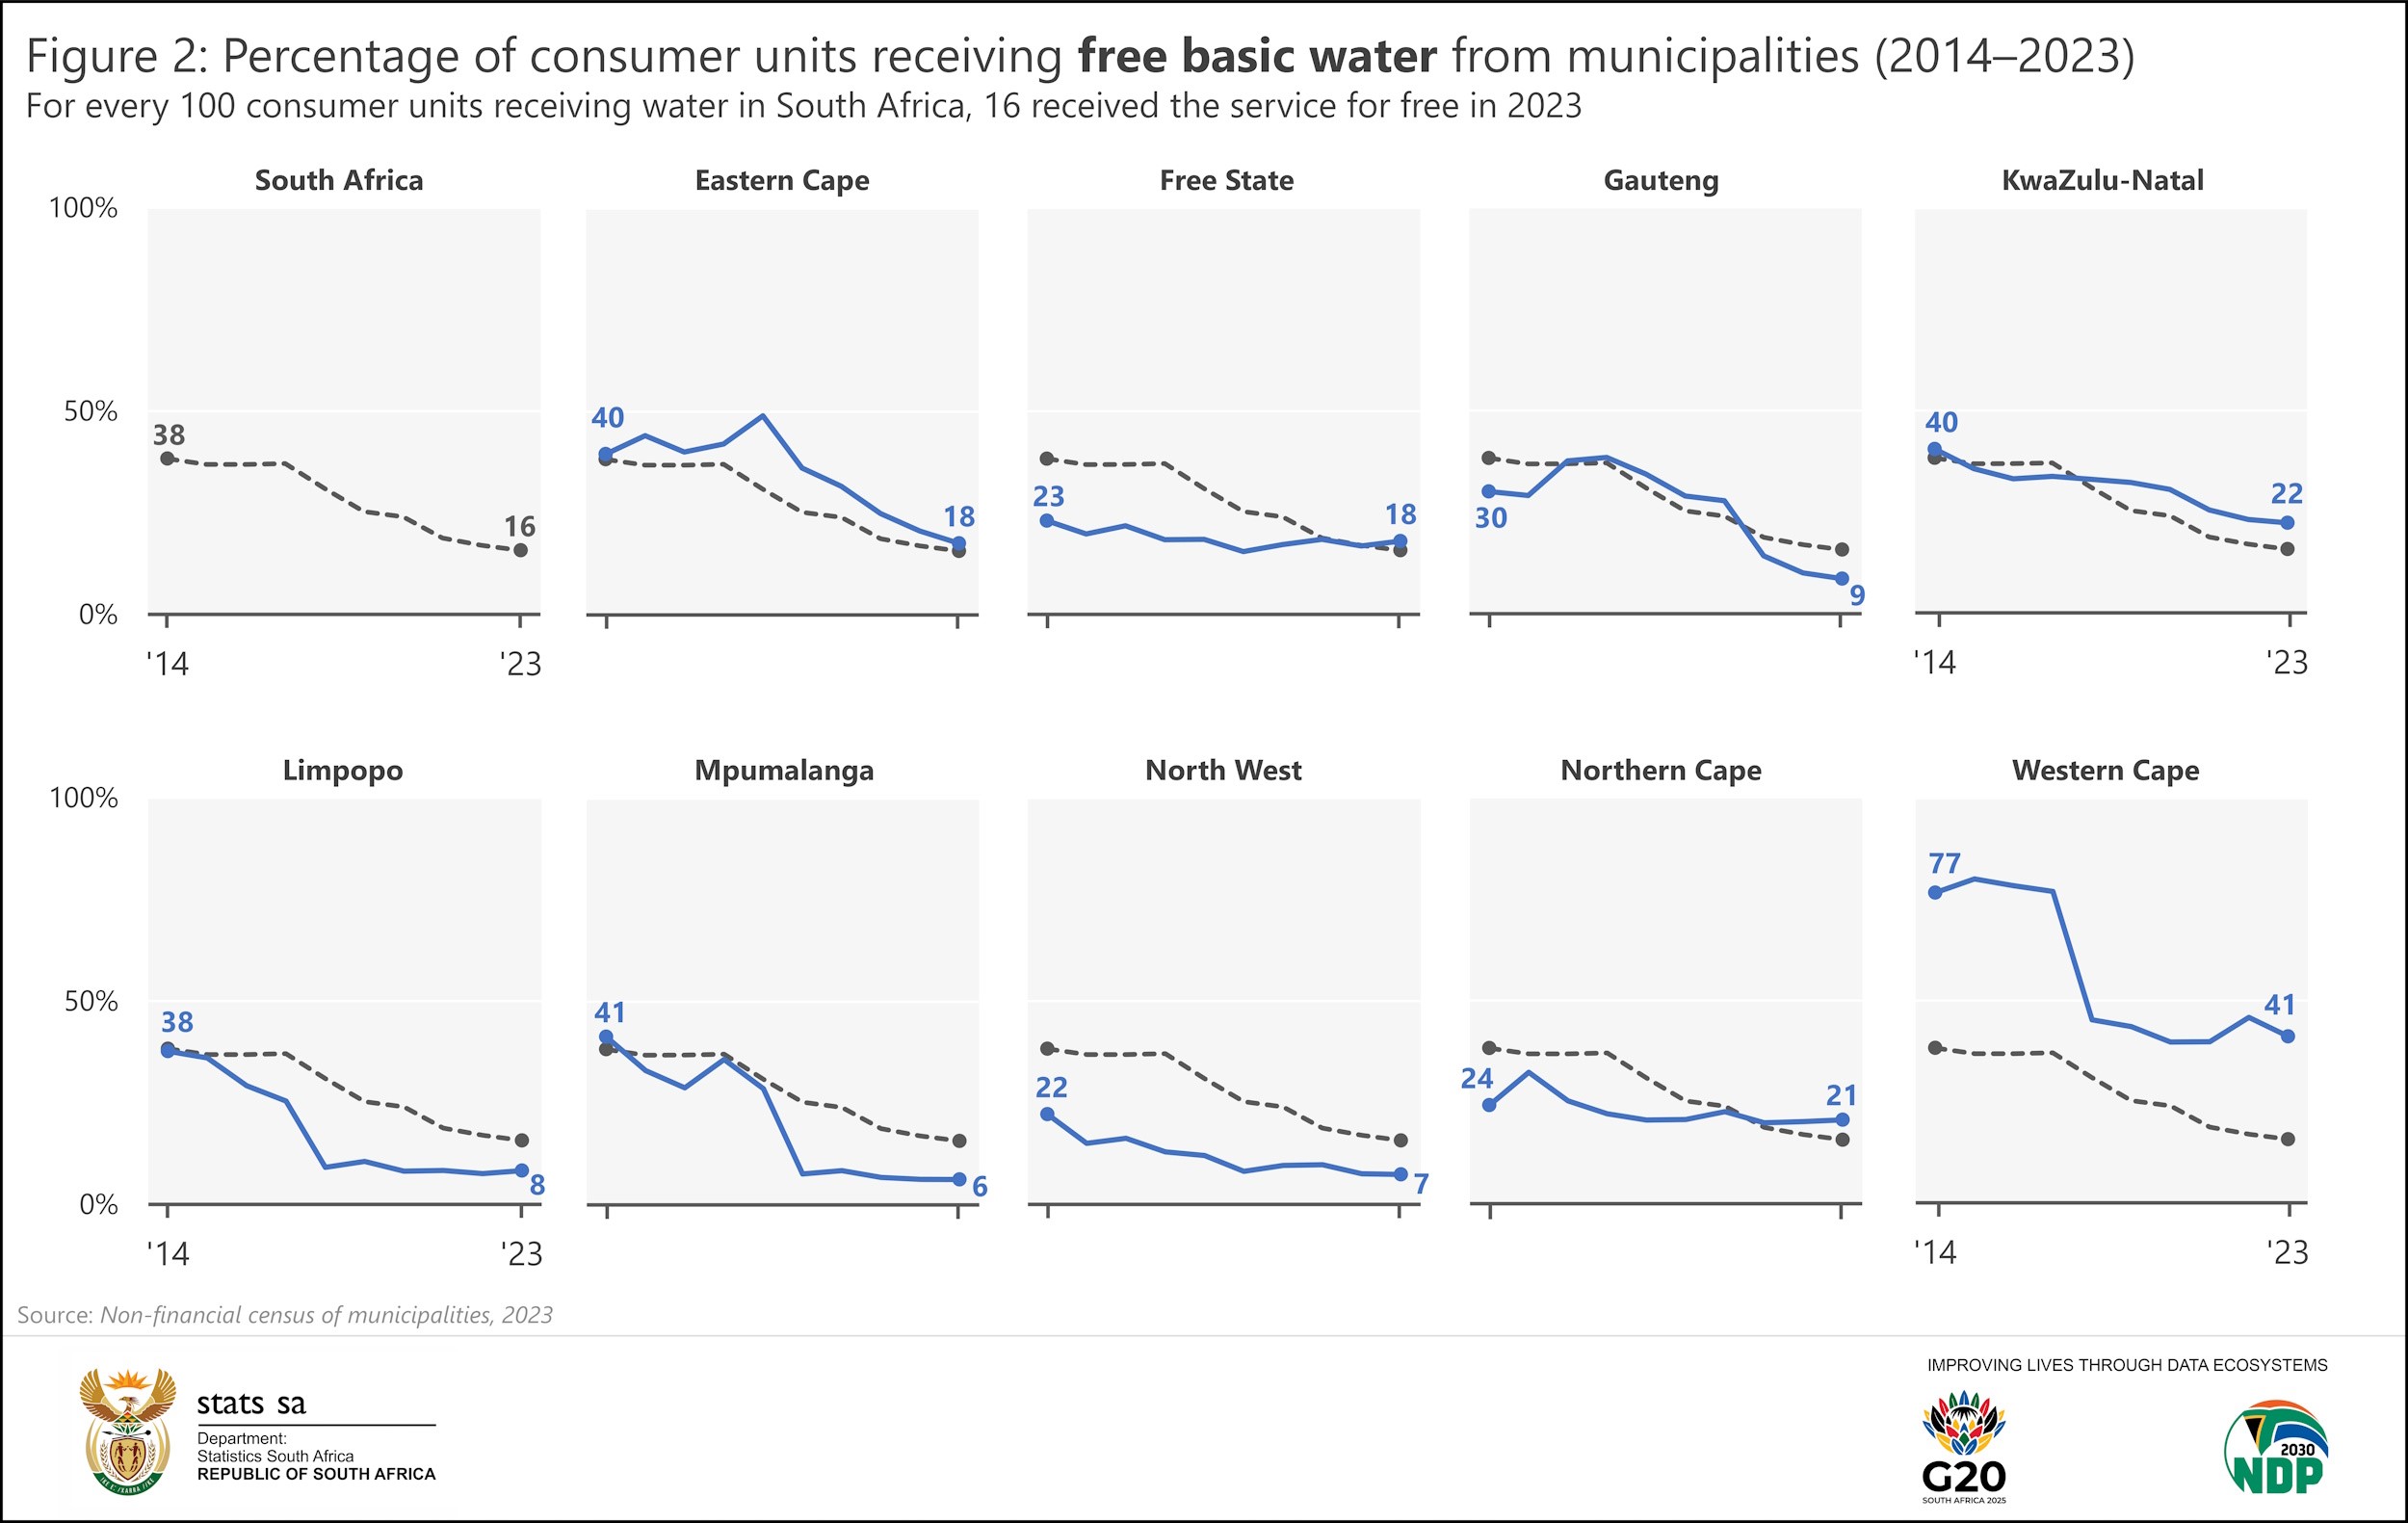
Exploring the data at a more granular level, the local municipalities with the highest percentages in 2023 were Hantam (93%) and Khâi-Ma (66%) in Northern Cape.
KwaZulu-Natal was the only province to record a rise in the coverage of free basic electricity, from 14% in 2014 to 16% in 2023 (Figure 3). Eastern Cape and Western Cape remained at or above the national average. In contrast, Limpopo, Mpumalanga and North West lagged.
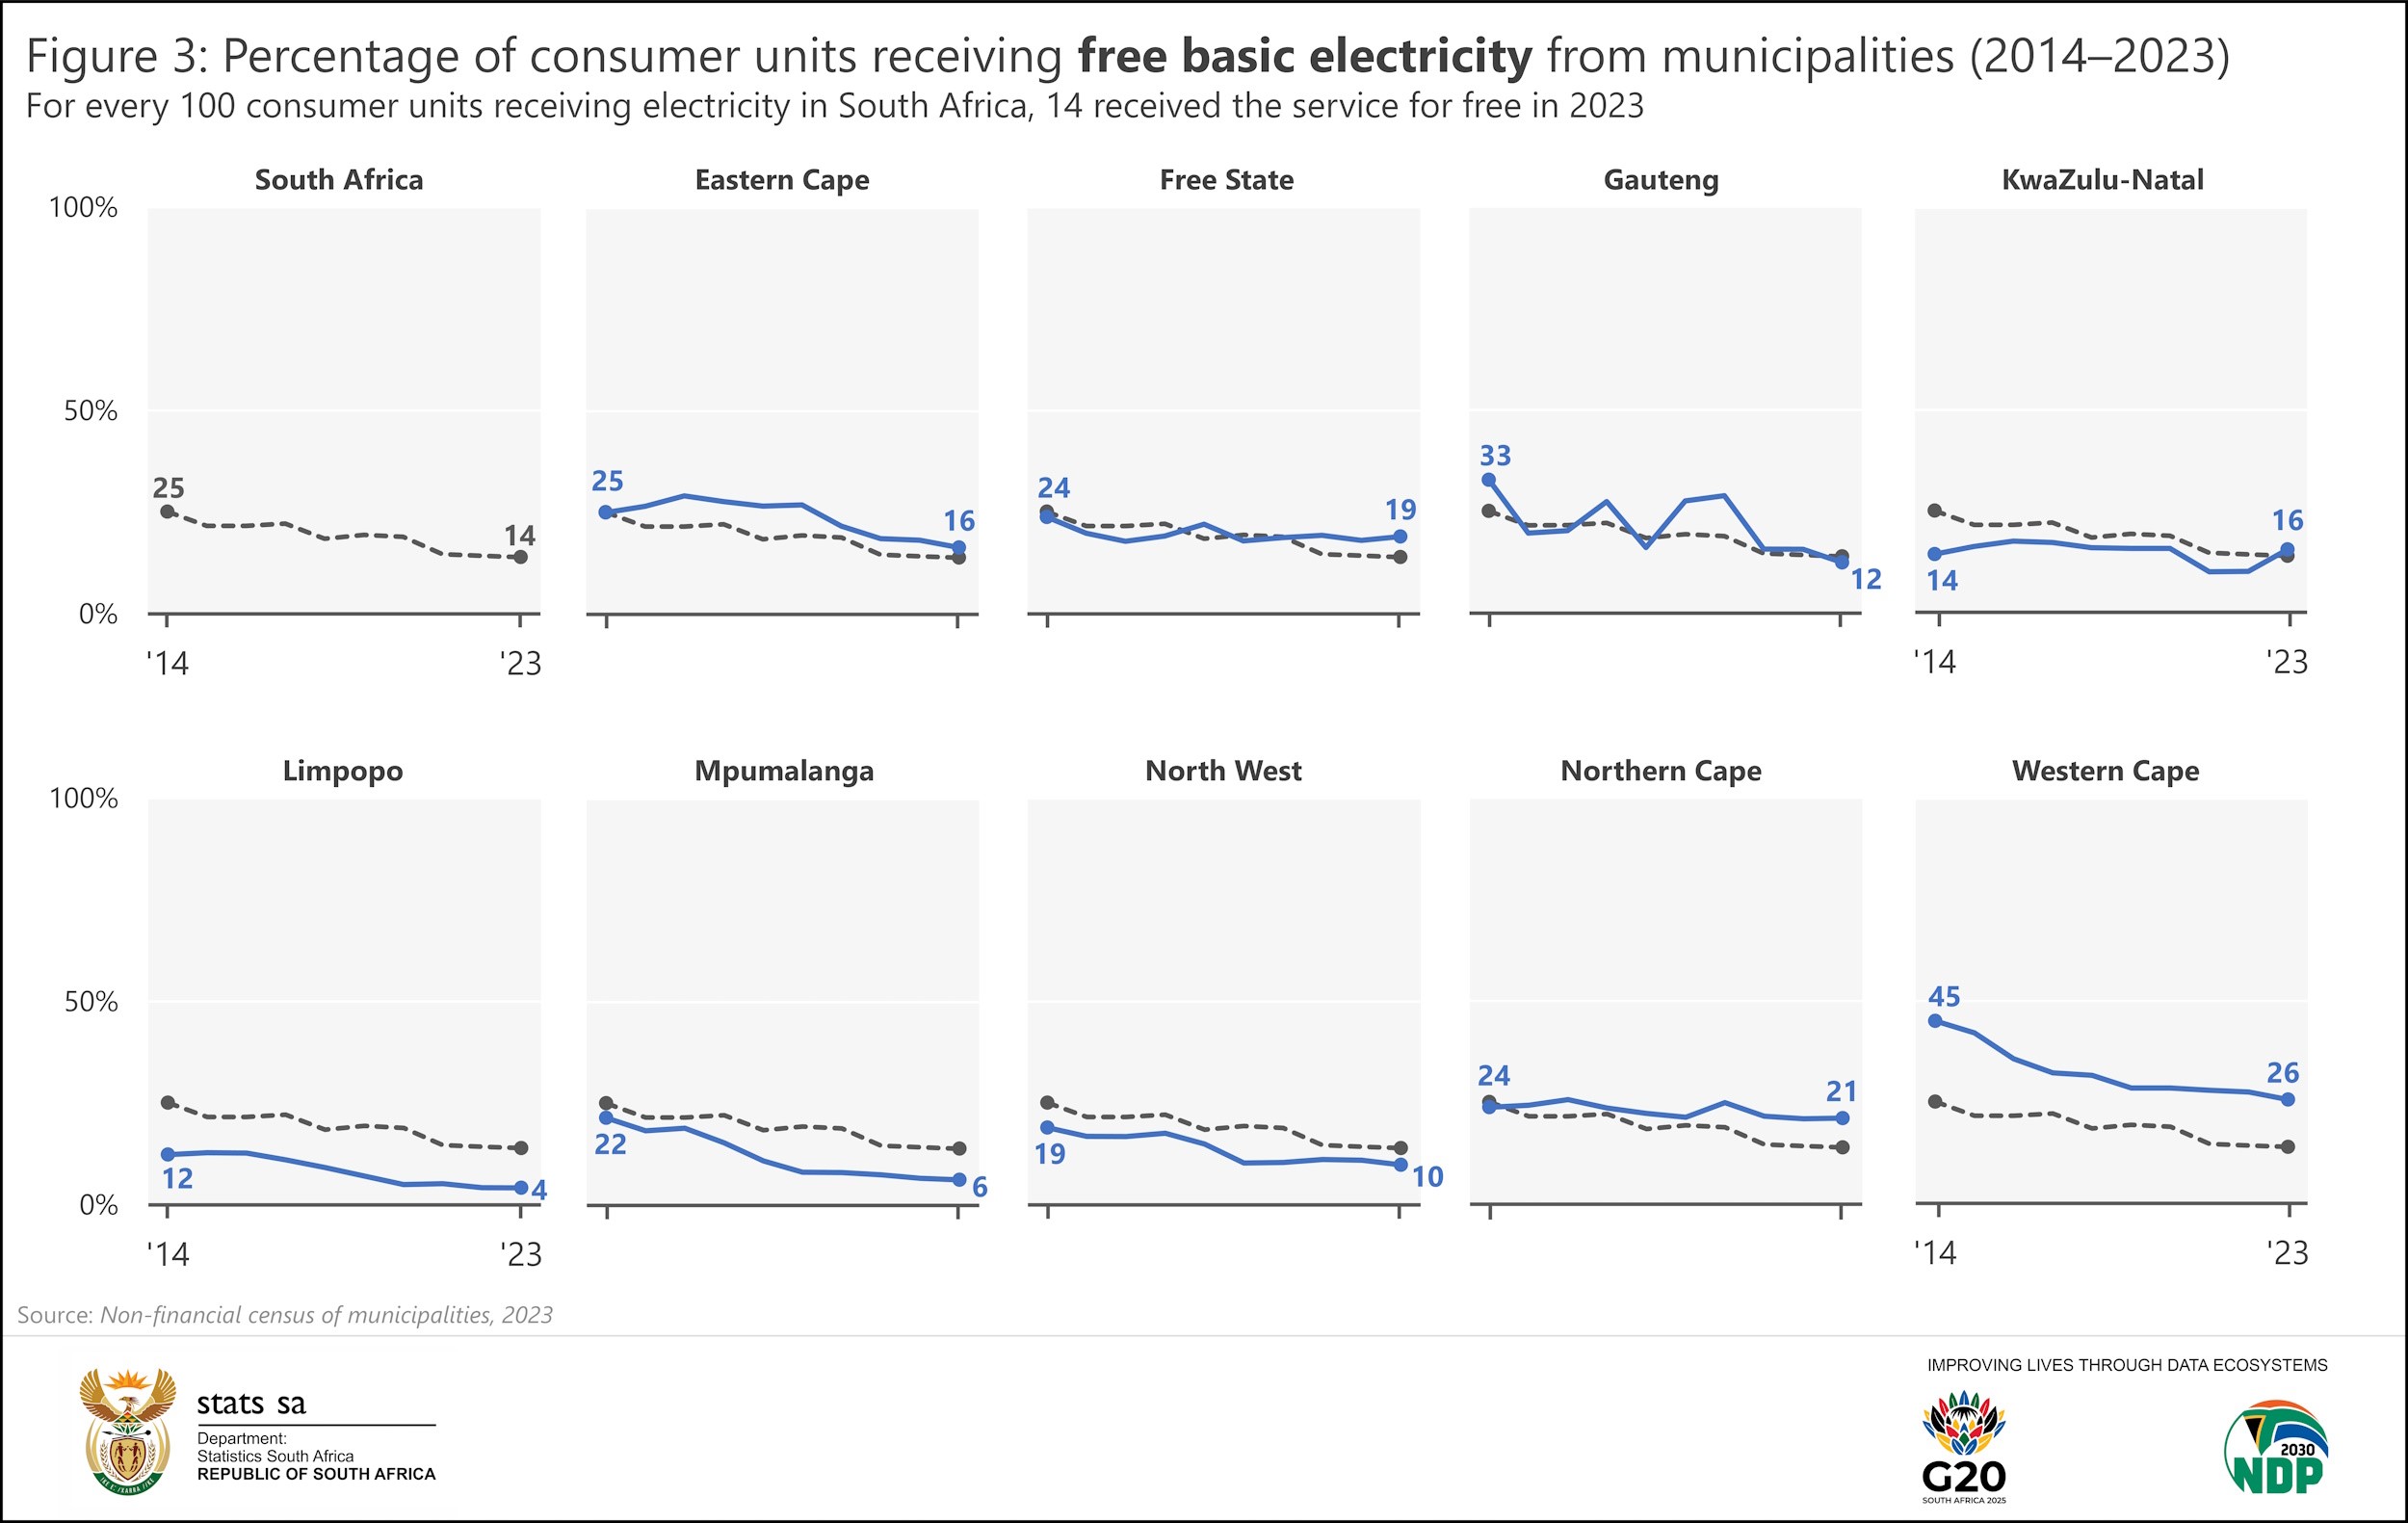
The two local municipalities that reported the highest percentages in 2023 include uMuziwabantu in KwaZulu-Natal (70%) and Siyancuma in Northern Cape (64%).
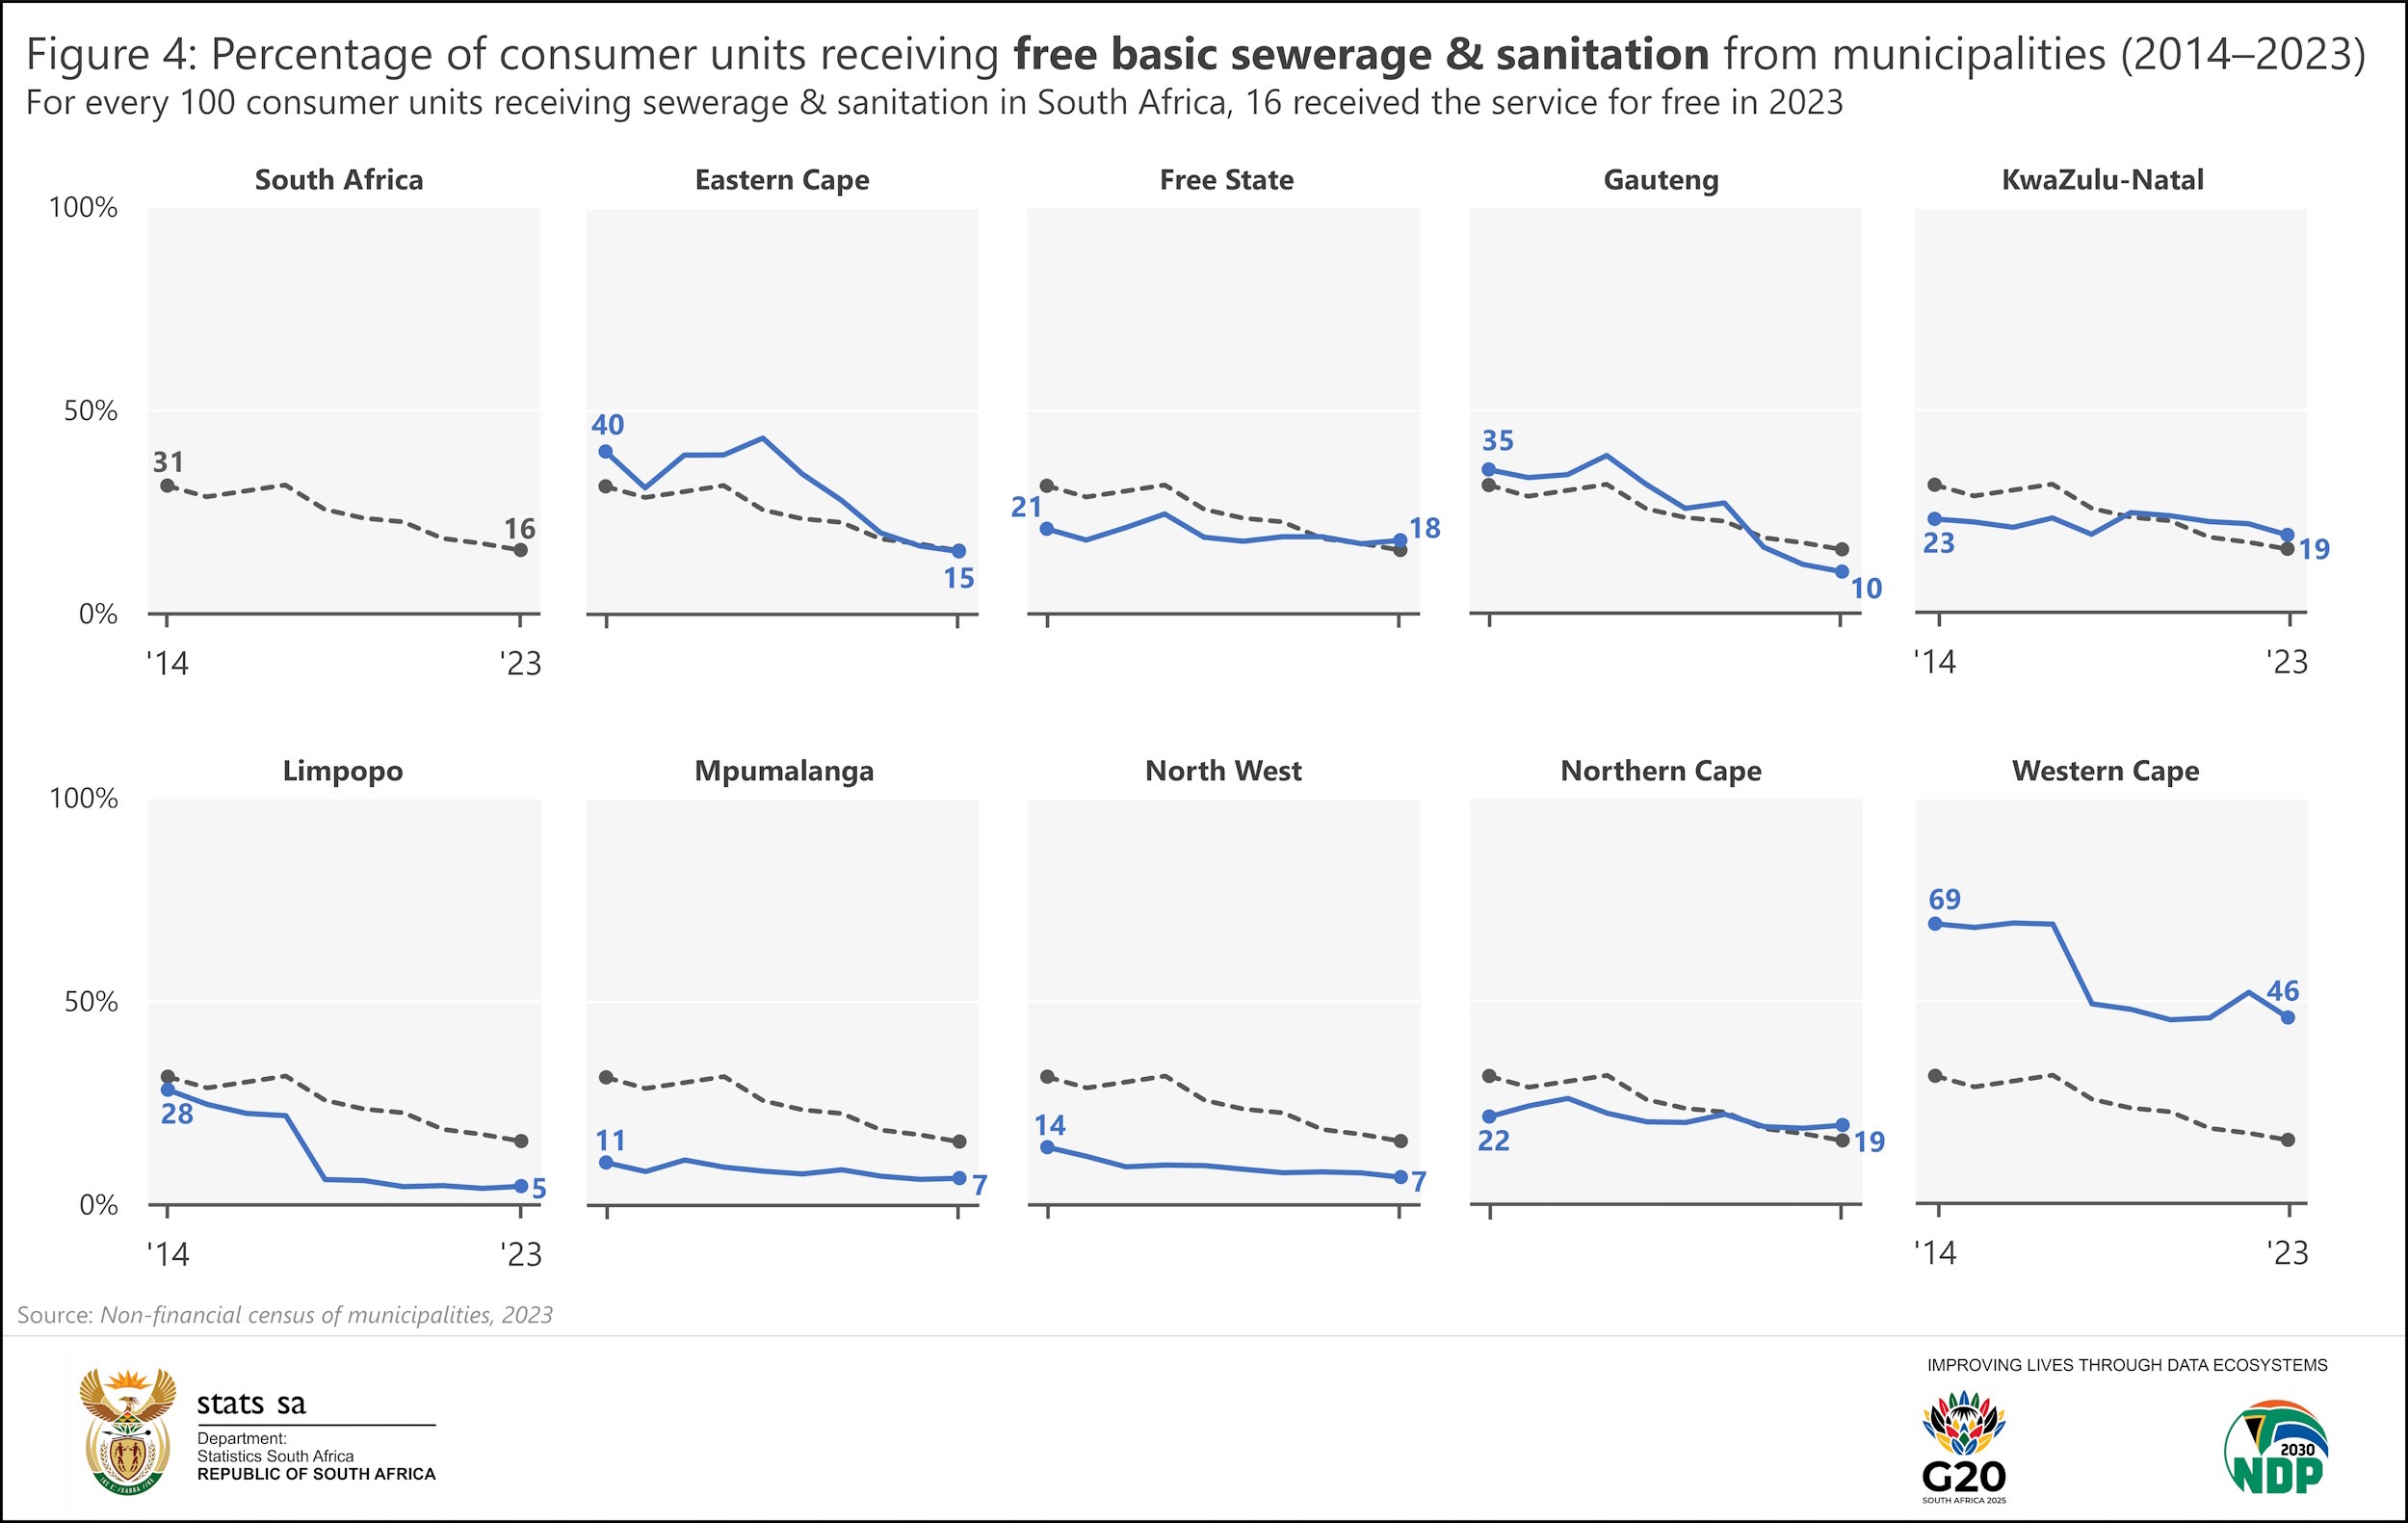
Mirroring free basic water, the proportion of consumer units benefiting from free basic sewerage & sanitation declined across all provinces, with the national figure falling from 31% to 16% (Figure 4). Municipalities that recorded the highest rates in 2023 include the Hantam Local Municipality in Northern Cape (93%) and the City of Cape Town Metropolitan Municipality in Western Cape (67%).
The coverage of free basic solid waste services declined across seven of the nine provinces in the 2014–2023 period. Free State and Northern Cape recorded increases (Figure 5). Gauteng registered a notable decline from 25% in 2018 to 8% in 2023. Western Cape registered the highest percentage in 2023.
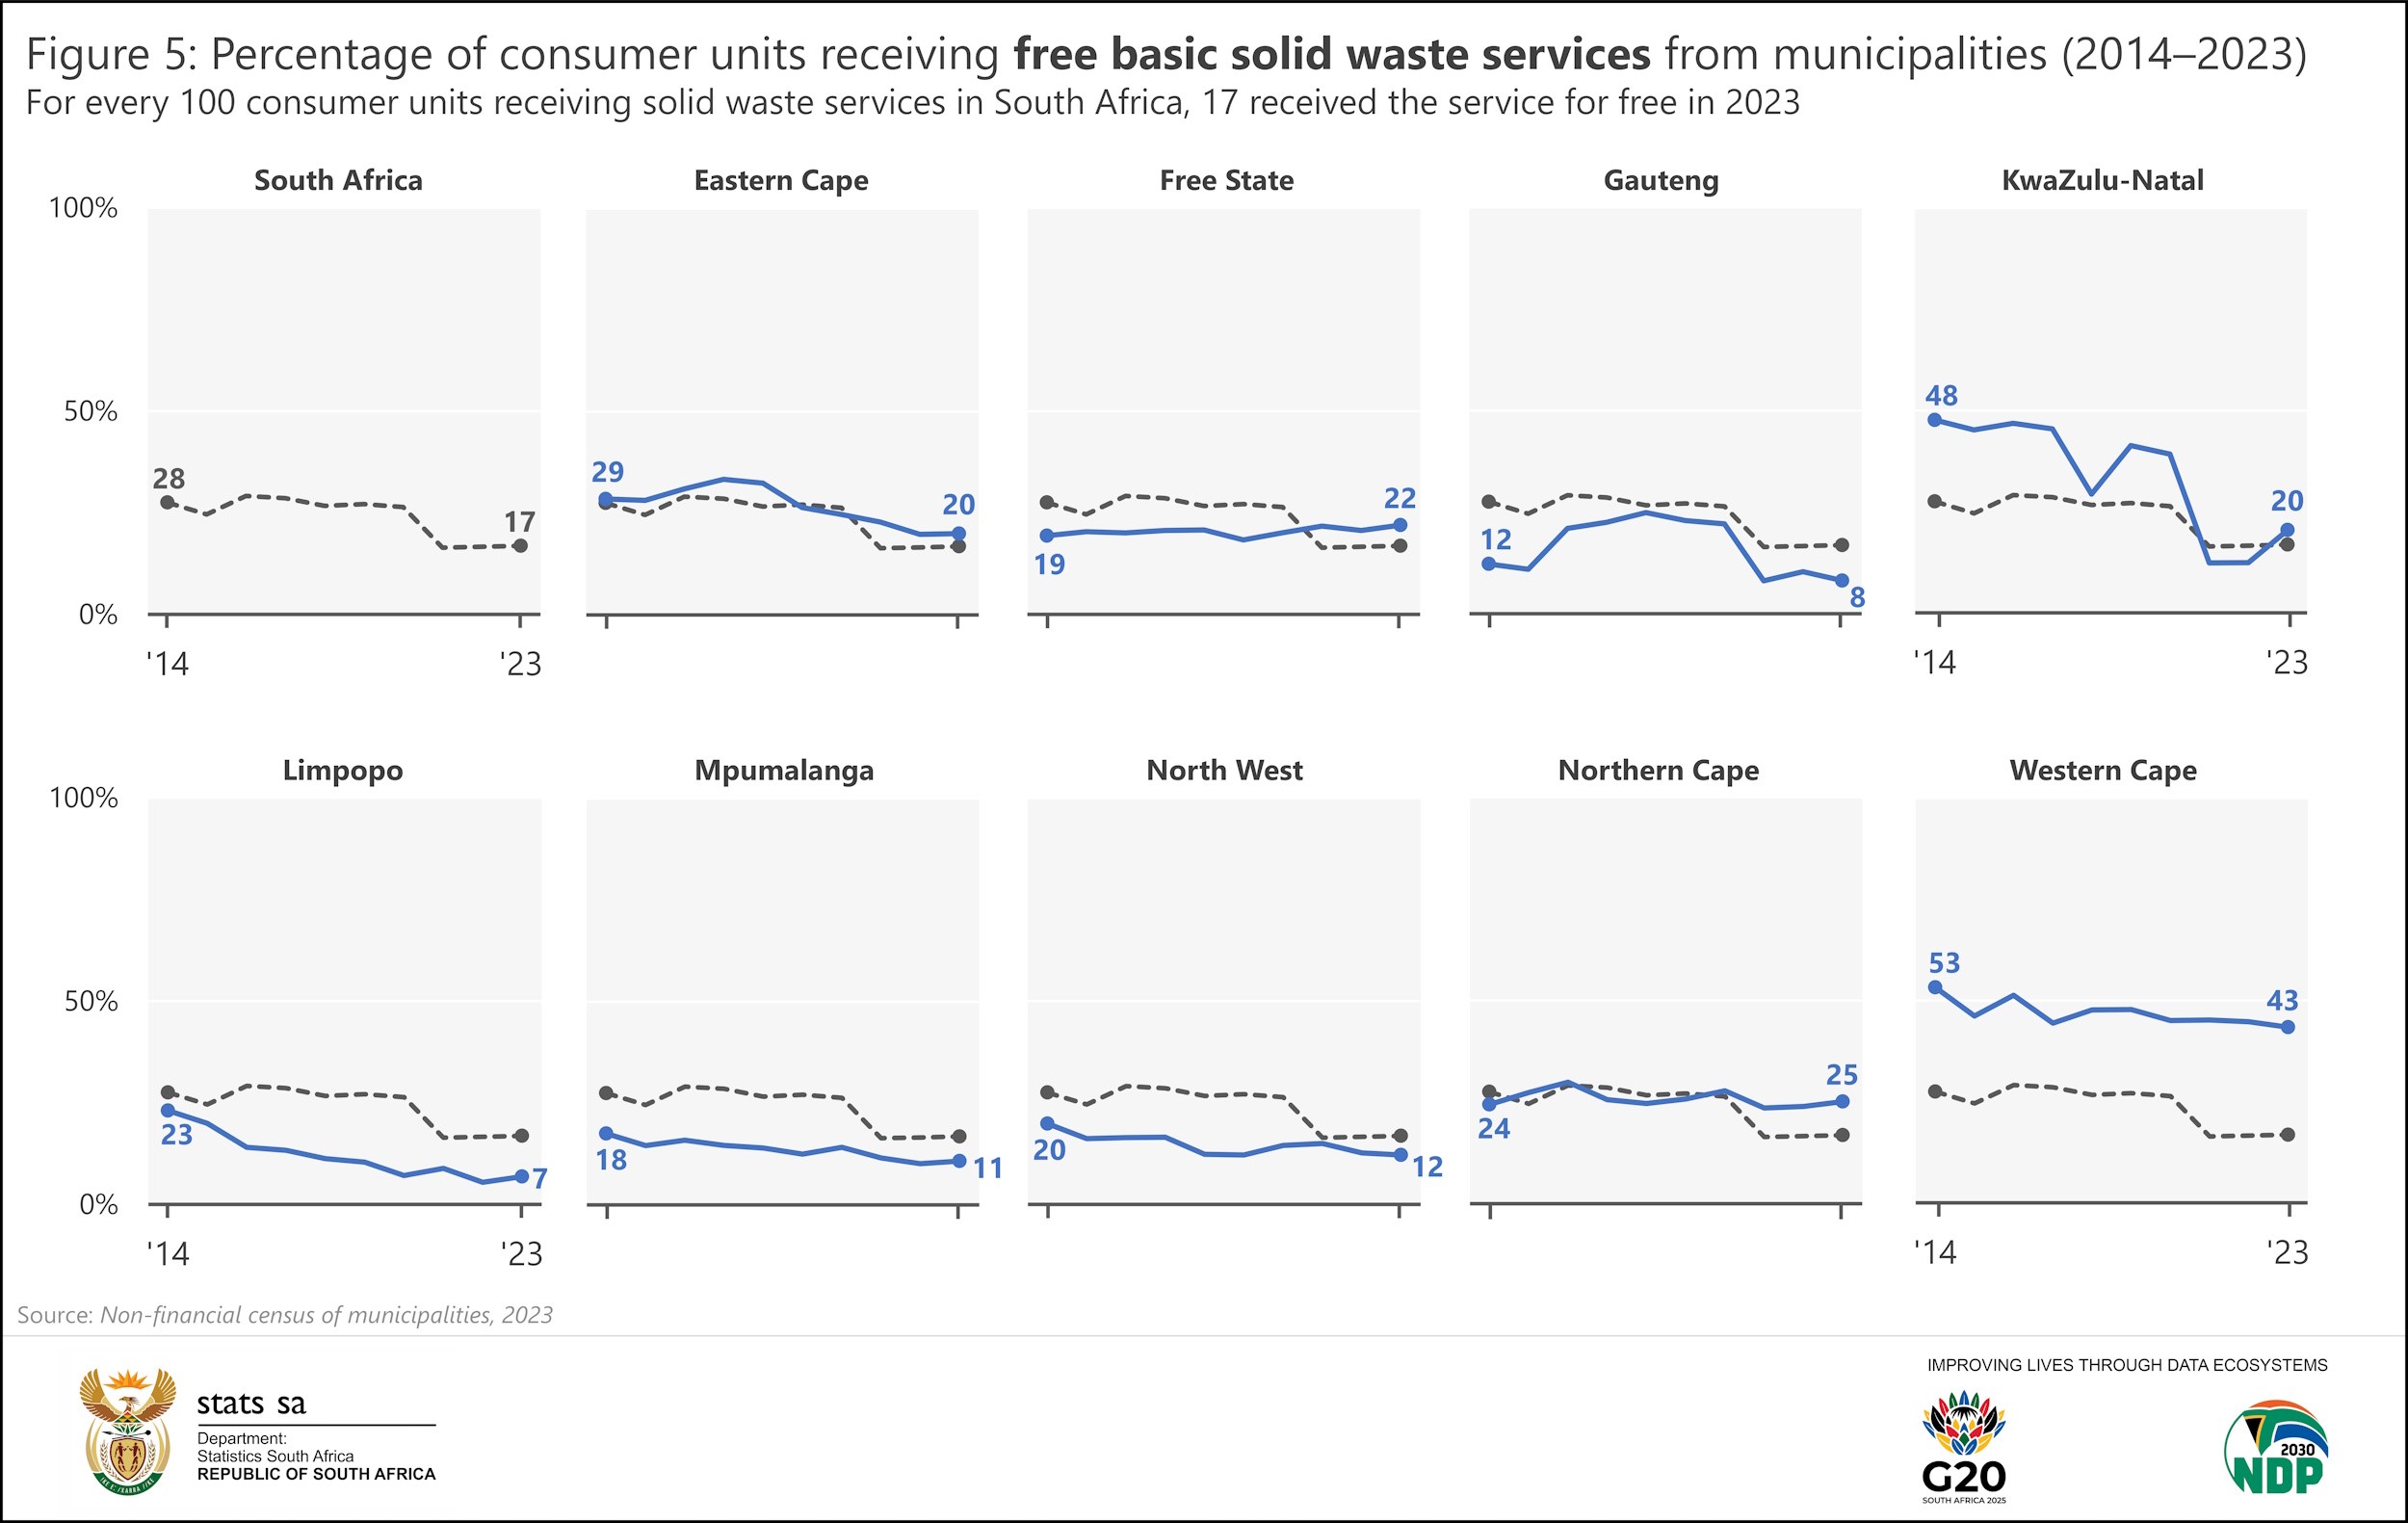
In 2023, three local municipalities indicated that they service all consumer units with free solid waste removal. These included Hantam in Northern Cape, as well as Umvoti and Ndwedwe in KwaZulu-Natal.
Reasons for the decline
Municipalities have become increasingly selective in terms of who they provide free services to. In the past, many municipalities granted subsidised services to all households within their respective jurisdictions. More recently, however, municipalities have narrowed the scope to focus on only the poorest households, mainly due to budget constraints. Mushrooming informal settlements have also placed a strain on municipal resources.
Awareness is another challenge. In the context of free basic services, the onus is on households to register for indigent status. Once granted, households are required to renew their status on a regular basis, often annually. In some communities there may be a lack of awareness regarding the process of registration and renewal of indigent benefits, which may cause some households to fall through the cracks.
For more information, download the 2023 Non-financial census of municipalities statistical report and Excel data here.
1 Department of Water Affairs and Forestry, 2002. Free Basic Water implementation guideline for local authorities, Version 2.3. August 2002 (download here).
2 Department of Minerals and Energy (South Africa). (2003, July 4). Electricity Basic Services Support Tariff (Free Basic Electricity) (Notice 1693). Government Gazette, 25088, p. 3 (download here).
3 Department of Provincial and Local Government, 2007. National framework for Municipal Indigent Policies (download here).
4 A consumer unit is an entity to which the service is delivered, and which receives one utility bill. A consumer unit is alternatively known as a delivery point. This concept is often referred to as a household by municipalities, but this is not strictly correct, as households and consumer units do not coincide one-to-one, particularly in blocks of flats, on stands where there are multiple households in the same dwelling, and in cases where public taps are used.
Similar articles are available on the Stats SA website and can be accessed here.
For a monthly overview of economic indicators and infographics, catch the latest edition of the Stats Biz newsletter here.