

Government financial data might be overwhelming at first, especially for the non-expert. Statistics South Africa (Stats SA) publishes a wealth of government financial statistics. The two tables and overview below provide a useful summary of how the figures can be read and interpreted.
The first table presents an overview of government’s current cash flow position, classifying financial data in economic terms (i.e. according to the nature of the transactions involved). The second table classifies government finances in functional terms (i.e. outlining what government spends money on). These are published as Table A and Table C in the recent Financial statistics of national government statistical release and are based on the Government Finance Statistics Manual (GFSM).1
The GFSM as a foundational framework
The GFSM lies at the core of Stats SA’s government financial statistics. Produced by the International Monetary Fund (IMF),2 the GFSM is a statistics reporting methodology that ensures that government financial actions are presented in a logical and uniform way. The framework allows governments to measure finances using universally known standards and classifications, allowing for meaningful comparisons across countries. The latest version of the GFSM, adopted by South Africa, was developed in 2014.
The GFSM 2014 informs the way in which government financial reports are put together, including the structure of published tables.
The first table: Government’s cash flow position
Table A in the Financial statistics of national government statistical release is divided into three main parts. These are: (1) operational revenue and spending; (2) investment in infrastructure and other fixed assets; and (3) acquisition of financial assets and borrowing.
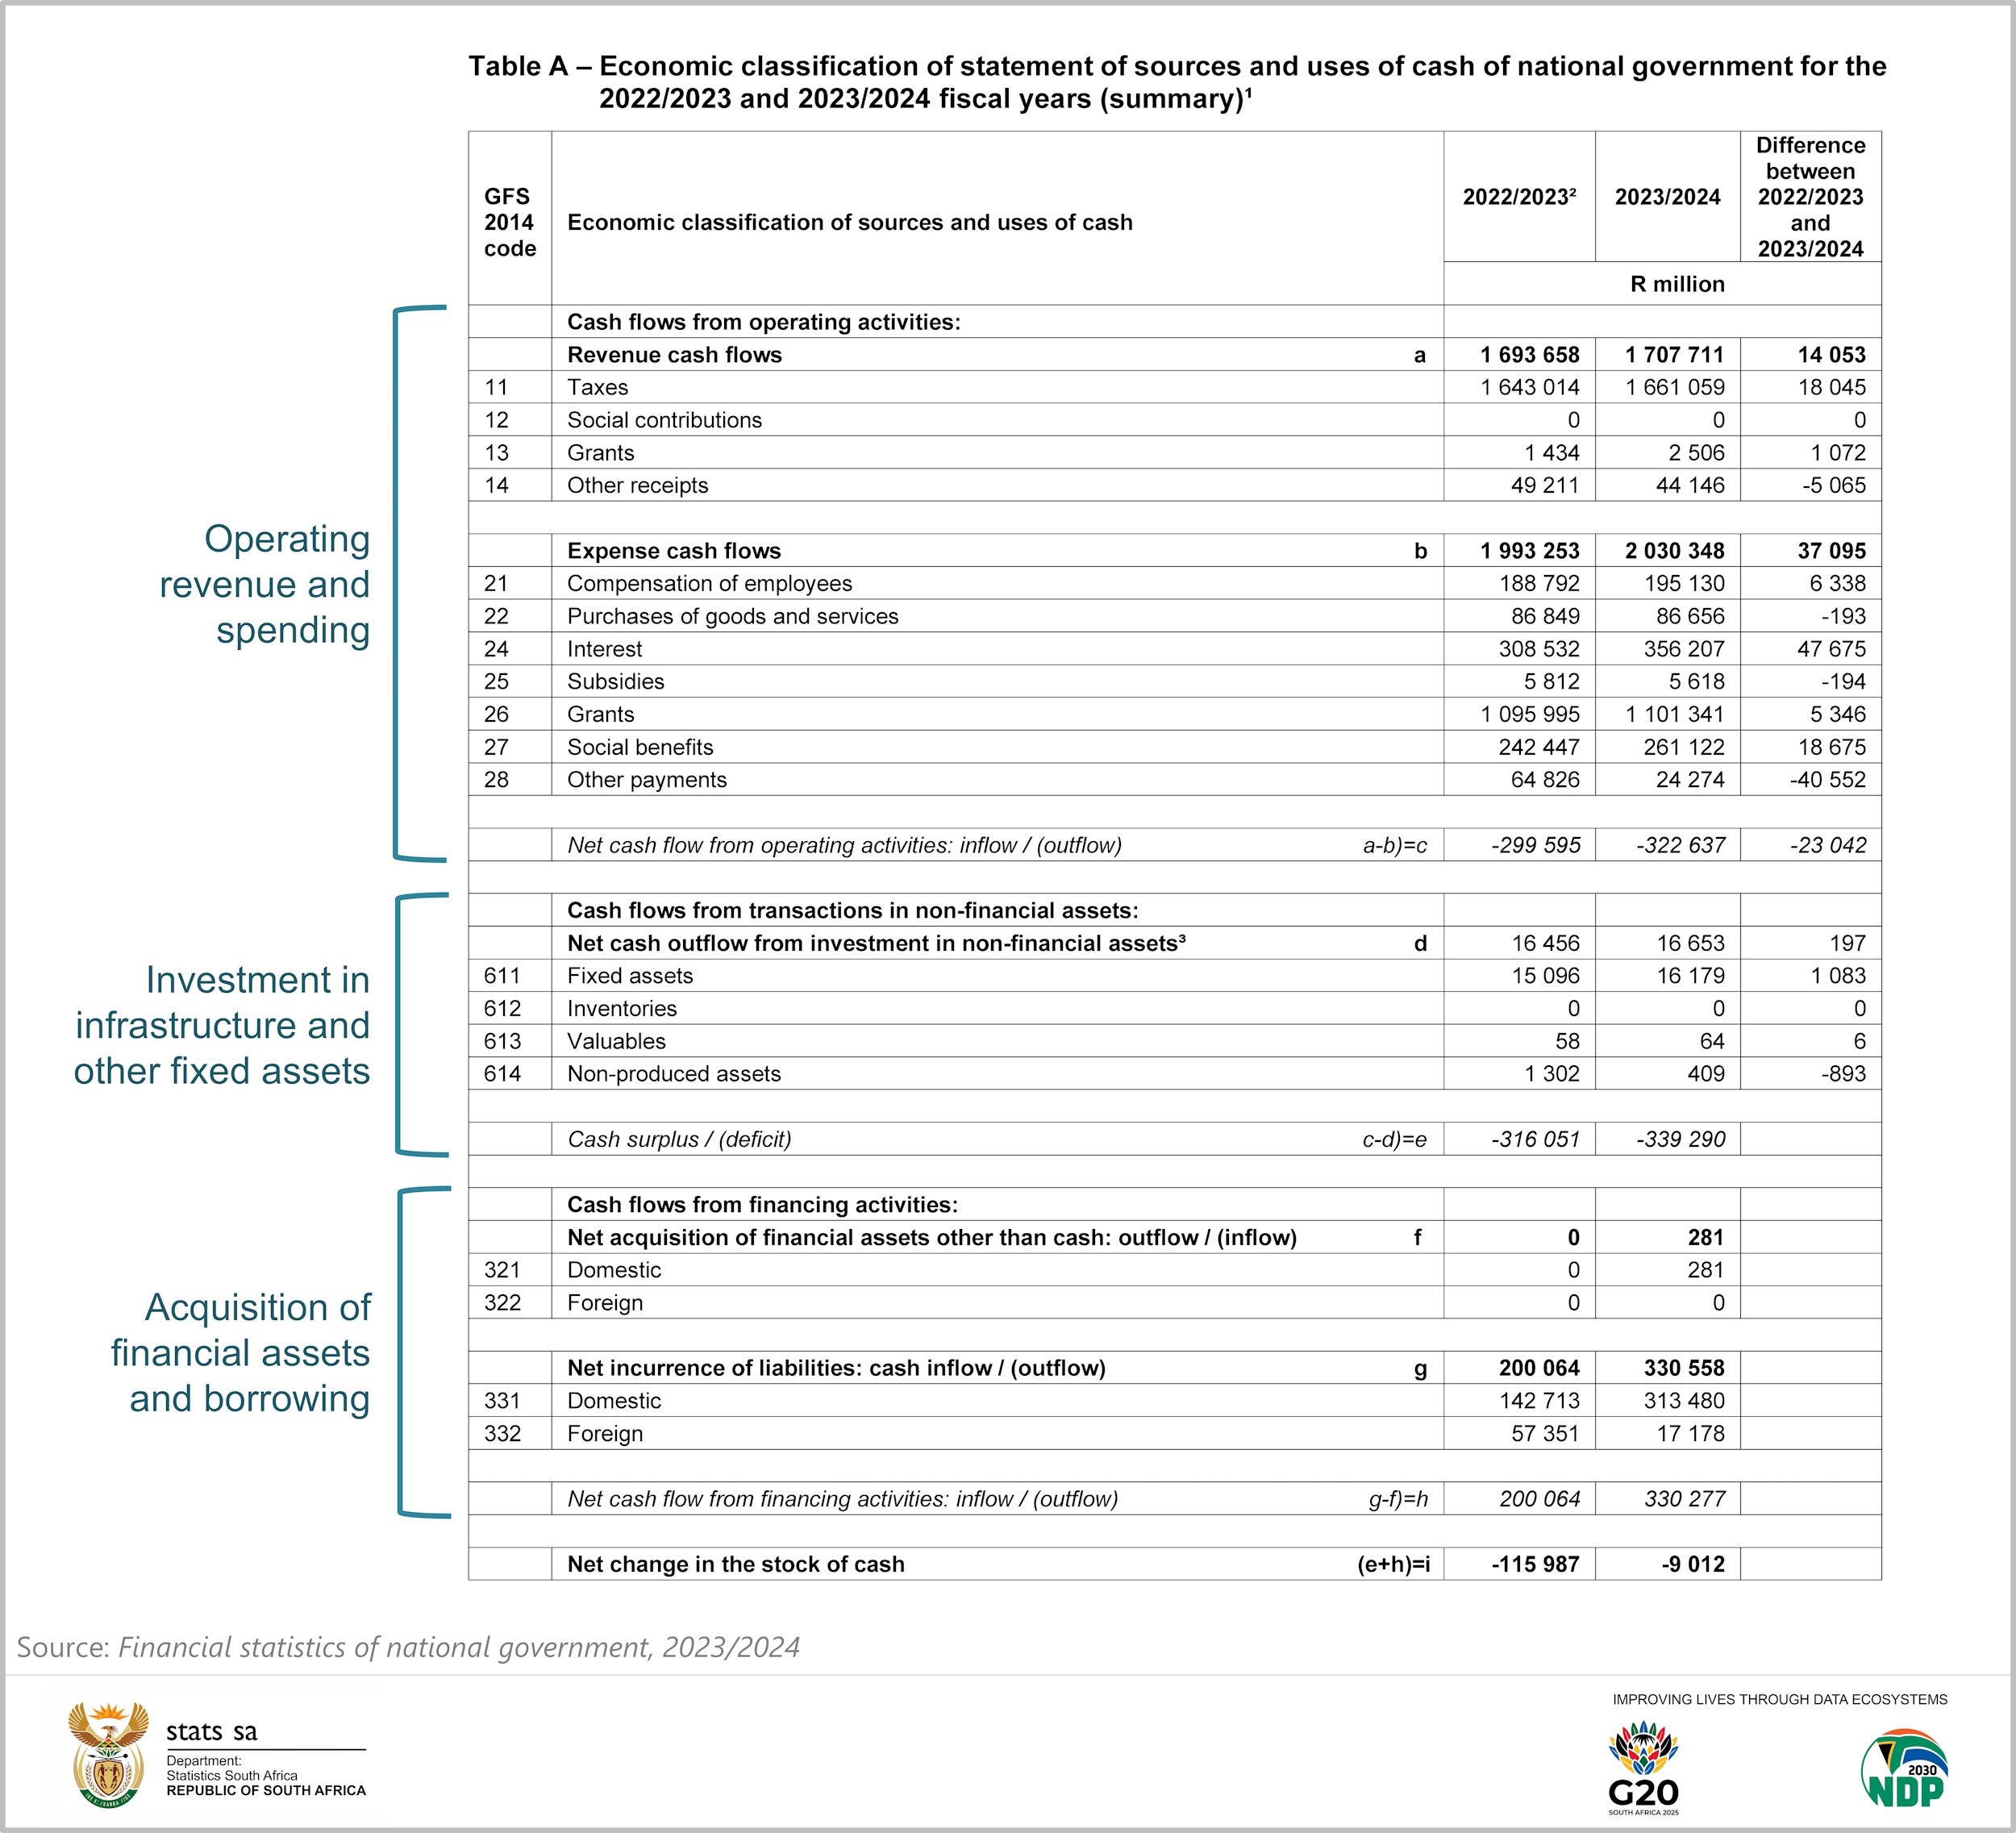
The first part covers financial data related to the day-to-day running of government. Operational revenue is sourced from taxes, social contributions, grants (revenue from foreign governments and international institutions) and ‘other’ receipts. Operational expenses include items such as compensation of employees; purchases of goods and services; and interest paid on debt.
The ‘net cash flow from operating activities’ line item represents the gap between revenue and expenses. National government recorded a shortfall of R299 595 million in the 2022/23 fiscal year, widening to R322 637 million in 2023/24. This was due to expenses outpacing revenue.
Interest payments drove up much of the spending, jumping by R47 675 million (or 15,5%). This line item represents the costs of servicing the country’s debt burden. Its rise shows how debt payments are placing increasing pressure on the fiscus.
Despite the rise in overall expenses, three line items registered a decline. Most notably, ‘other’ payments decreased by R40 552 million (or -62,6%). This was due to the base effect, following a significant capital transfer to ESKOM in 2022/23.
The second part of Table A relates to capital expenditure, referred to in the GFSM 2014 framework as ‘transactions in non-financial assets’. This includes spending related to infrastructure, land acquisition, construction of government buildings, and other productive assets. This is investment for the long term.
Government increased capital expenditure by R197 million between 2022/23 and 2023/24, reflecting government’s continued investment in public infrastructure, including upgrades and maintenance of schools, hospitals, roads, and administrative buildings. Data from Stats SA’s Capital expenditure of the public sector echoes this trend, showing a two-year upswing in infrastructure spending following a five-year decline.3
A more detailed breakdown on investments in infrastructure and fixed assets is provided in Table B.
The third part of Table A incorporates a section on borrowing, included under ‘cash flows from financing activities’. These figures show how much debt government took on during the fiscal year, from domestic and foreign sources. This part of the table also shows adjustments to government’s financial asset holdings.
In 2022/23, national government raised R200 064 million in the form of debt, rising significantly to R330 558 million in 2023/24. This reflects the increased need to fund the growing deficit and rise in capital expenditure. The bulk of this borrowing came from domestic sources. Domestic financial markets supported more of government’s fiscal operations, while foreign borrowing decreased between the two fiscal years.
The second table: What does national government spend money on?
The functional classification of expenditure provides information on the purpose for which money was spent. Examples of government functions include education, health, defence and environmental protection. The Classification of Functions of Government (COFOG), developed by the United Nations, outlines ten categories. These are covered in Table C.
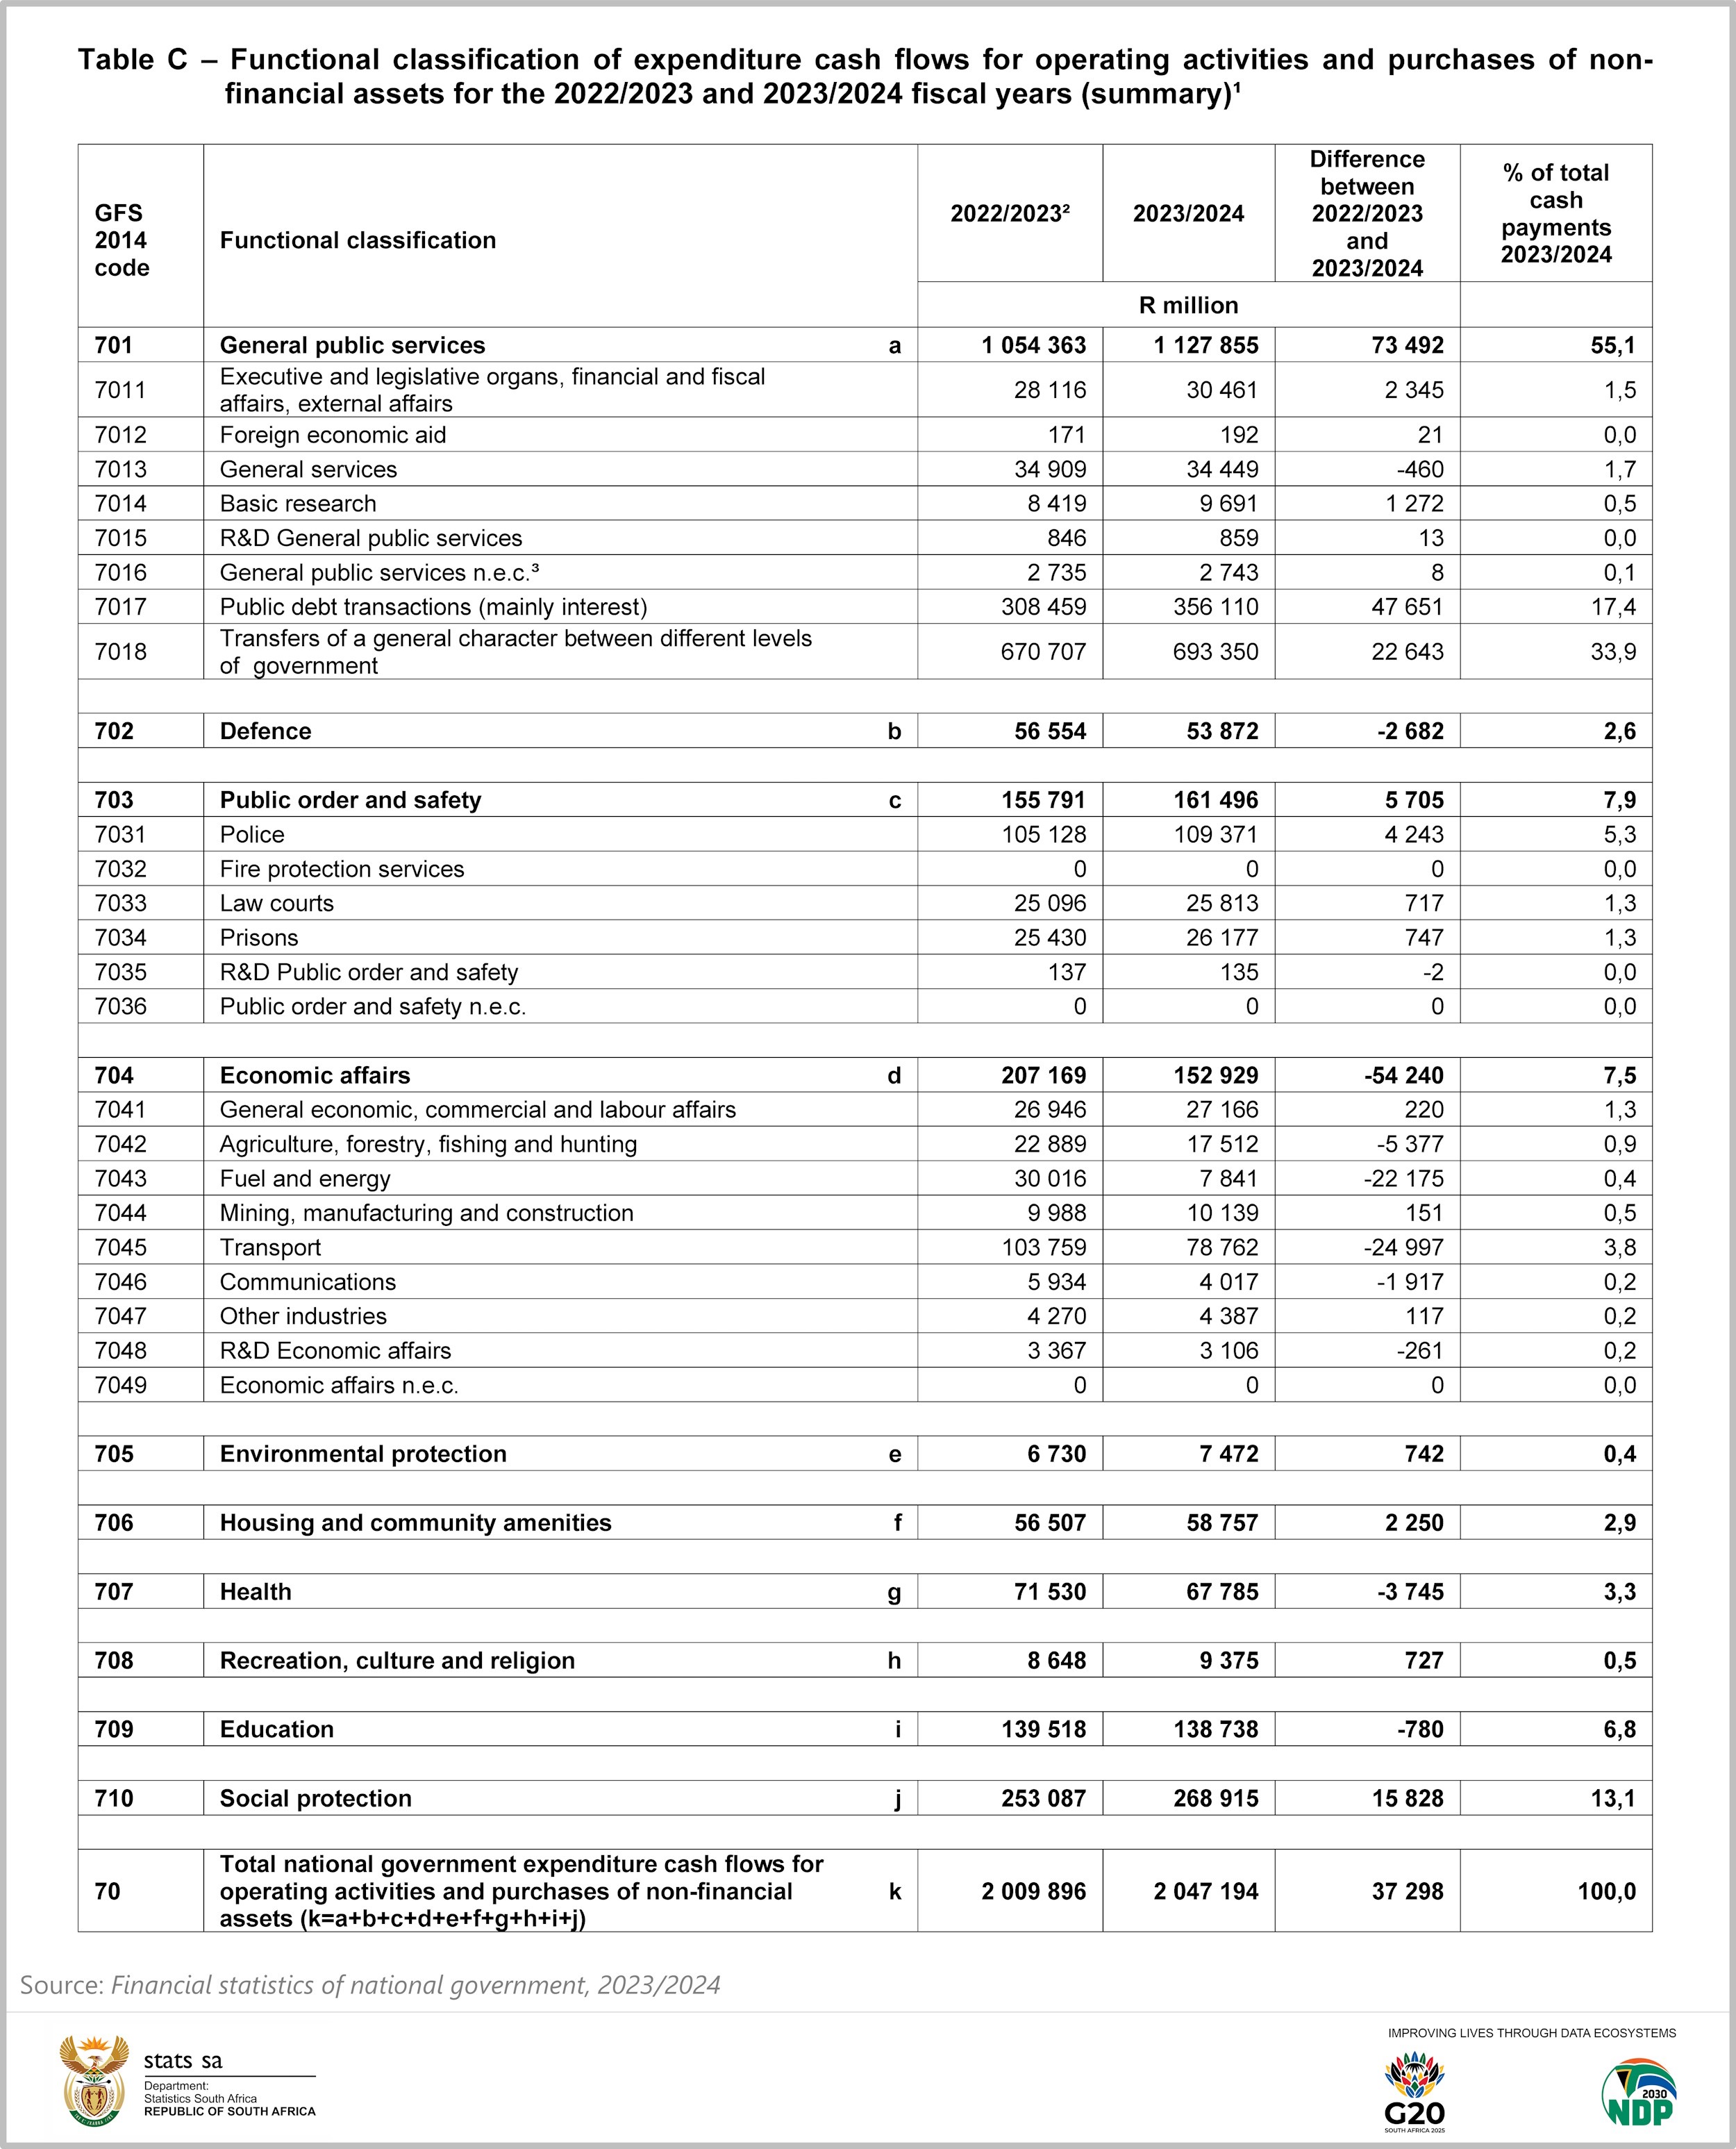
The table provides insight into national government’s spending priorities. In the 2023/24 fiscal year, general public services took up over half of total expenditure. The two largest line items in general public services – taking up 93% of expenditure in this category – were transfers to other government departments and interest payments on debt. One of the roles of national government is to provide financial resources to other levels of government, which is recorded as transfers. Interest payments on debt, which was mentioned earlier, accounted for 17,4% of total expenditure.
Social protection and public order & safety were also significant spending items.
These tables provide a summary of government finances. For more information, download the latest Financial statistics of national government statistical release and Excel files here.
1 Note that the Financial statistics of national government statistical release and all data covered in this article are for national government departments only. Releases for other levels of government (i.e. provincial, local, extra-budgetary accounts and funds and higher education institutions) are published during the course of the year. A consolidated document will be published in November, providing a financial overview of the entire government sector for the 2023/24 fiscal year.
2 International Monetary Fund, Government Finance Statistics Manual, 2014 (download here).
3 Stats SA, Public-sector capex rises for a second straight year [4 November 2024] (read here).