

There is more to the consumer price index (CPI) than the headline figure. Stats SA publishes the CPI every month on the second-last Wednesday at 10:00. One of the datasets published with the statistical release allows users to create custom indices and inflation rates.
The CPI basket: A profile of household spending
The inflation basket of goods and services forms the foundation for calculating the CPI. Stats SA identifies products that South African households spend the most money on, and these are incorporated into the basket. The current version of the basket, updated in January 2025, consists of 391 products.1
Every month, fieldworkers across the country collect price data for many of these products. Other prices are collected quarterly or annually. Prices are converted into indices that feed into the calculation of the CPI and the inflation rate.
Published indices: Moving beyond a single figure
Analysts are often interested in more detail than just the headline index. Table A in the statistical release includes indices and inflation rates for provinces and socio-economic groups.2 Versions of the CPI, called analytical indices, focus on particular areas of interest. Examples include a CPI for pensioners, a CPI for non-durable goods and a CPI that excludes housing. There are 16 analytical indices available that cater to different needs.
Price indices are also available for aggregated items in the CPI basket. There is an index for the broad category of food & non-alcoholic beverages, for example. At a more granular level, indices exist for subcategories such as meat, cereal products and hot beverages. These appear in the statistical release under Table E.
One can drill down even further, with data available for all 391 elementary indices used in compiling the CPI. These are available in the CPI (COICOP 2018 – 8-digit) Excel dataset published with the statistical release. All 391 products in the basket of goods and services can be tracked monthly, with the dataset providing a time series from January 2008 to date. At the time of writing, the most recent version contains data for March 2025.
DIY basket: A step-by-step guide
These lower-level indices can create custom-made baskets, indices and inflation rates. Let’s say we are interested in price changes for education. An index that includes all education-related goods and services does not appear in the statistical release, so we will need to build our own.
The process involves six steps, adopting the method used by Stats SA to calculate inflation rates in the statistical release.
The first step is to look through the 391 products in the Excel dataset to identify those associated with education. This reveals 20 products. Notice how these are scattered across different categories in the CPI basket. For example, school uniform items are classified under clothing & footwear. Textbooks and books are listed under recreation, sport & culture.
| Clothing & footwear | |
| 1. School shirts | |
| 2. School jerseys | |
| 3. School trousers/shorts | |
| 4. School skirts/dresses/skorts | |
| 5. School socks | |
| 6. School shoes | |
| Transport | |
| 7. School transport | |
| Information & communication | |
| 8. Calculators | |
| Recreation, sport & culture | |
| 9. Textbooks | |
| 10. Books (incl. exam pads and writing pads) | |
| Education services | |
| 11. Pre-primary and primary education (Public) | |
| 12. Pre-primary and primary education (Private) | |
| 13. Secondary education (Public) | |
| 14. Secondary education (Private) | |
| 15. Tertiary education (Public) | |
| 16. Tertiary education (Private) | |
| Restaurants & accommodation services | |
| 17. University boarding fees | |
| Miscellaneous | |
| 18. School bags | |
| 19. Crèche fees | |
| 20. After-school centres | |
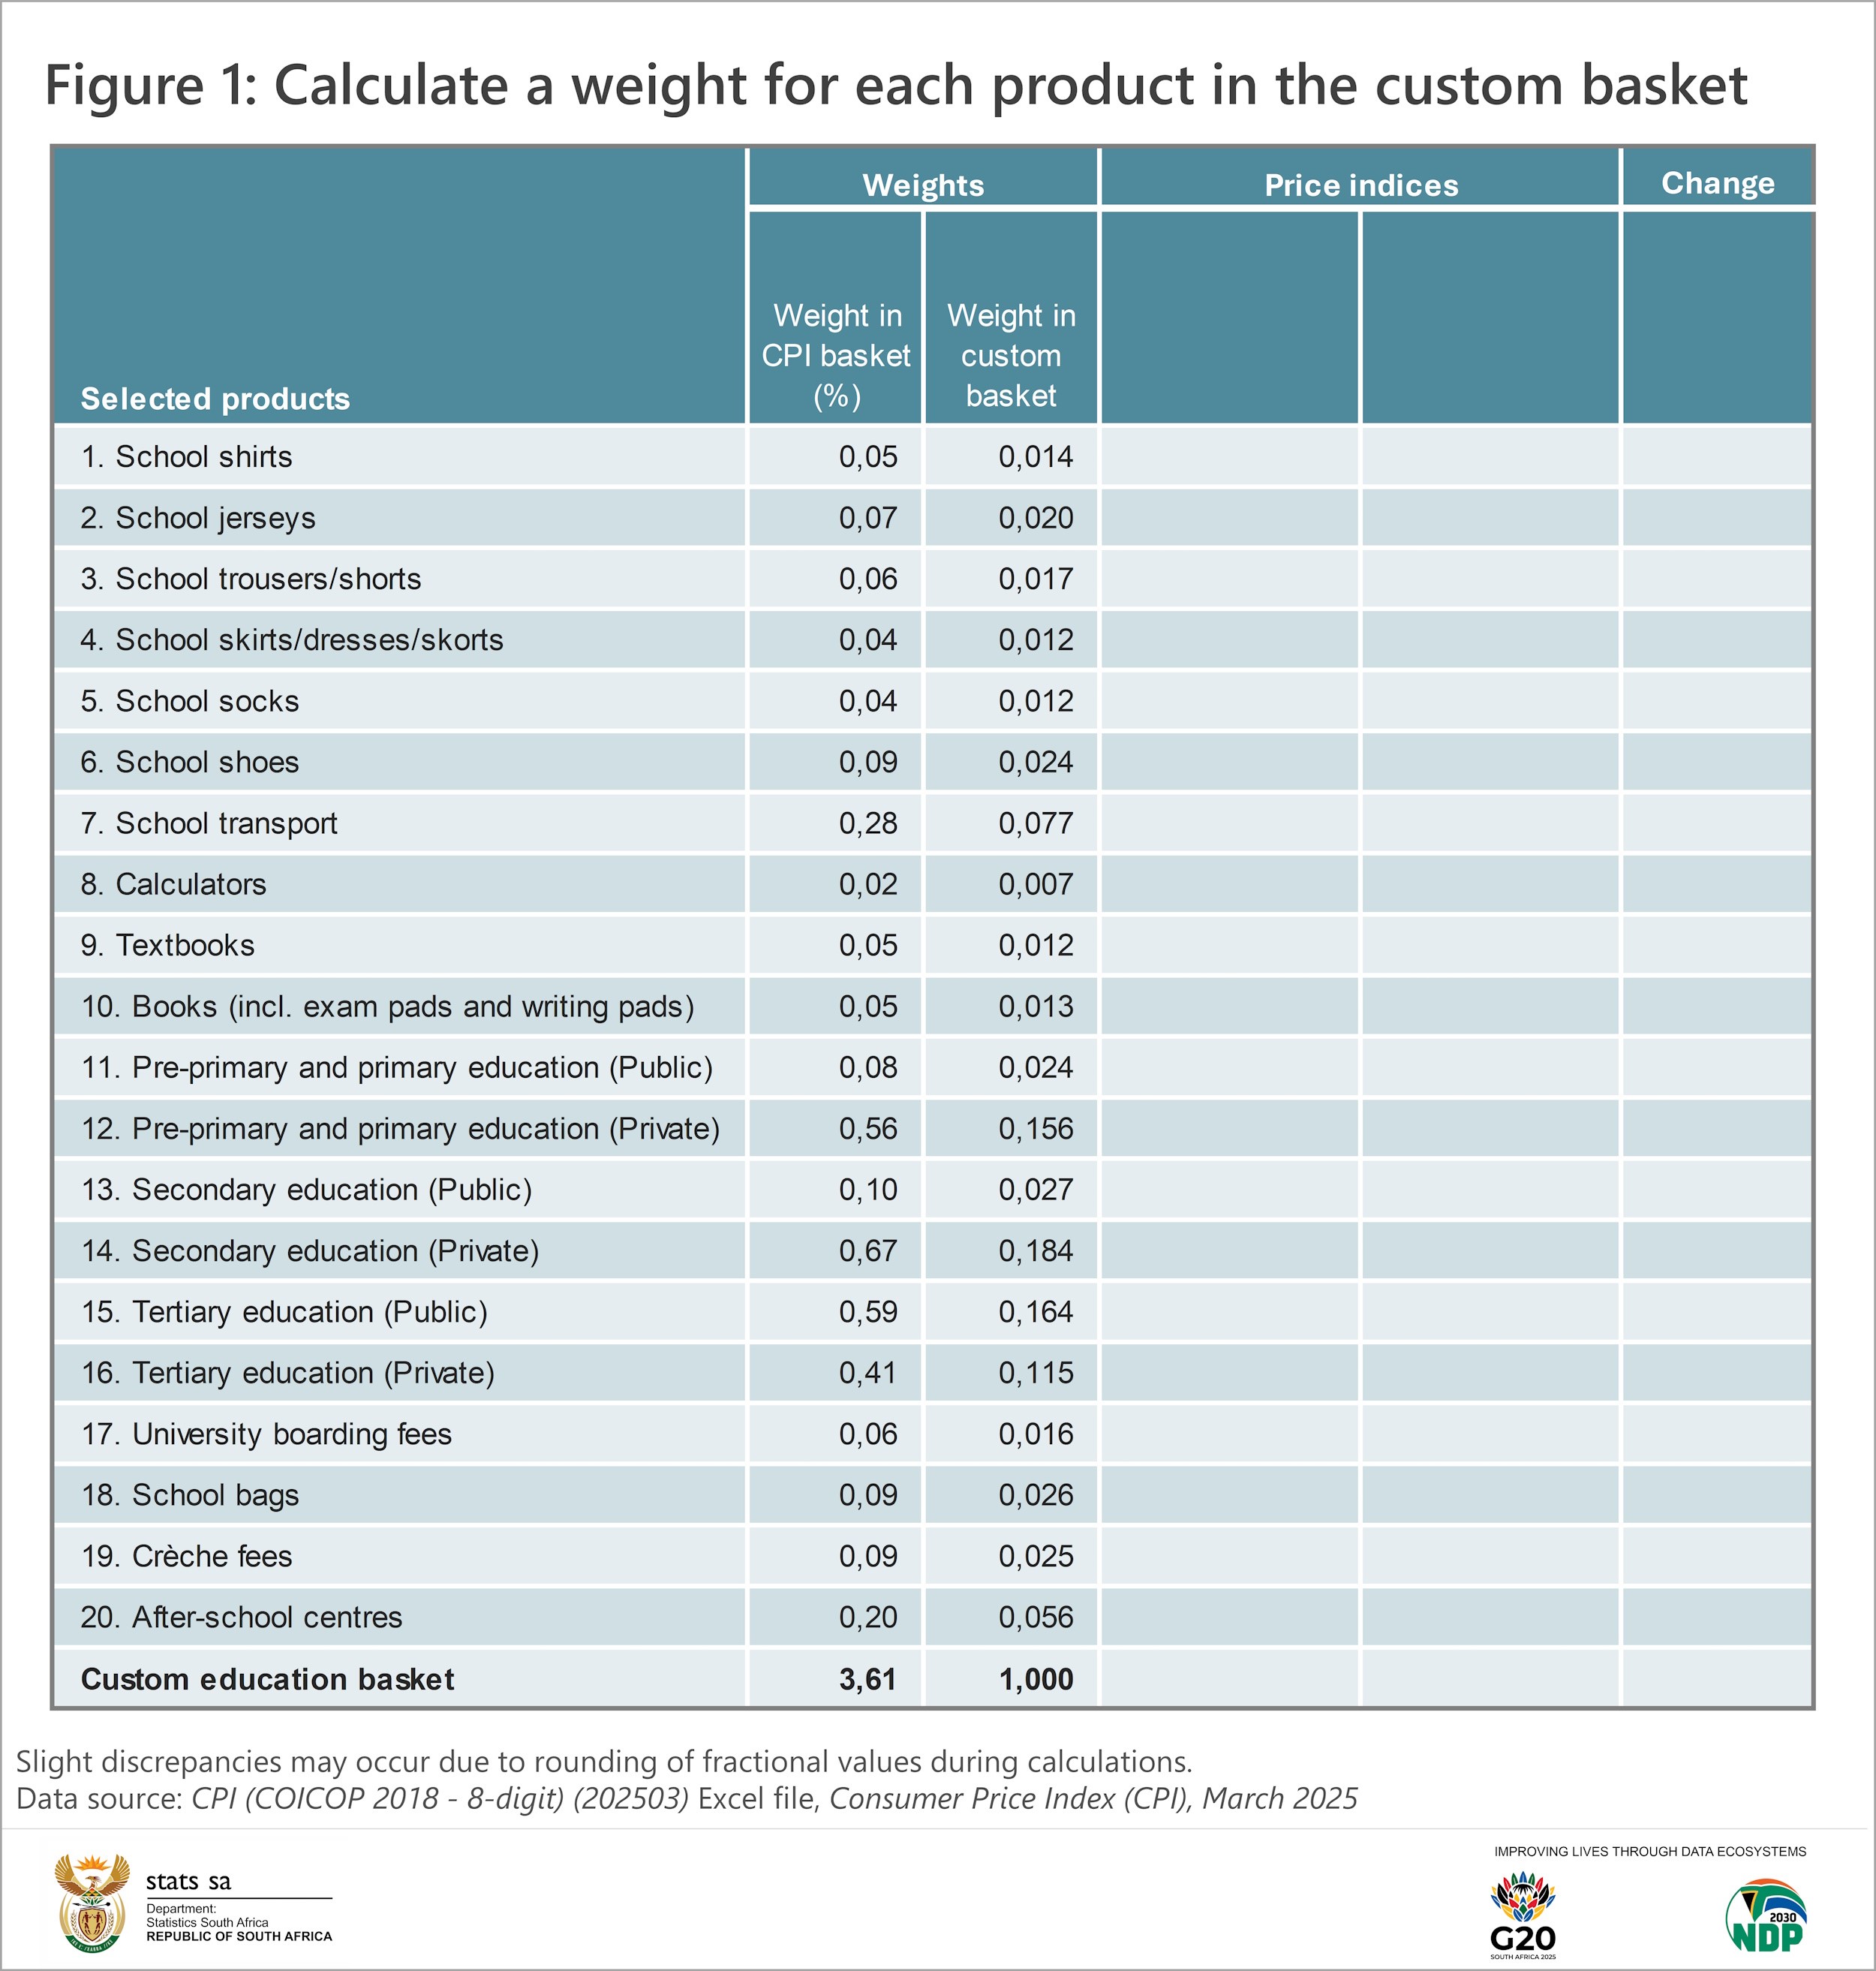
The second step is to identify the weights associated with these products. These are also available in the Excel dataset. The weight represents a product’s contribution to the CPI basket (i.e. to total household spending). For example, school jerseys account for 0,07%. If the weights for all 20 products are added together, the custom-made basket contributes 3,61% (Figure 1).
The third step is to adjust these weights so that they reflect each product’s contribution to our custom basket. This is done by dividing the CPI basket weight for each product by the total of 3,61%. For example, the calculation for school jerseys is:
School jerseys: 0,07 / 3,61 = 0,020
In other words, the weight for school jerseys in our custom basket is 0,020.3 Adjusting the weights in this manner results in a custom basket total of 1 (Figure 1).
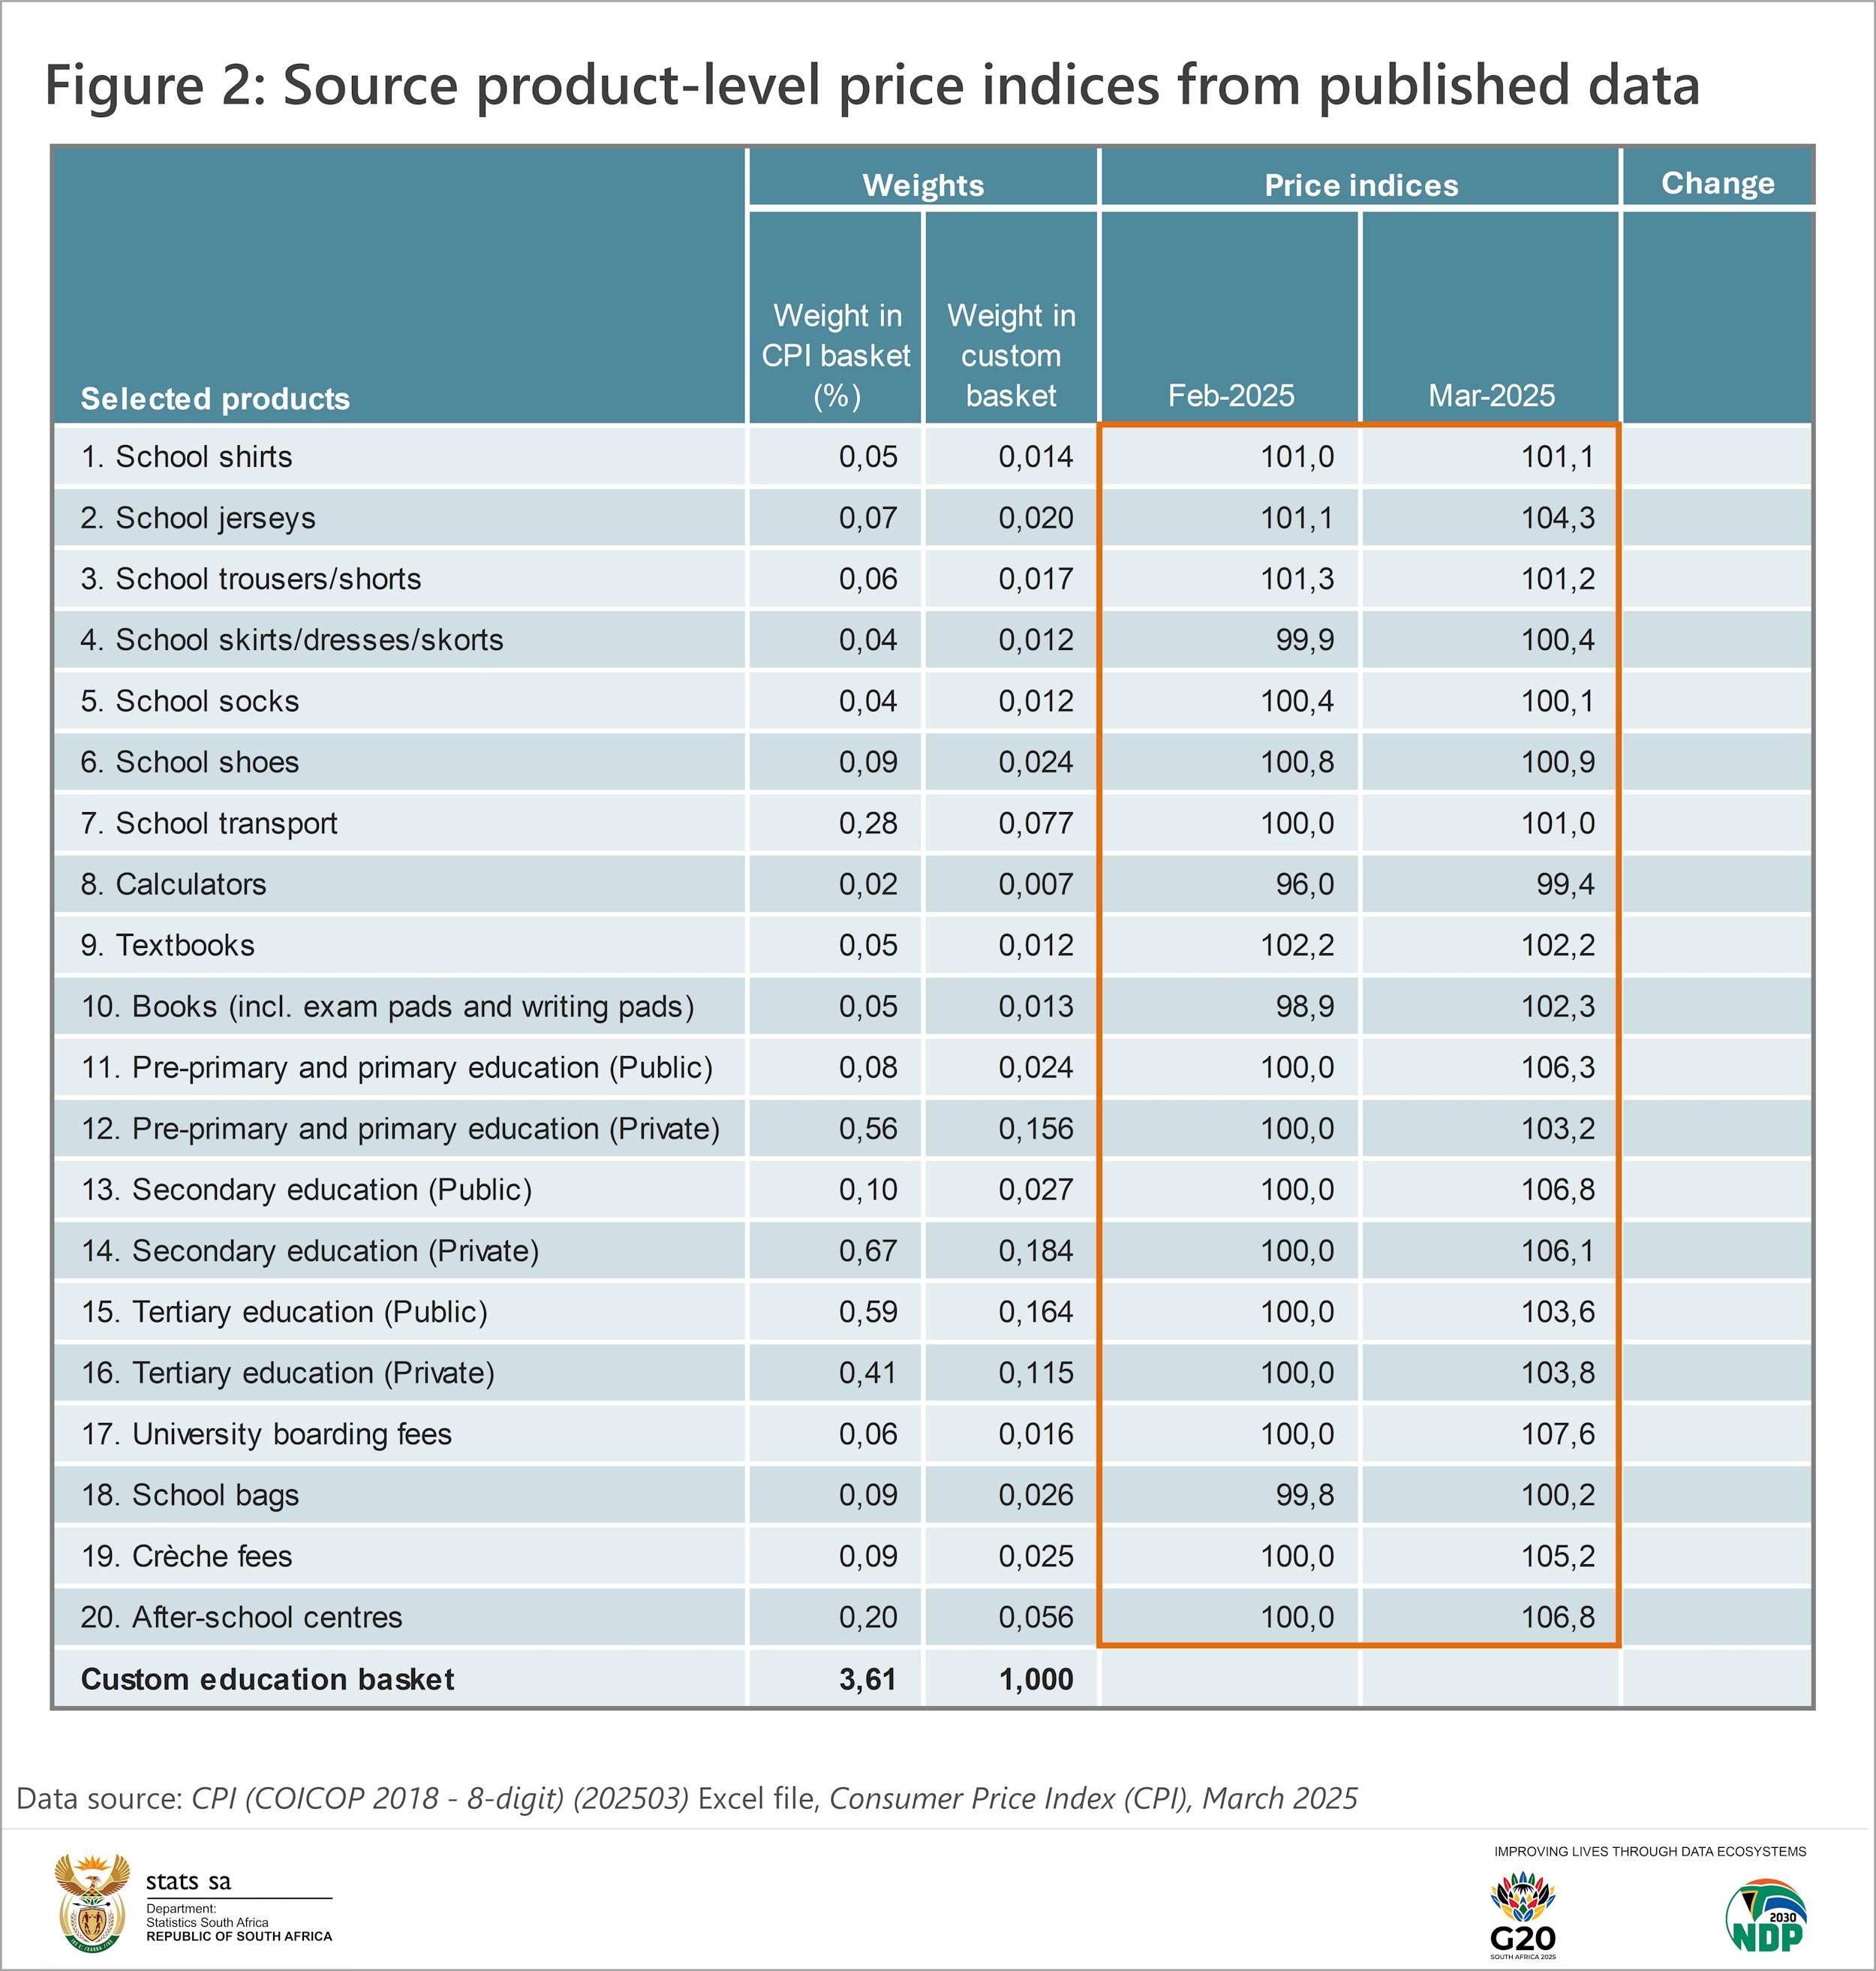
Step four involves sourcing price indices for two time periods from the Excel dataset. These indices will be used to calculate aggregate indices and eventually the inflation rate for our custom basket. In this example, indices for February 2025 and March 2025 are selected (Figure 2).
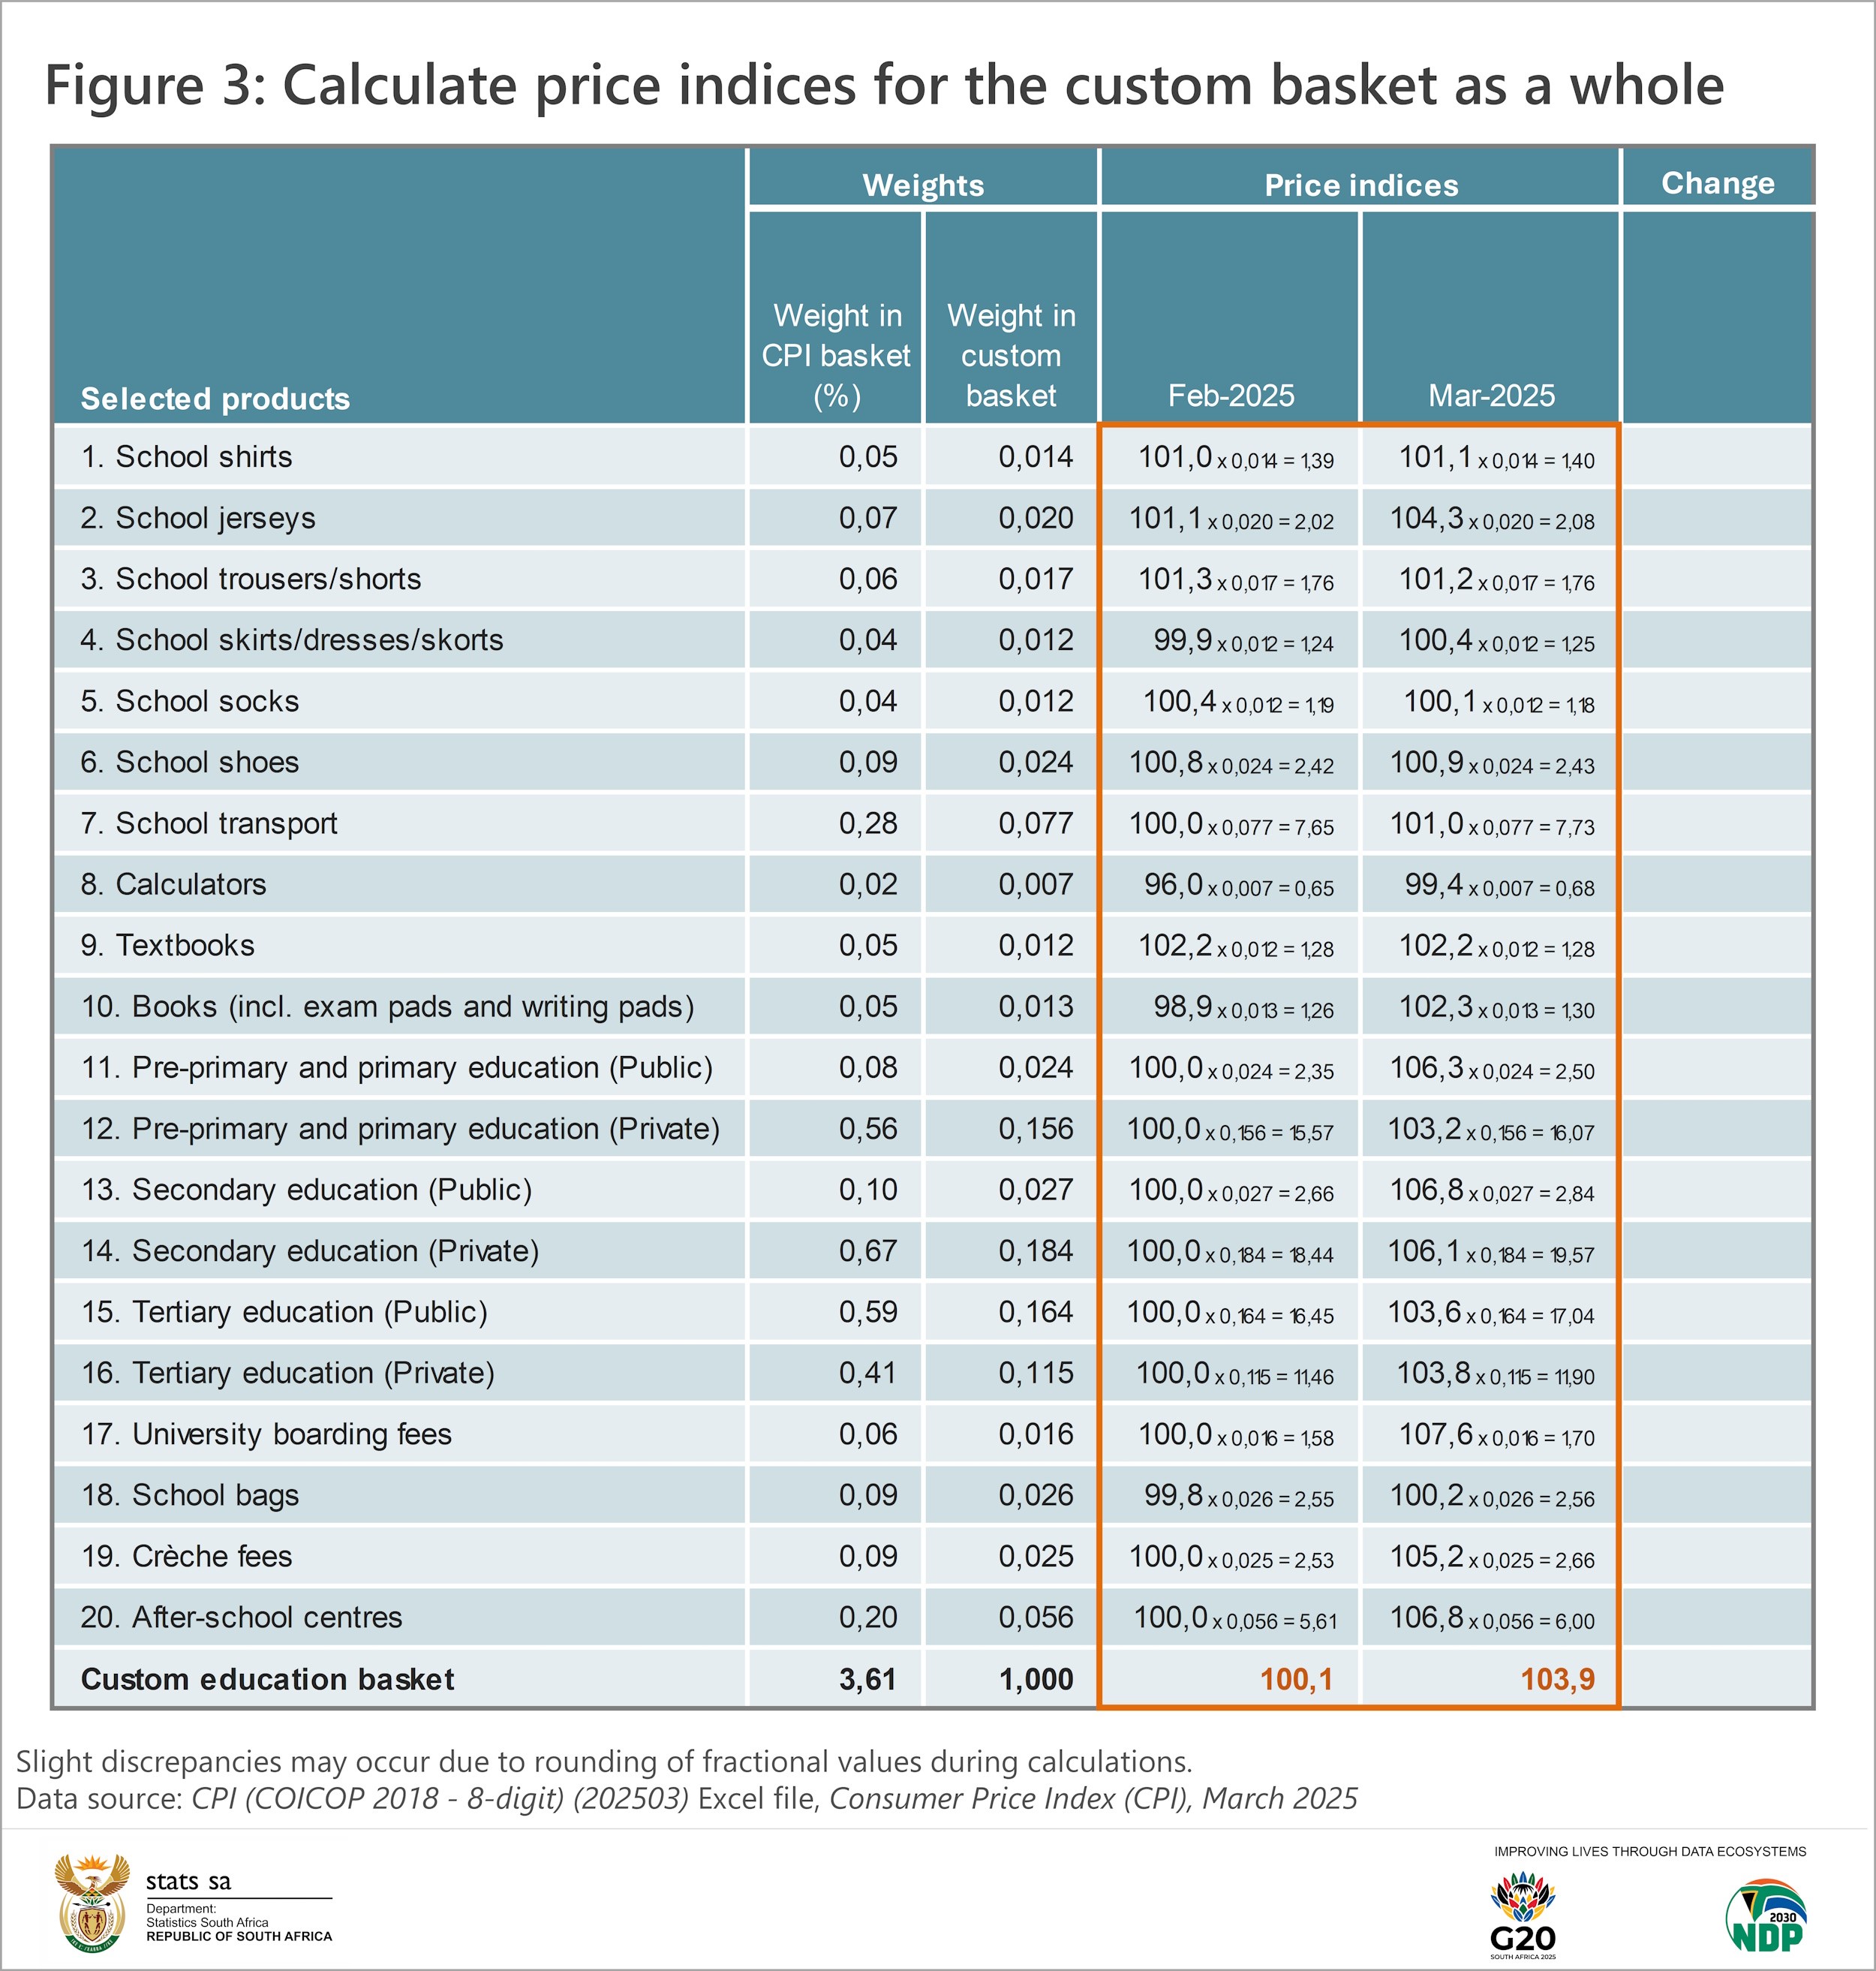
Step five is to calculate two price indices (one for February and one for March) for the custom basket as a whole. This is the trickiest part of the exercise but can be easily done in Excel. Two calculations are involved. First, determine a weighted index for each product by multiplying the product’s price index by its weight. For example:
School jerseys: 101,1 x 0,020 = 2,02
This calculation is performed for all products in the list, leaving us with 20 weighted indices for February. The second calculation is to add up all these weighted indices to give us an aggregate index for our basket, which is 100,1 for February. The same method returns an overall index of 103,9 for March (Figure 3).
The sixth and final step is to calculate the percentage change in price (i.e. the inflation rate) for our custom basket using these two main indices (Figure 4). Subtract the February index from the March index, divide the difference by the February index and multiply by 100.
[(103,9 – 100,1) / 100,1] x 100 = 3,8
This states that the overall price of education – based on the products in our list – increased by 3,8% between February 2025 and March 2025.
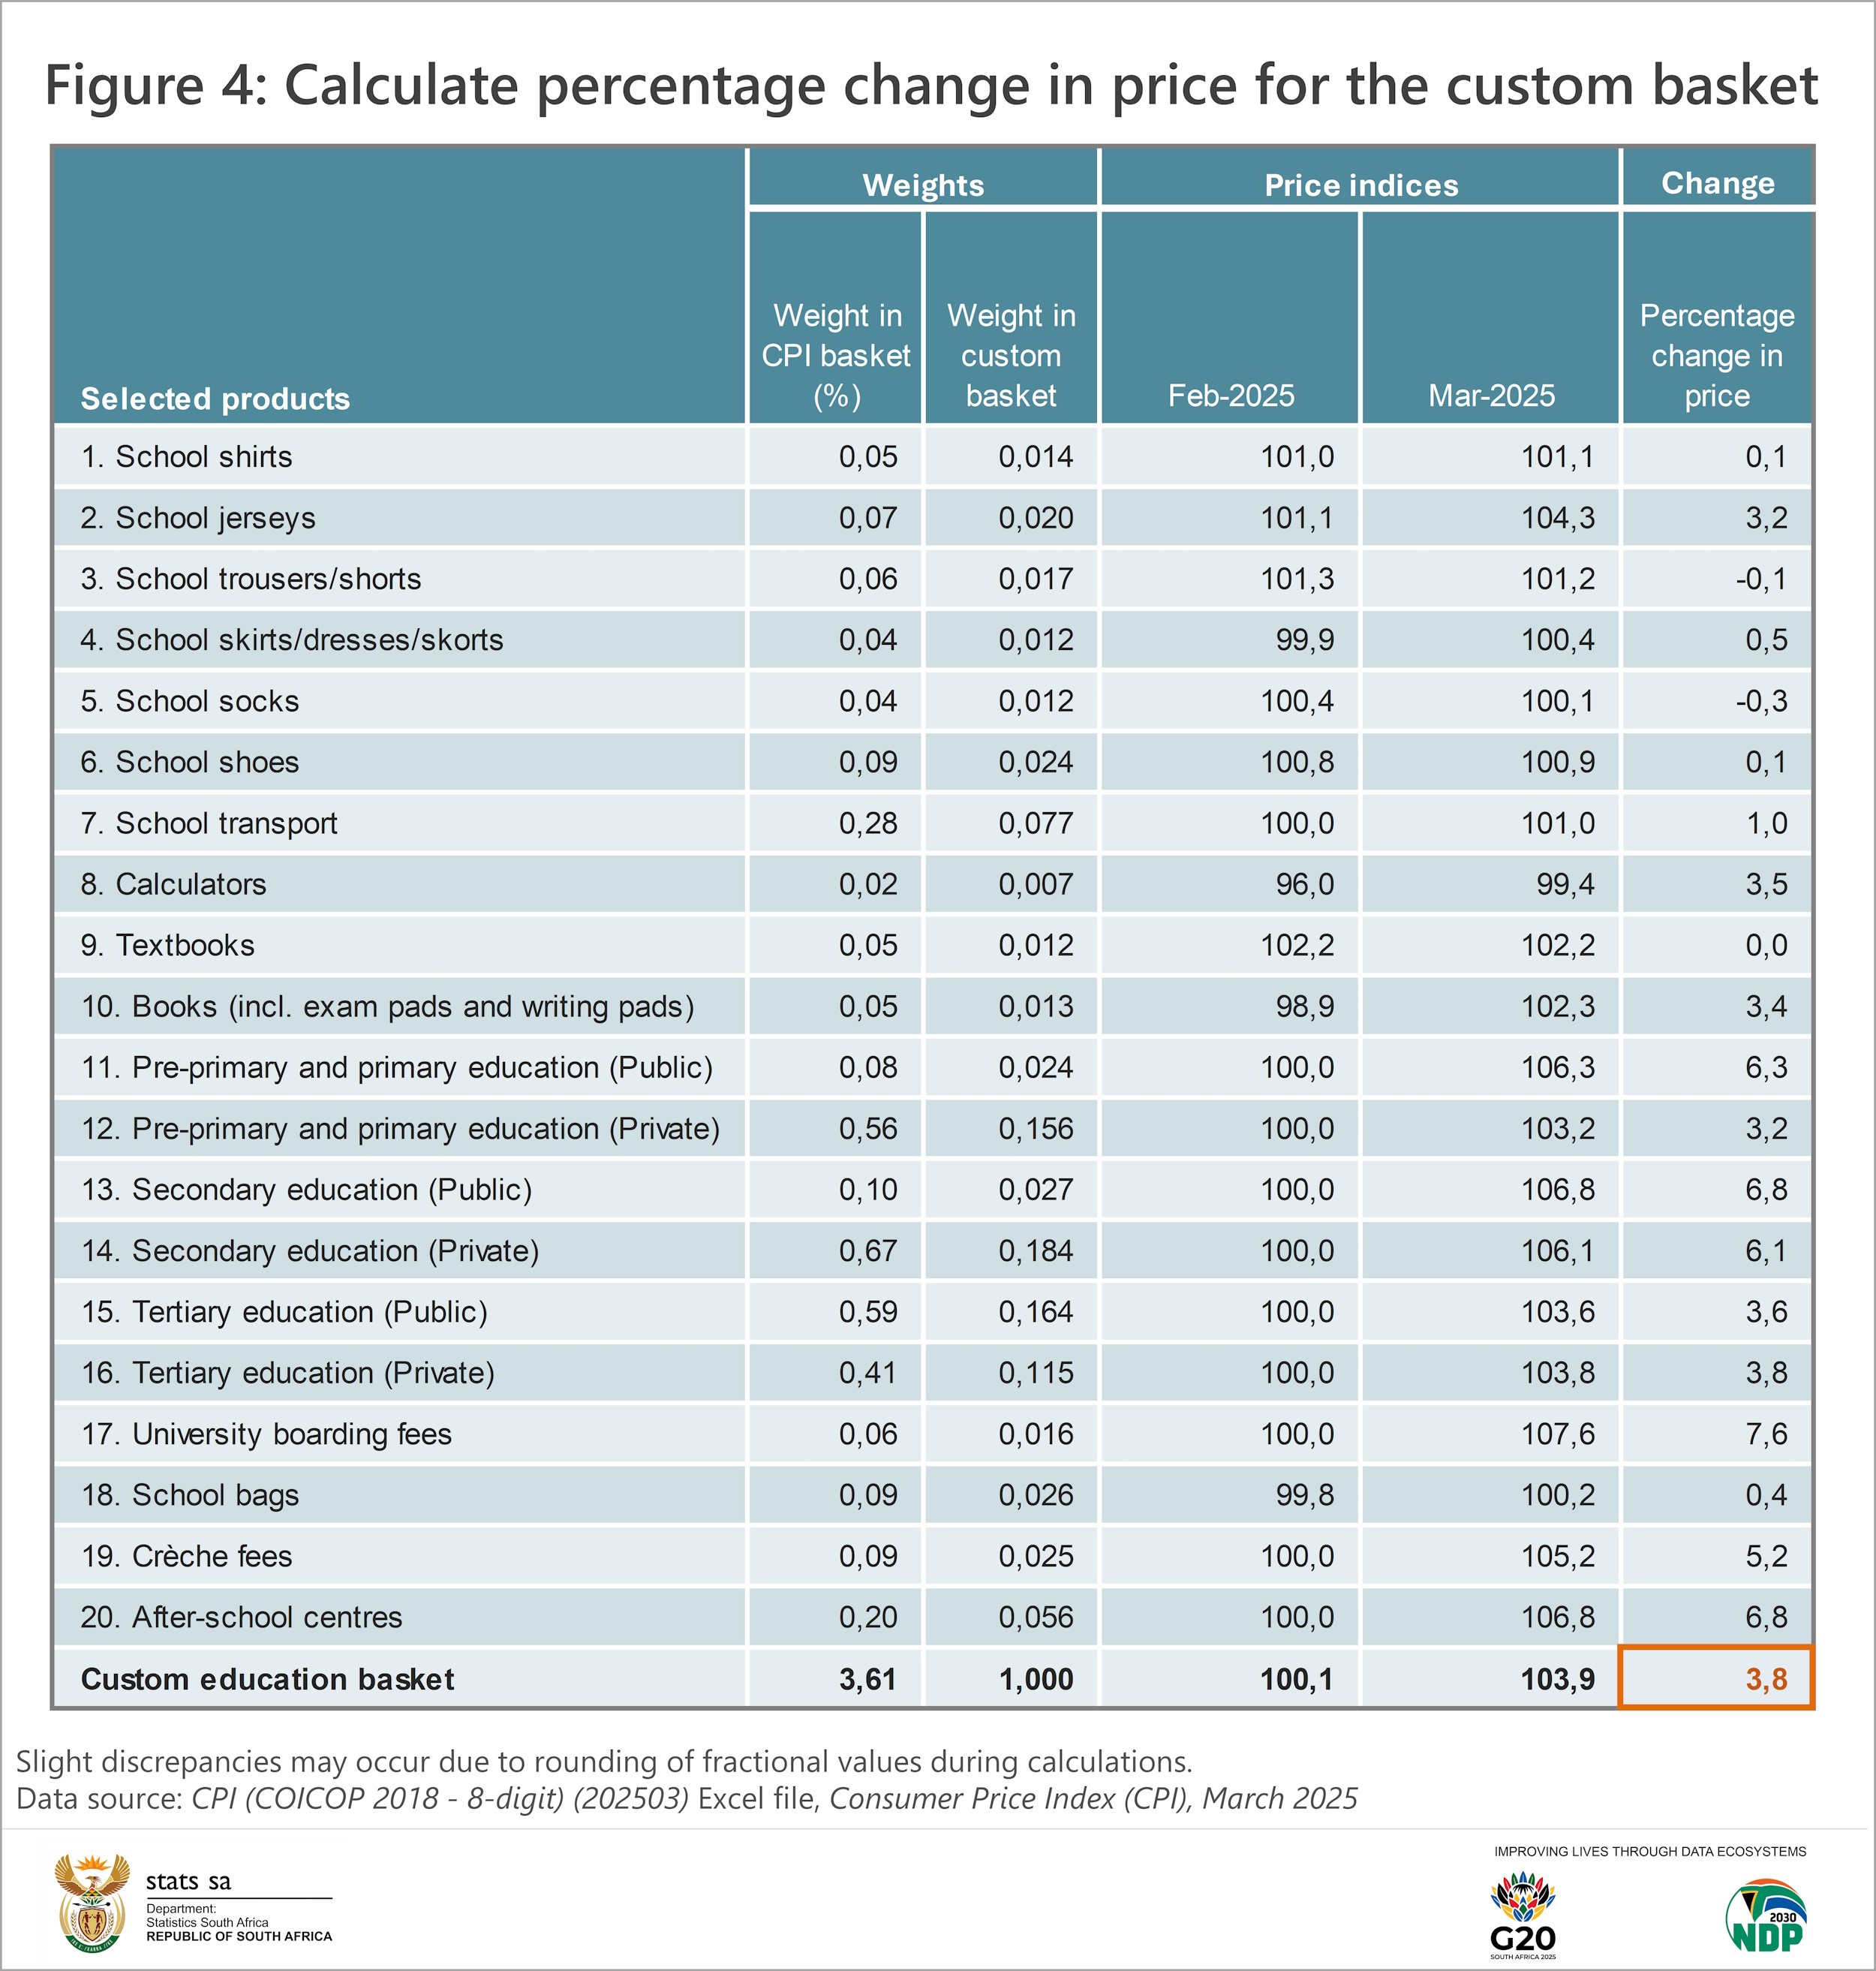
The same percentage change formula is used to calculate an inflation rate for each of the 20 products. The price of school socks decreased by 0,3% between February and March. Fees for public secondary education and after-school centres increased by 6,8%.4
Are you interested in trying this with your own set of products? Experiment with the March 2025 CPI (COICOP 2018 – 8-digit) Excel dataset, available here for download. For more recent data, visit the CPI archive here.
1 An overview of the current CPI basket is available here.
2 An exploration of inflation rates for socio-economic groups is outlined here.
3 Slight discrepancies in the results may occur due to rounding of fractional values during calculations.
4 Note that many education institutions increase their fees once a year in March. This explains why the monthly fee increases shown above for crèches, schools, after-school centres, boarding and tertiary institutions might seem higher than expected.
Similar articles are available on the Stats SA website and can be accessed here.
For a monthly overview of economic indicators and infographics, catch the latest edition of the Stats Biz newsletter here.