

Retail trade sales surged in November, marking the most significant year-on-year jump for the month in seven years.1 The latest round of data, which concludes the results for the calendar year, provides an opportunity to re-examine2 November sales over time.
November nipping at Santa’s heels
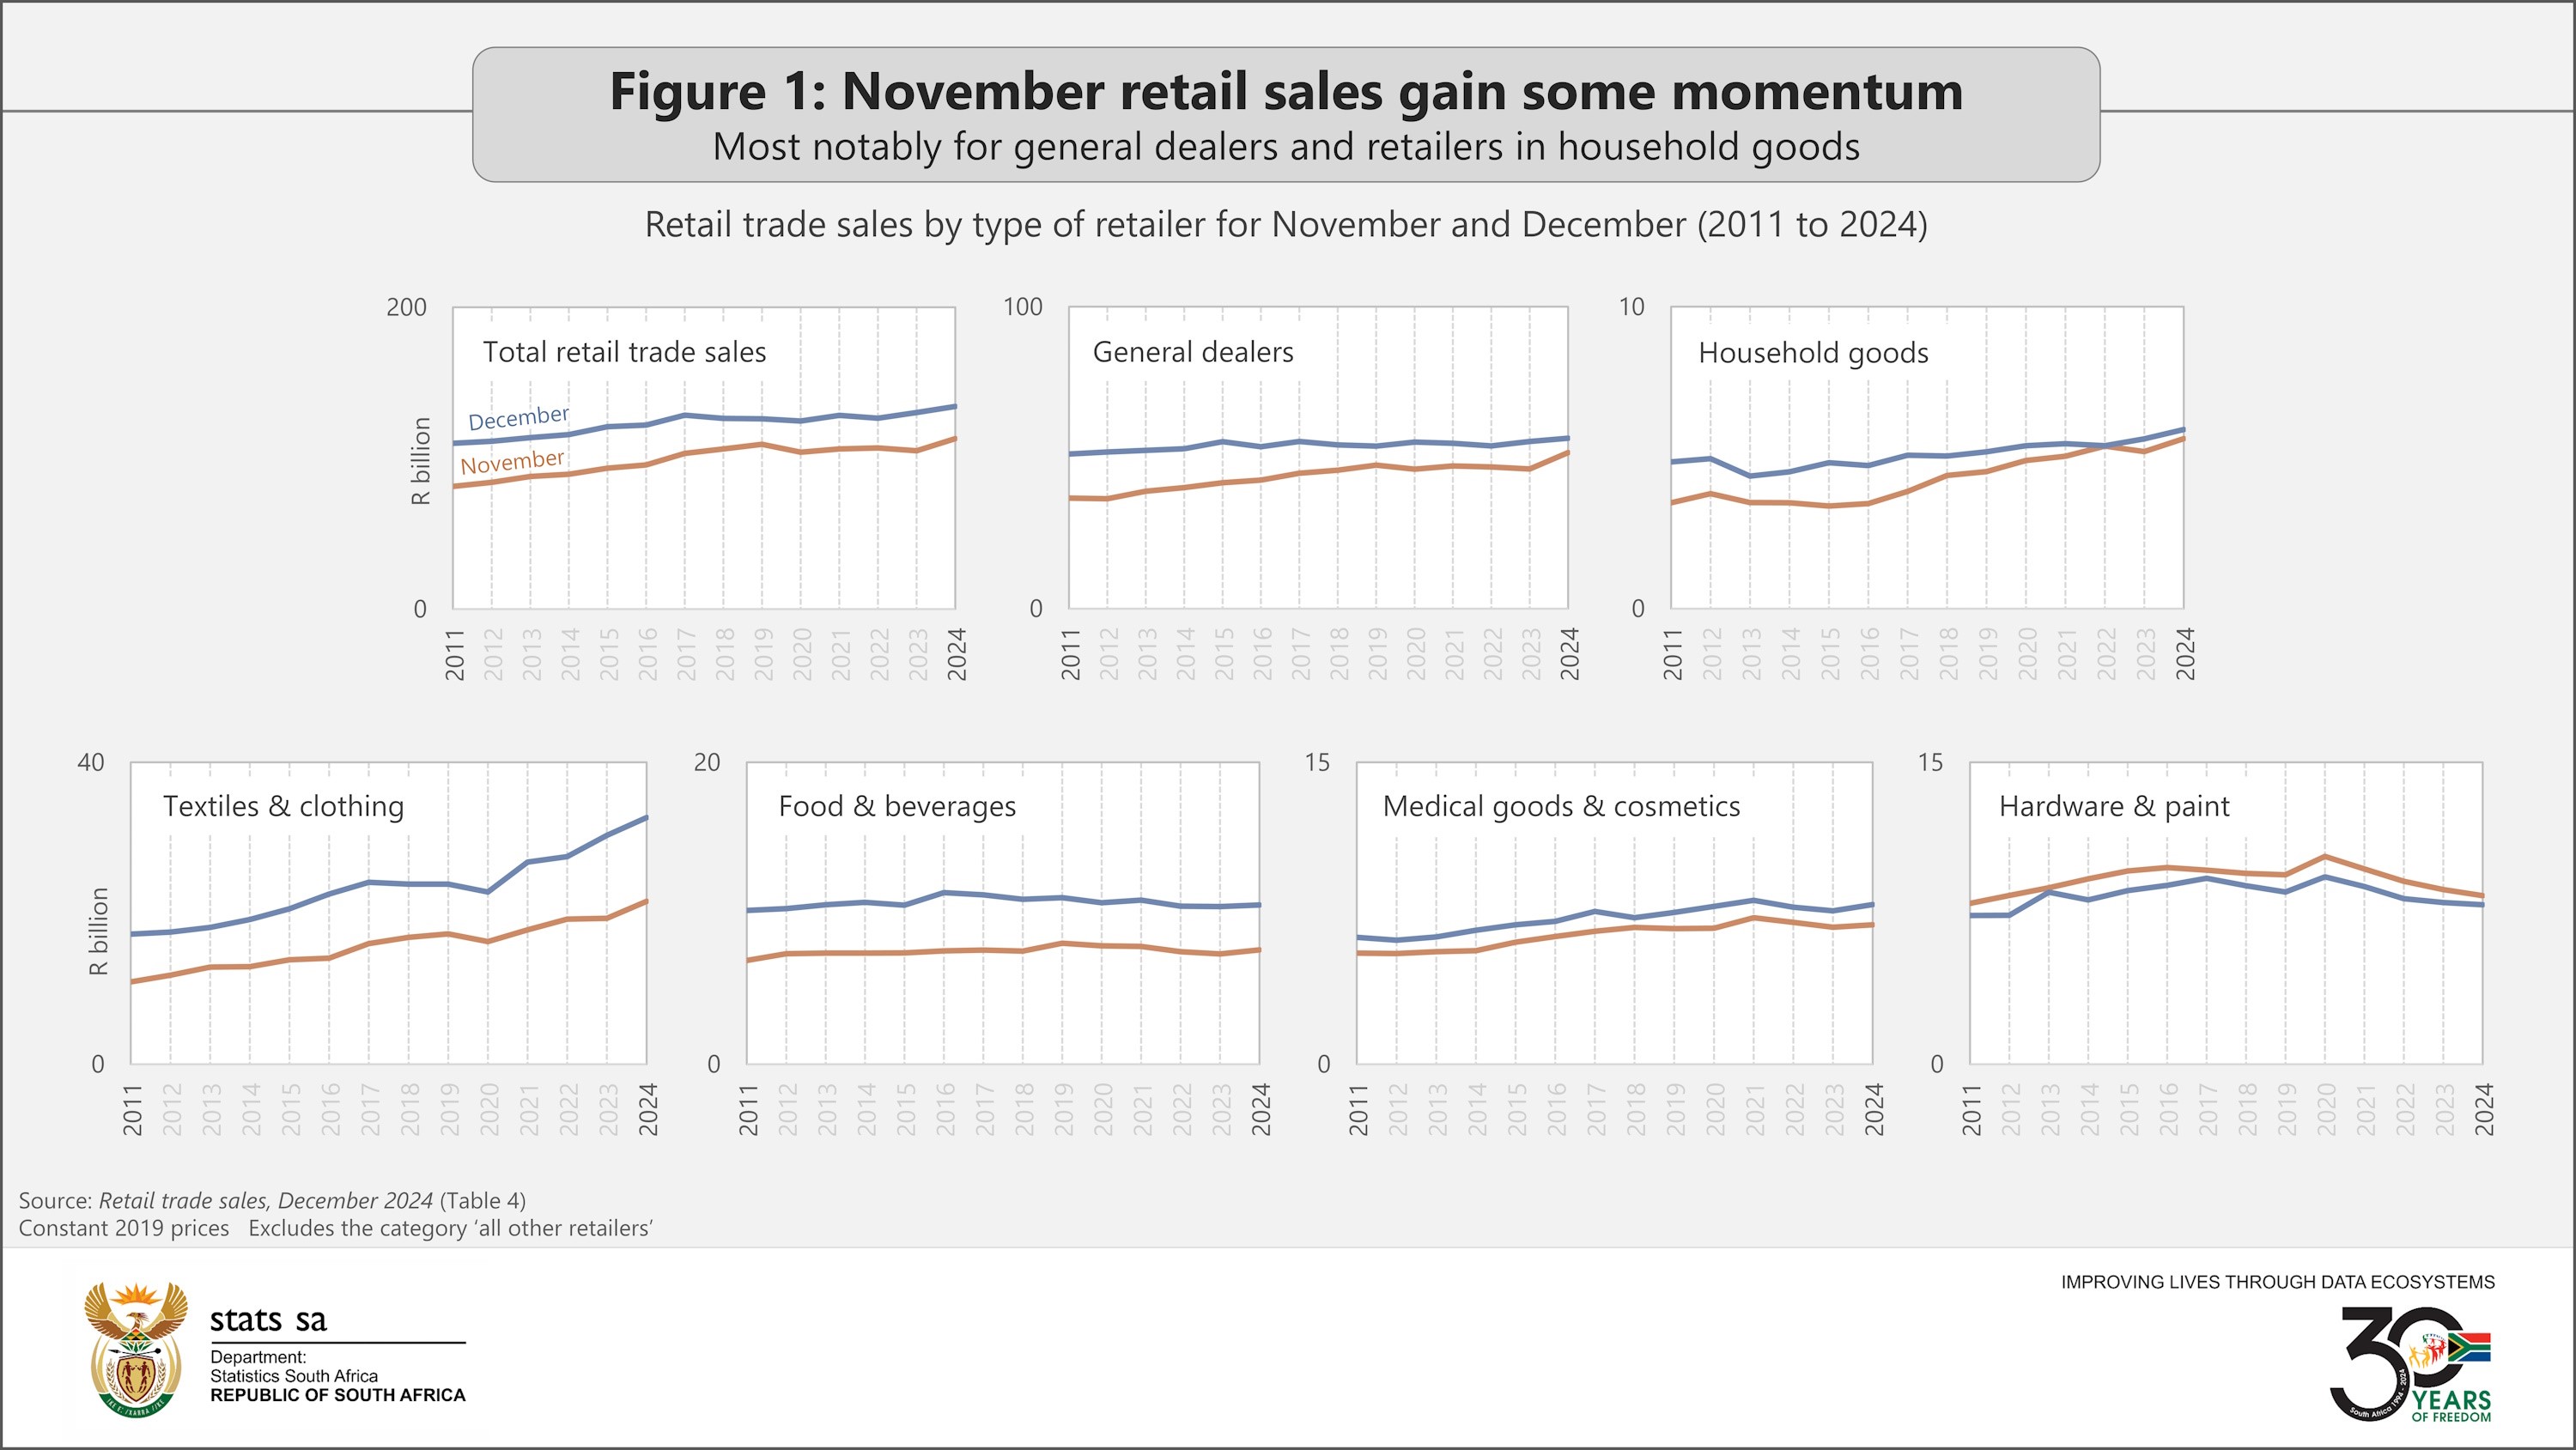
One can think of Black Friday as a competitor to the festive season. Most retailers record higher sales in December than in November (Figure 1). The exception is hardware & paint. Retailers specialising in the DIY market consistently see more activity in November. This has less to do with Black Friday than general consumer behaviour. During the festive season, consumers are more preoccupied with travel and family time than home improvement.
In South Africa, Black Friday first emerged in the online shopping space in 2012,3 with physical stores following suit over the next two years.4 The event fully took off in 2018, according to Standard Bank.5
Figure 1 illustrates how total retail trade sales for November and December rose in tune with one another up until 2017. In 2018 and 2019, November’s sales accelerated while December sales stagnated. November lost some steam from 2020 to 2023, but strengthened again in 2024.
The competition between November and December is most heated among general dealers (which includes supermarkets) and retailers specialising in household goods. November gained ground against December for both these retail groups in 2024. For household goods, November sales came within a hair’s breadth of equalling December sales in 2022. In the case of textiles & clothing, the December sales have comfortably outperformed November sales, with the gap expanding over recent years.
Pitting November against the rest of the year
Another way to gauge the strength of November sales is to measure its contribution to the annual total. A rise in November’s contribution over time indicates that it’s taking up more of the annual pie.
November sales accounted for 8,8% of the annual total in 2011 (Figure 2). After hovering in the 8,7%–9,0% range for a further five years, it edged higher in 2017, rising to a peak in 2020. After the height of the pandemic, November’s share waned for three years before rising again in 2024.
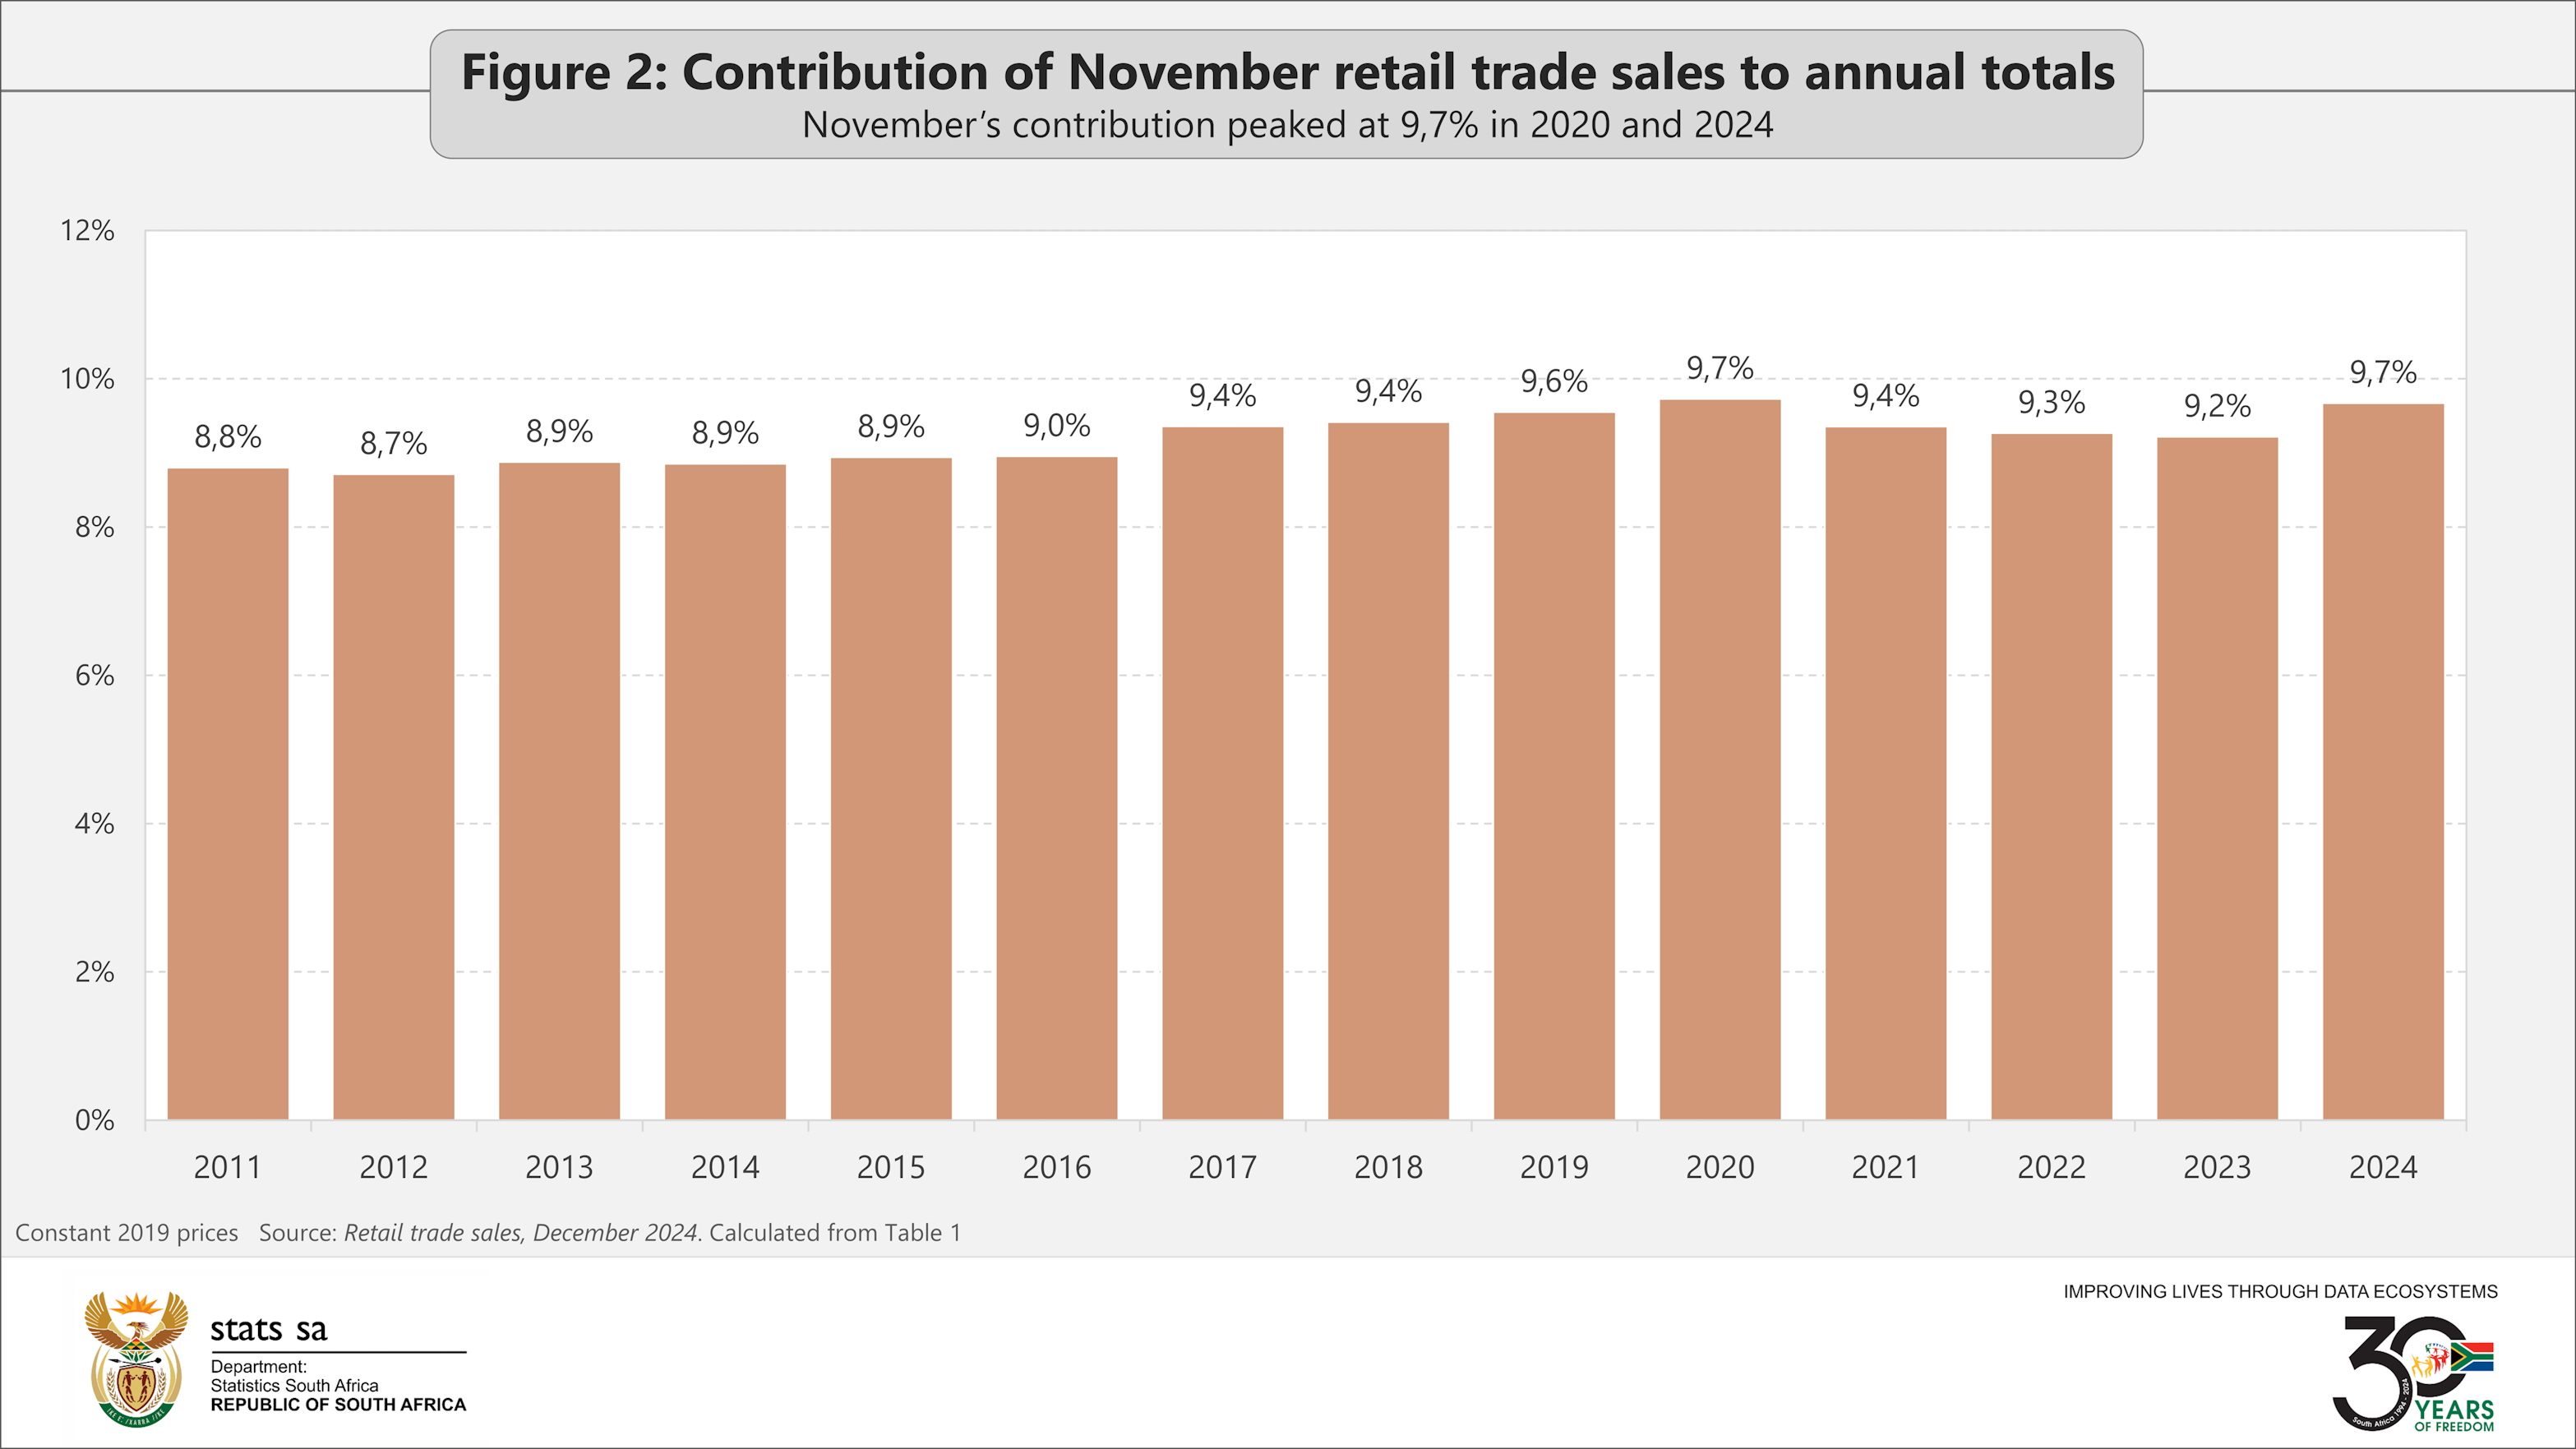
November’s contribution in 2020 may be misleading. In response to the pandemic, government initiated Level 5 lockdown from the end of March to the end of April that year. This constrained retail trade sales in April. The country progressively eased lockdown restrictions in the following months, with Level 4 initiated at the beginning of May, Level 3 at the beginning of June, Level 2 in August and Level 1 in September. The annual contributions for April, May, June and July were lower in 2020 compared with the ‘normal’ year of 2019, resulting in higher shares for other months, including November.
Shifts in consumer behaviour
Barring the pandemic, how does November square up against other months? The data points for 2011 and 2024 in Figure 2 are further expanded in Figure 3. February, March, May, June and November increased their respective contributions to annual sales, with November recording the biggest gain. January, April, July, September, October and December surrendered market share over this period. August recorded no change (click on the image to enlarge).
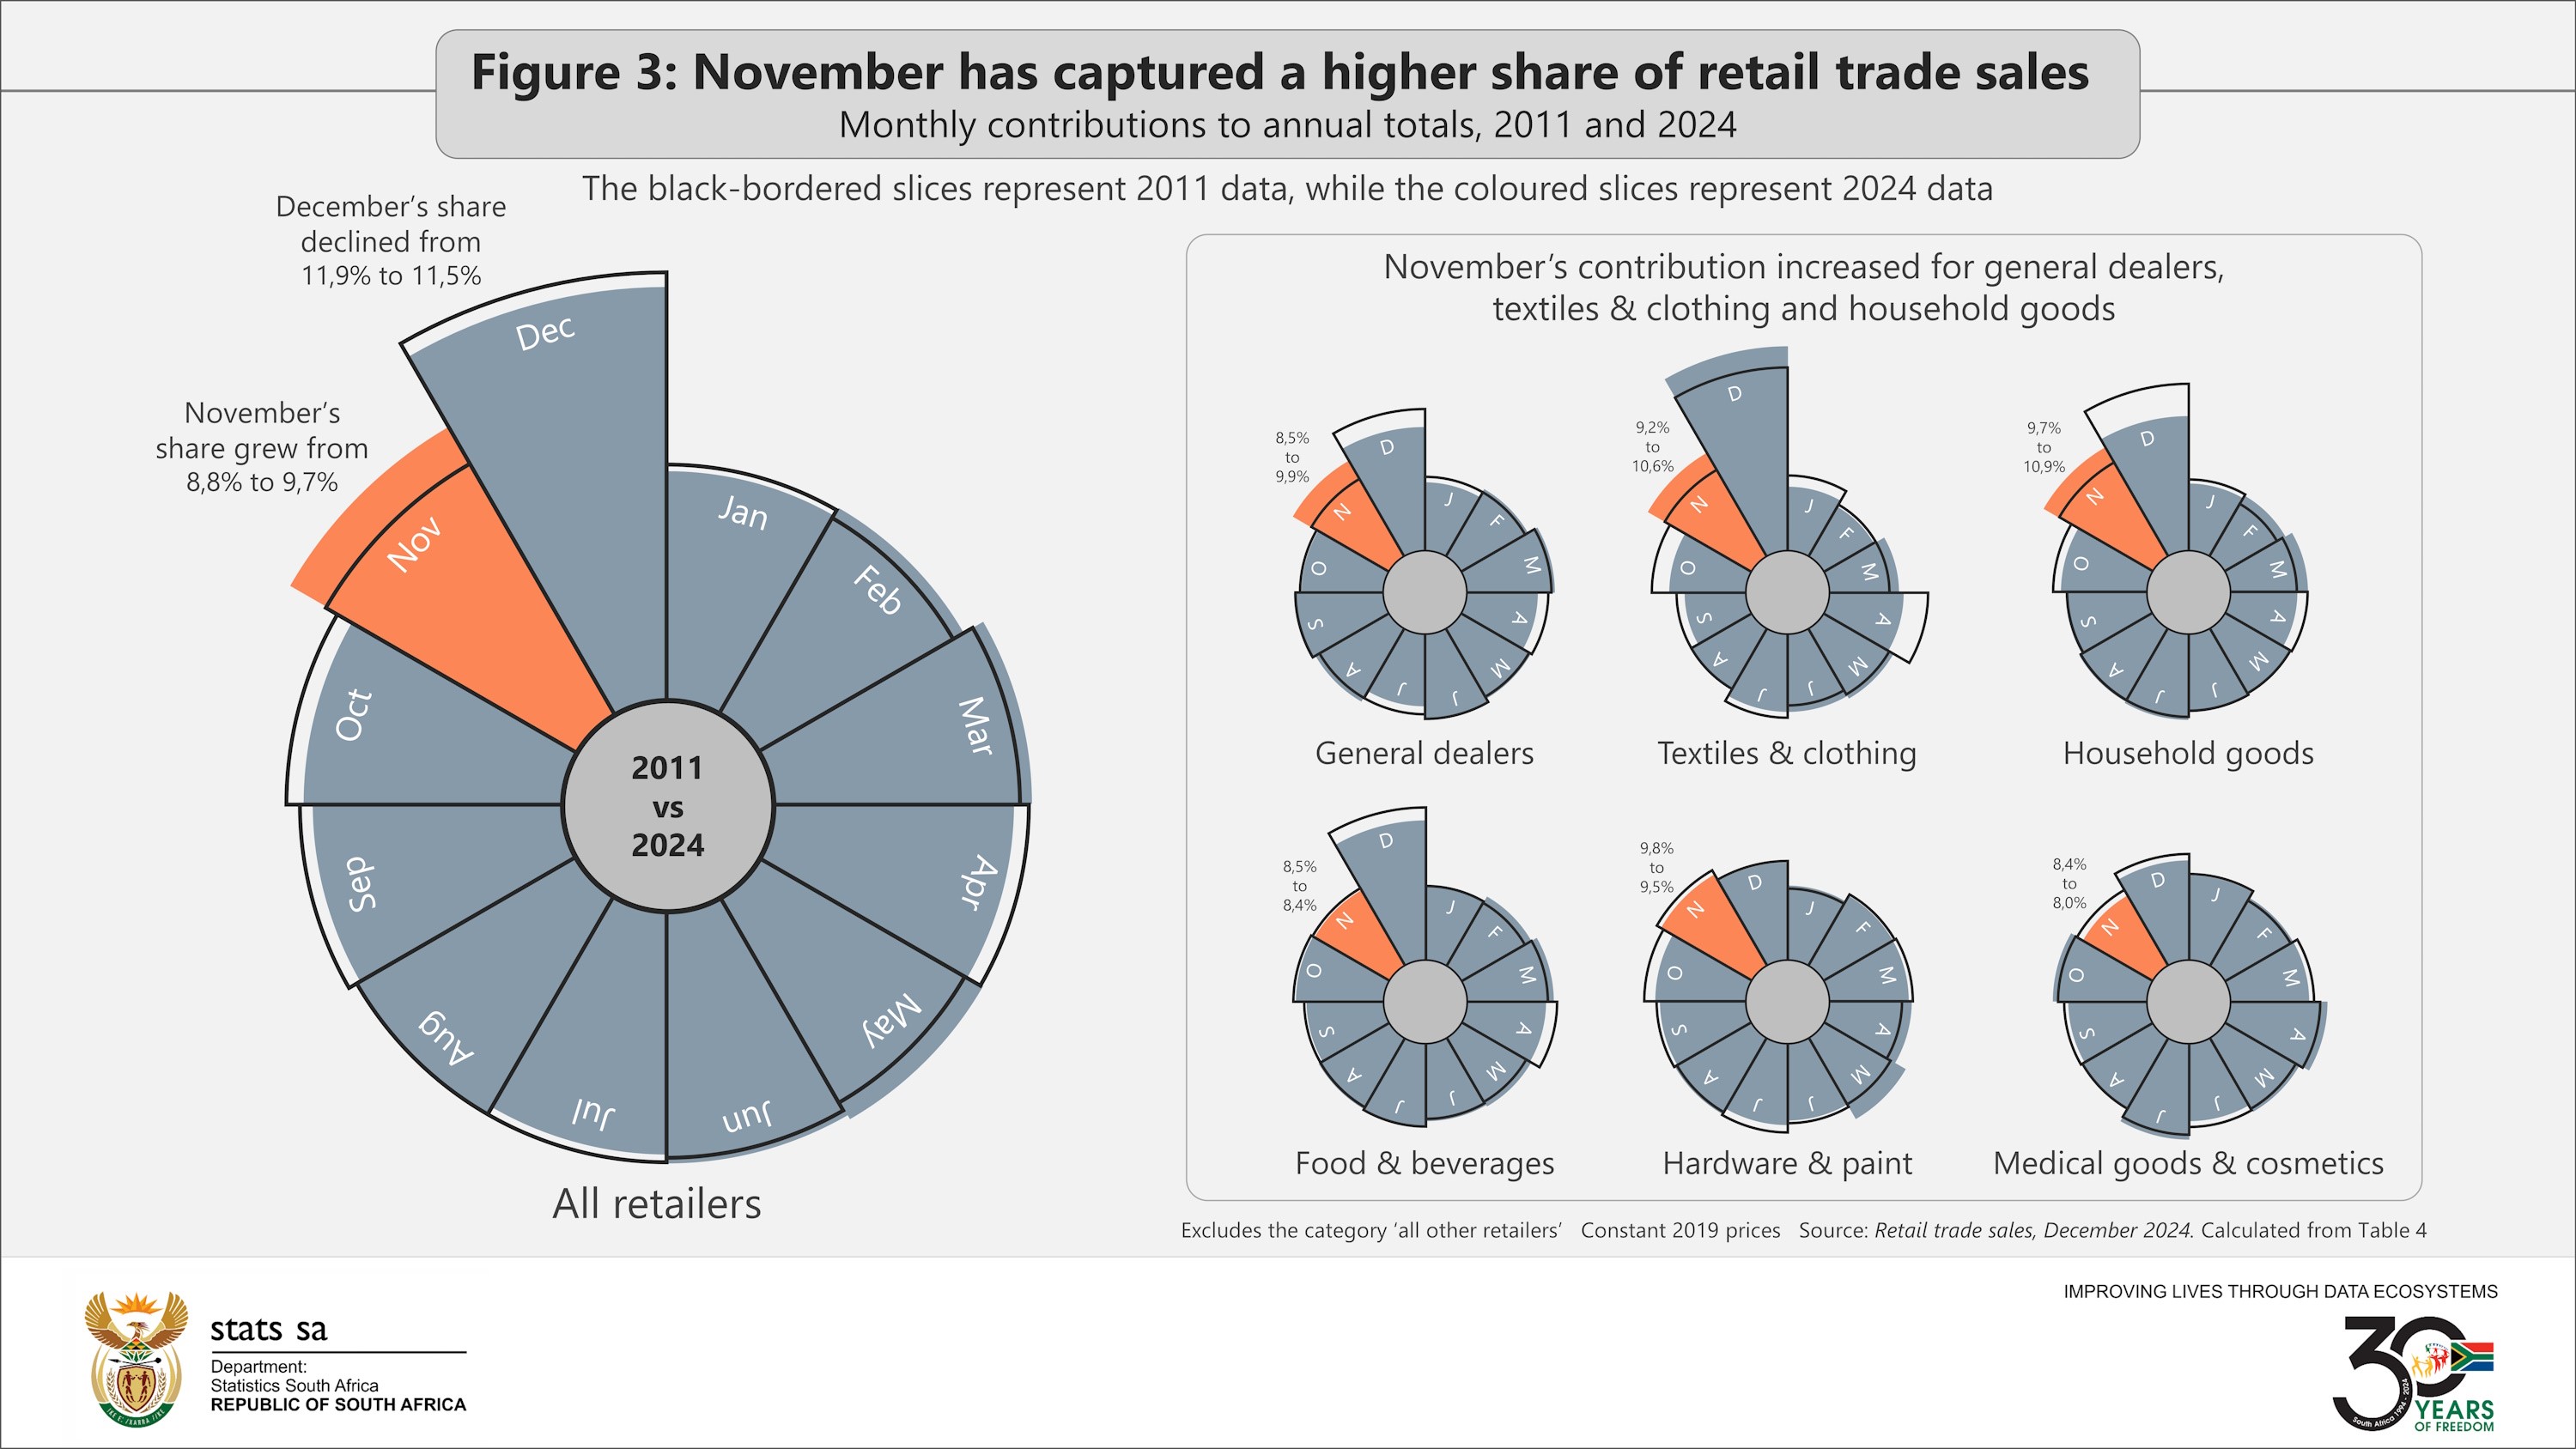
November’s contribution increased for general dealers, textiles & clothing and household goods. Food & beverages, hardware & paint and medical goods & cosmetics saw November’s influence weaken.
Textiles & clothing exhibits two interesting traits. First, this retail group experiences a very strong festive season. Second, November and December don’t seem to compete against one another for sales. Instead, both months increased their contributions in 2024 relative to 2011.
In a nutshell, what does the above analysis tell us? First, that Black Friday has a notable effect on sales related to general dealers and household goods. Second, Black Friday began to show itself in Stats SA’s retail trade data in 2017, reaching its peak of influence in 2019 (if we exclude the volatile year of 2020). After the pandemic, however, its effect has softened. The sharp increase in November 2024 may indicate a comeback, but only future data will confirm if this is the case.
For more information, download the December 2024 Retail trade sales release and associated Excel files here.
1 The data covered in this article are in constant 2019 prices.
2 Stats SA published a previous article on Black Friday in 2022 (read it here).
3 BusinessTech, Takealot.com prepares for record volumes for its annual Blue Dot Sale (read here).
4 Retailing Africa, The rise and rise of Black Friday in SA (read here).
5 Standard Bank, A decade of Black Friday: South Africans remain enthusiastic about the American shopping tradition (read here).
Similar articles are available on the Stats SA website and can be accessed here.
For a monthly overview of economic indicators and infographics, catch the latest edition of the Stats Biz newsletter here.