
Annual consumer inflation increased to 4,4% in August from 4,3% in July. Several aspects stand out in this month’s print. Food and non-alcoholic beverages (NAB) inflation quickened for the first time in nine months, both the alcoholic beverages & tobacco and health indices declined month-on-month, and fuel inflation continued to ease.
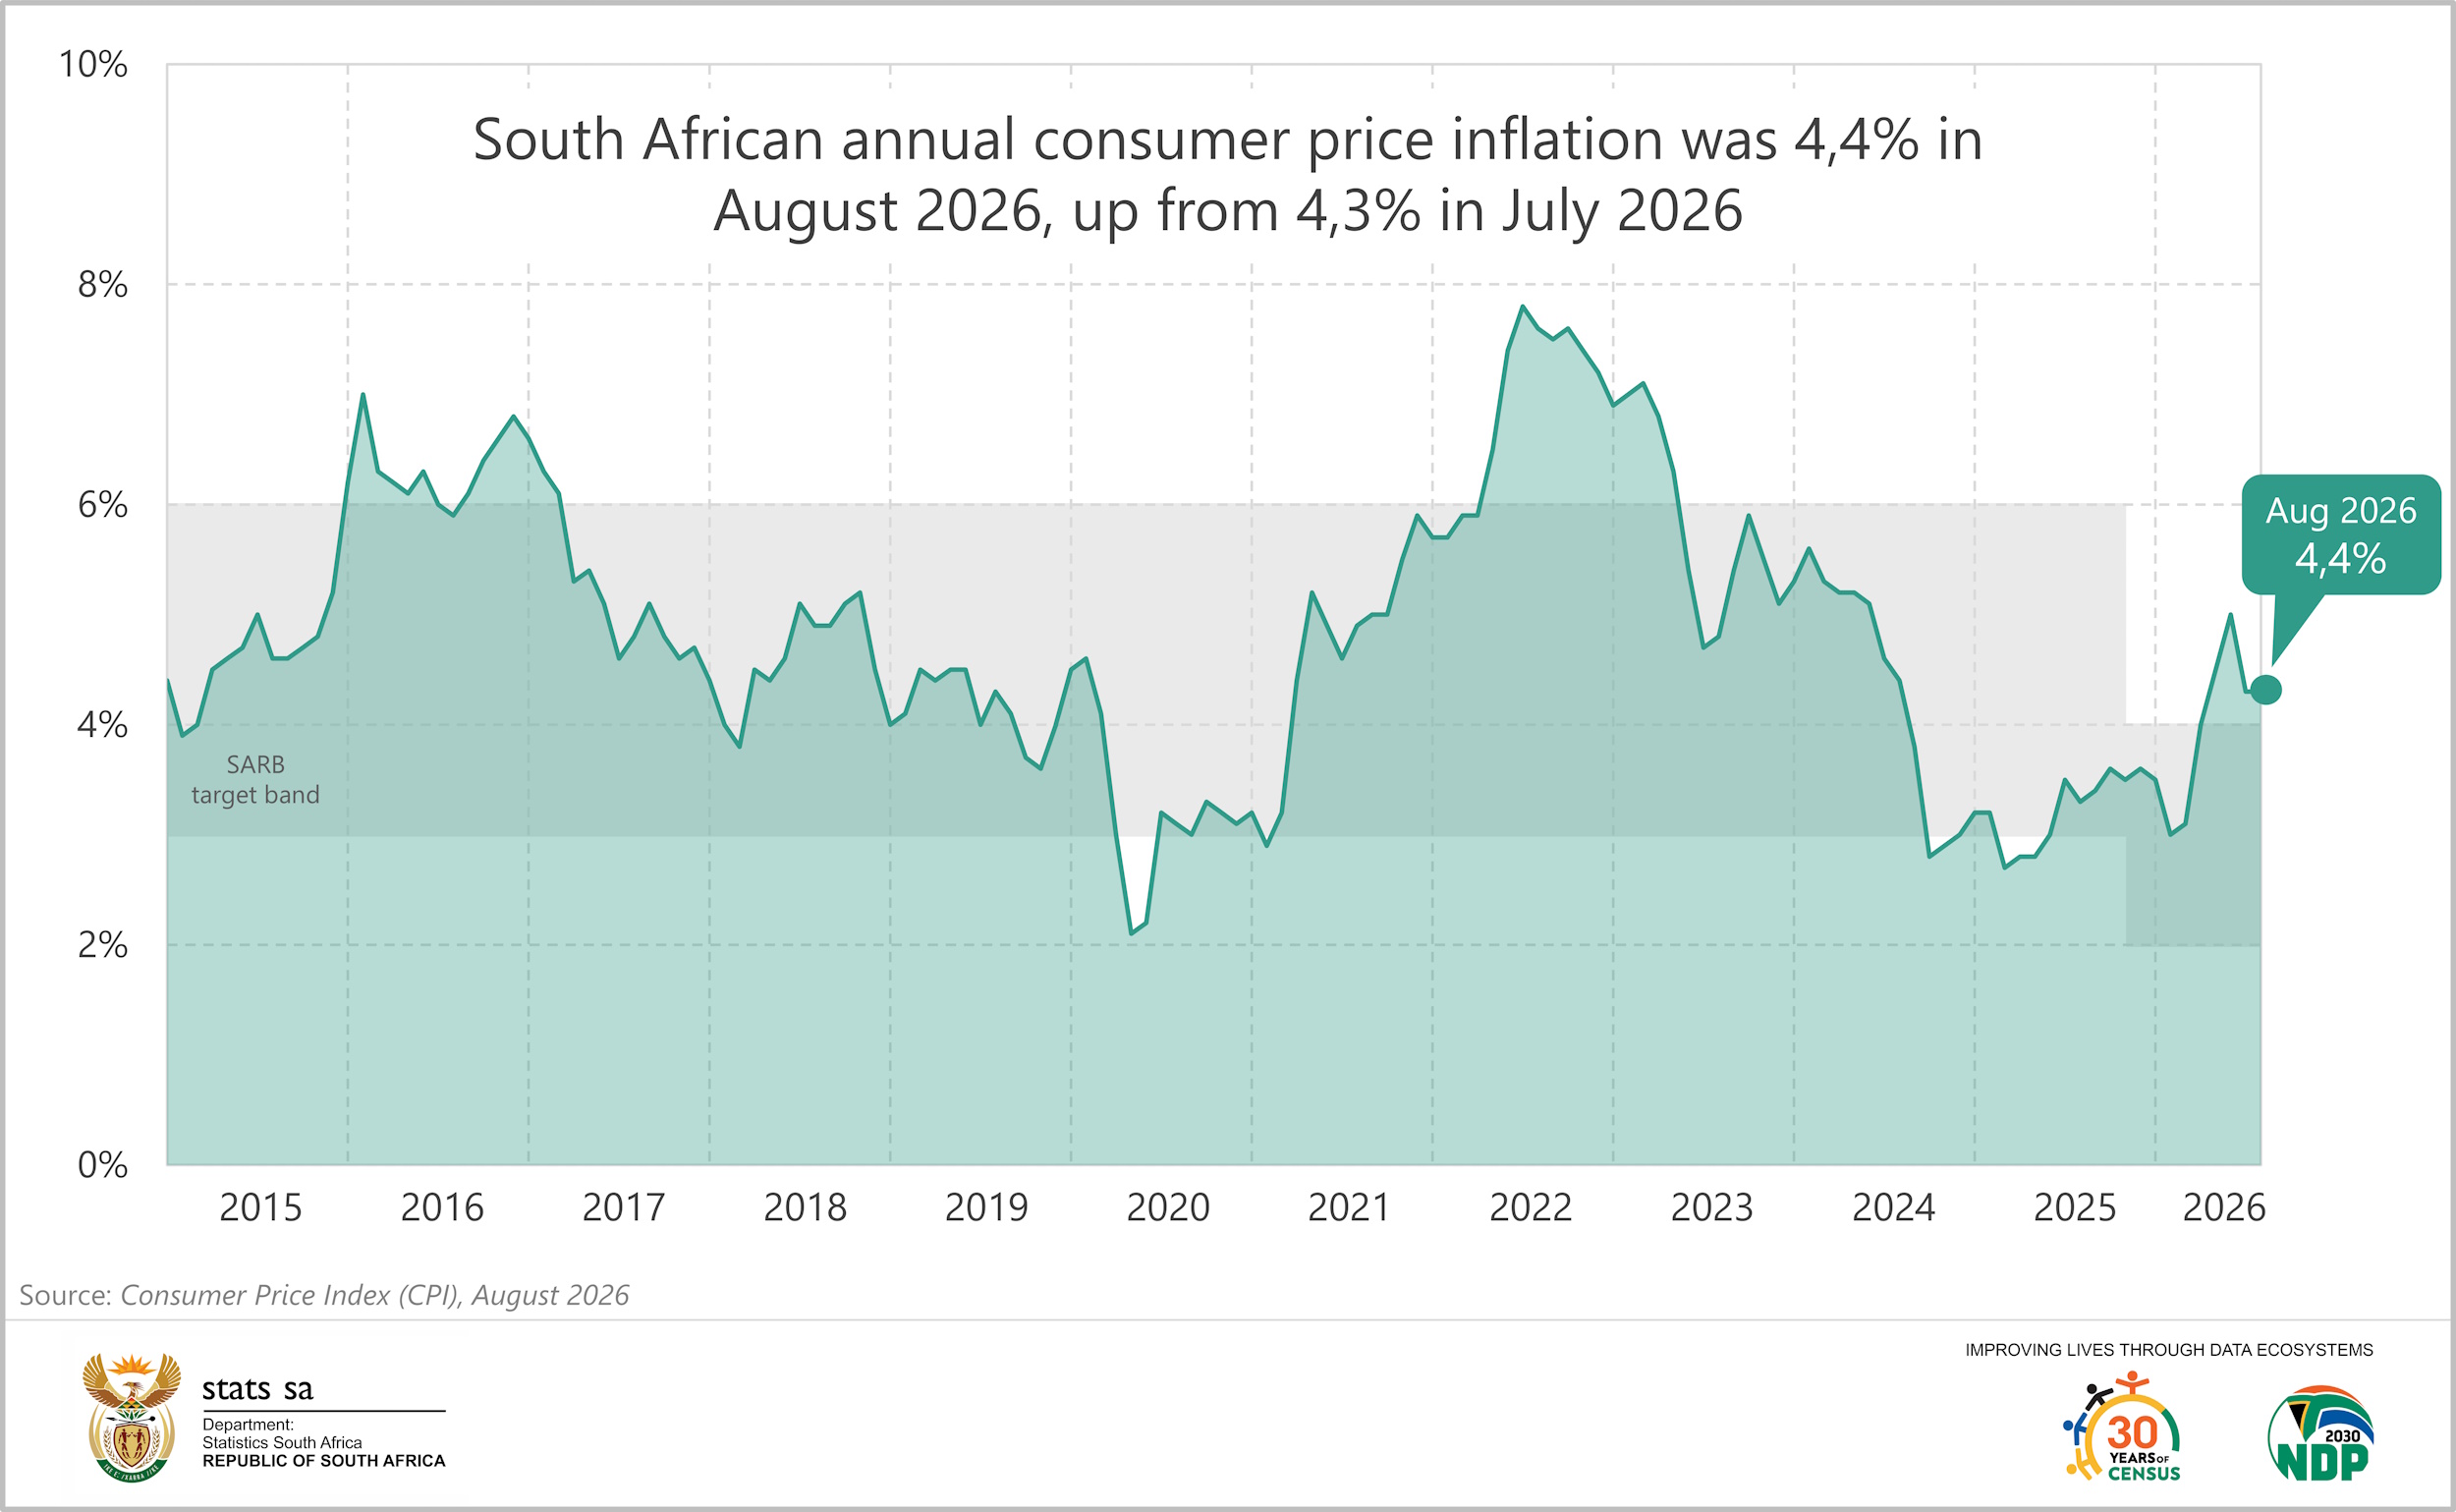
The consumer price index (CPI) showed no monthly change.
Food and NAB inflation breaks its eight-month downswing
Annual food & NAB inflation rose for the first time since November 2025, to 1,1% in August from 0,9% in July. Categories with higher annual rates included cereal products (from -2,0% in July to -1,9% in August); fish & other seafood (6,6% to 7,5%); milk, other dairy products & eggs (1,9% to 2,1%); fruits & nuts (-7,5% to -5,5%); vegetables (-2,5% to -0,6%) and cold beverages (4,4% to 4,5%).
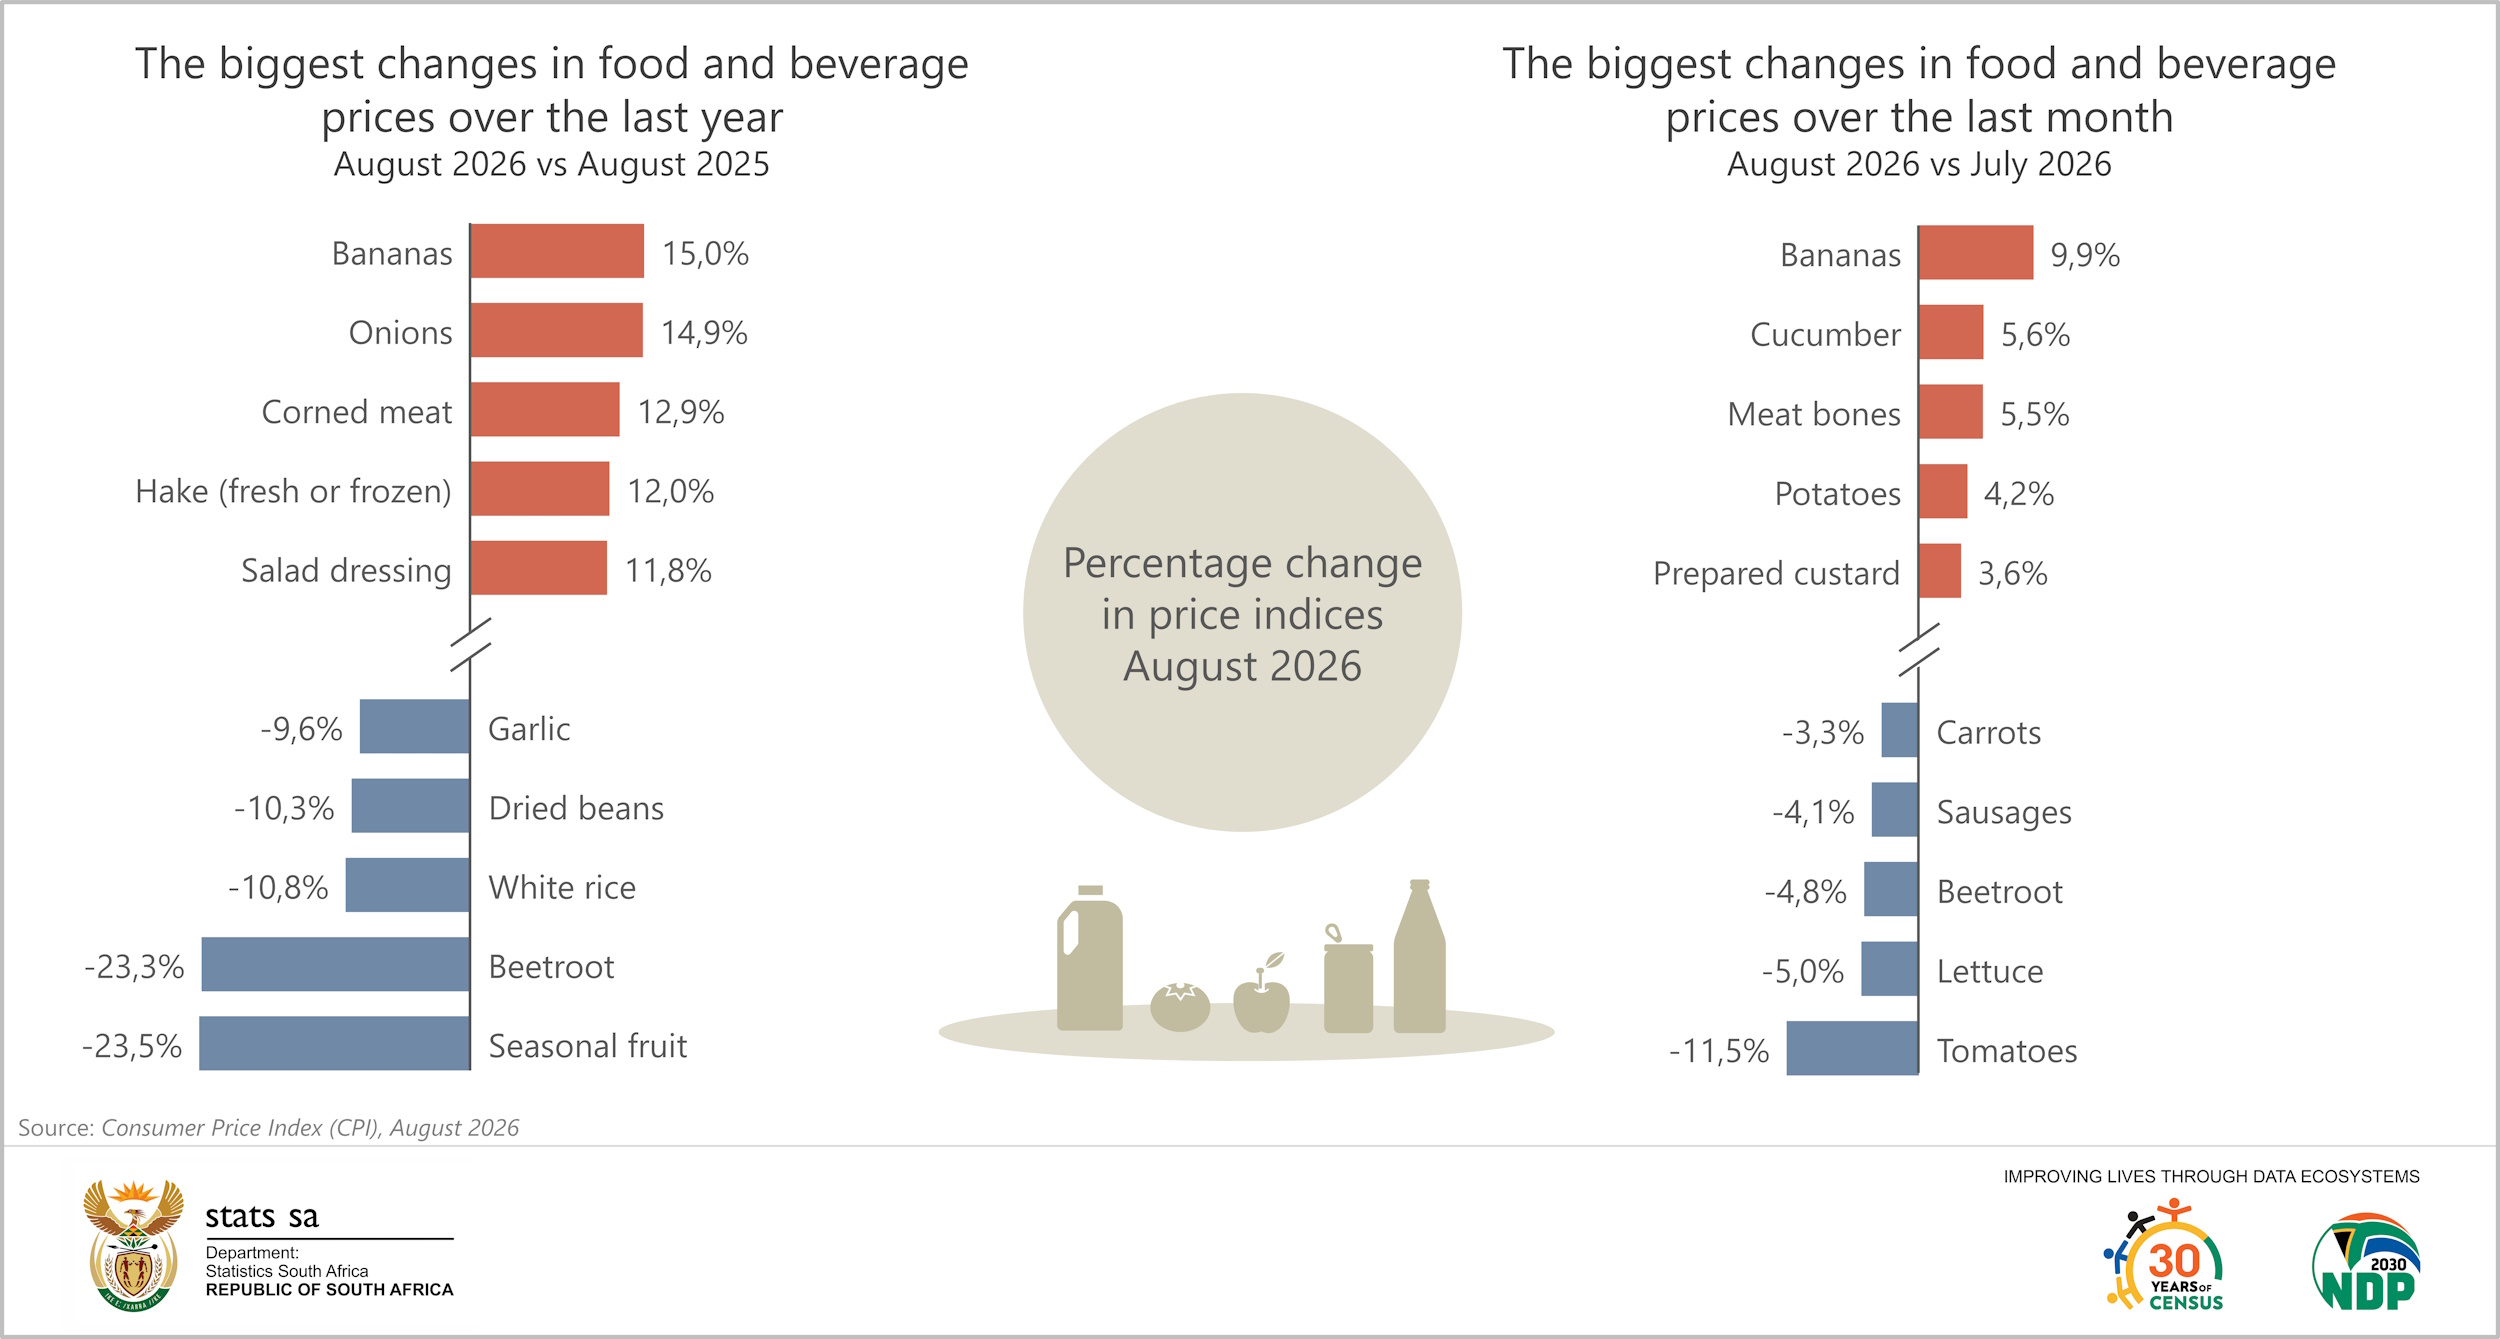
Eight of the 19 items in the cereal products category registered higher rates. Most notably, white rice (-11,6% to -10,8%) and white bread (3,2% to 3,9%).
Trends for meat were mixed, with pork prices continuing to climb while beef prices remained in deflationary territory. Ham and bacon rose by 8,6% and pork by 6,6% in the 12 months to August. In contrast, beef prices declined over the same period, with stewing beef 5,3%, steak 3,9% and mince 3,8% cheaper than a year ago.
Last month’s CPI overview noted sharp price increases for several fish products.1 The annual rate for the fish & other seafood category continued to accelerate in August, rising to 7,5% from 6,6% in July. Hake (fresh or frozen) is 12,0% more expensive than a year ago, while frozen fish fingers rose by 11,3% and battered or crumbed fish rose by 9,4%.
The price index for alcoholic beverages & tobacco eased by 0,1% month-on-month in August. Typically, this index only declines in December. The price index for spirits & liqueurs dipped by 0,4% and wine by 0,2%. The annual increase for the category was 3,6%, slightly down from July’s 3,7%.
The graph below shows those food and beverage products that recorded the largest price changes in August.
Other notable price changes
The health index edged lower by 0,1% between July and August, with decreases recorded for a range of medicines. These include painkillers (-0,2%), cough and other respiratory products (-0,3%), and vitamin and mineral supplements (-0,3%). Aggregate annual health inflation was 3,4% in August.
Annual transport inflation decreased to 8,8% from 8,9% recorded in July. This was mainly due to slower annual fuel inflation that eased to 20,0% in August from 20,6% in July. Petrol prices decreased by 2,0% between July and August. In contrast, diesel prices rose by 3,1%.
For more information, download the August 2026 CPI statistical release and associated Excel files with indices and average prices here.
1 Stats SA, Consumer inflation slows in July 2026 [19 August 2026] (read here).
Similar articles are available on the Stats SA website and can be accessed here.
For a monthly overview of economic indicators and infographics, catch the latest edition of the Stats Biz newsletter here.