
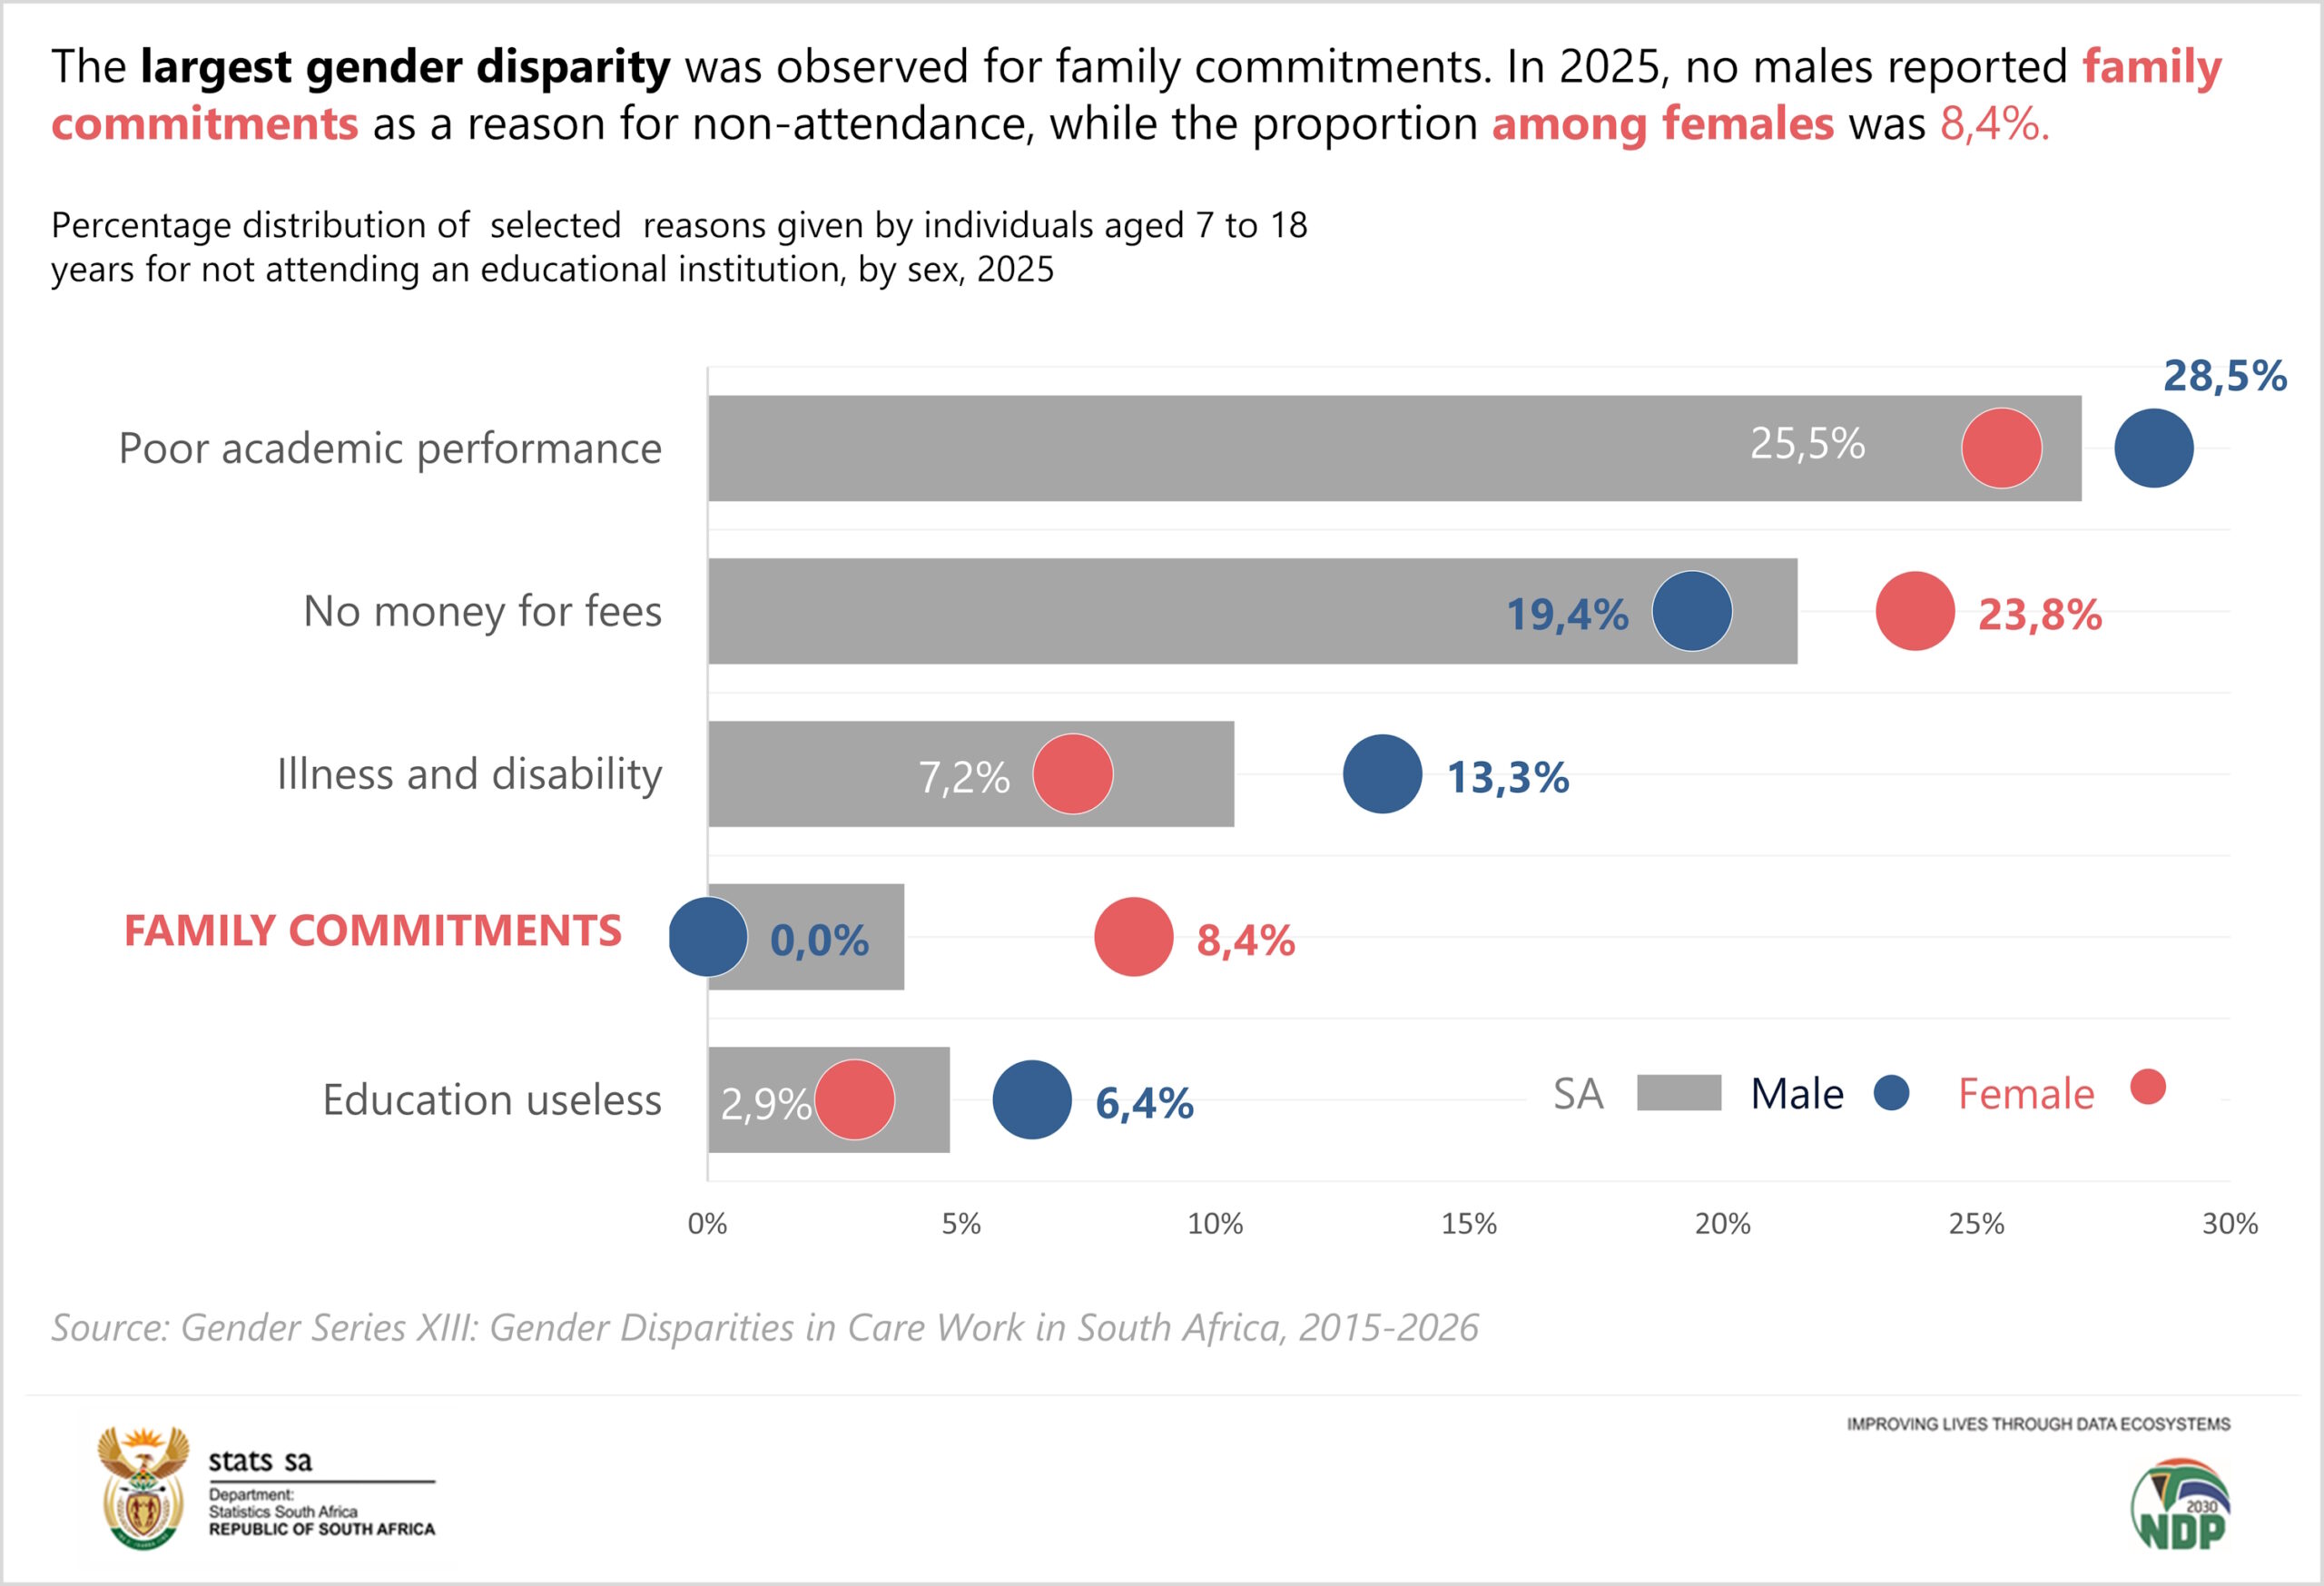
According to the latest report released by Statistics South Africa, Gender Series Volume XIII: Gender Disparities in Care Work in South Africa, 2026, gender differences are evident in the reasons people mention for not attending an educational institution.
Males were more likely to cite poor academic performance, while females were more likely to report family commitments. In 2025, Of those 7 – 18 not attending an educational institution 8,4% of females cited family commitments as the main reason for not attending an educational institution, compared with 0,0% of males.
Care activities include caring for children, supporting older relatives, preparing meals, and household maintenance. Much of this work is unpaid. Time-use data shows these tasks are performed predominantly by women.
Continuous care needed even with a changing population
South Africa’s changing population structure provides important context for understanding the care responsibilities carried by women. According to the 2026 Mid-year Population Estimates (MYPE), females accounted for a larger share of the population than males between 2015 and 2026. In 2026, females made up 50,9% of the population, compared with 49,1% for males.
The need for care is evident in different stages of life. While the working-age population (15–64 years) increased from 65,4% in 2015 to 67,2% in 2026, the proportion of children 0–14 years declined from 28,7% to 25,6%, while persons aged 65 and older increased from 5,9% to 7,3%. The working-age share of the population rose while the child share fell, and the 65+ share rose.
The dependency ratios further illustrates the potential care demands facing households. The child dependency ratio declined from 45,4 in 2015 to 41,1 in 2025, meaning there were fewer children relative to the working-age population. In contrast, the old-age dependency ratio increased from 7,9 to 9,1, pointing to a growing need to support older persons. Both ratios were higher in non-urban areas than in urban areas in both years. These ratios do not indicate who provides care within households.
These responsibilities are also reflected in household structures. Female-headed households increased from 41,3% in 2015 to 42,6% in 2025 and were more likely than male-headed households to have no employed member. Among female-headed households, the proportion with no employed member increased from 38,7% in 2015 to 39,1% in 2025, compared with an increase from 19,9% to 23,5% among male-headed households.
Care responsibilities and participation in the labour market
The demands of care are also reflected in South Africa’s labour market. Males consistently reported higher labour force participation rates (LFPR), although the gap narrowed slightly over the reported period.
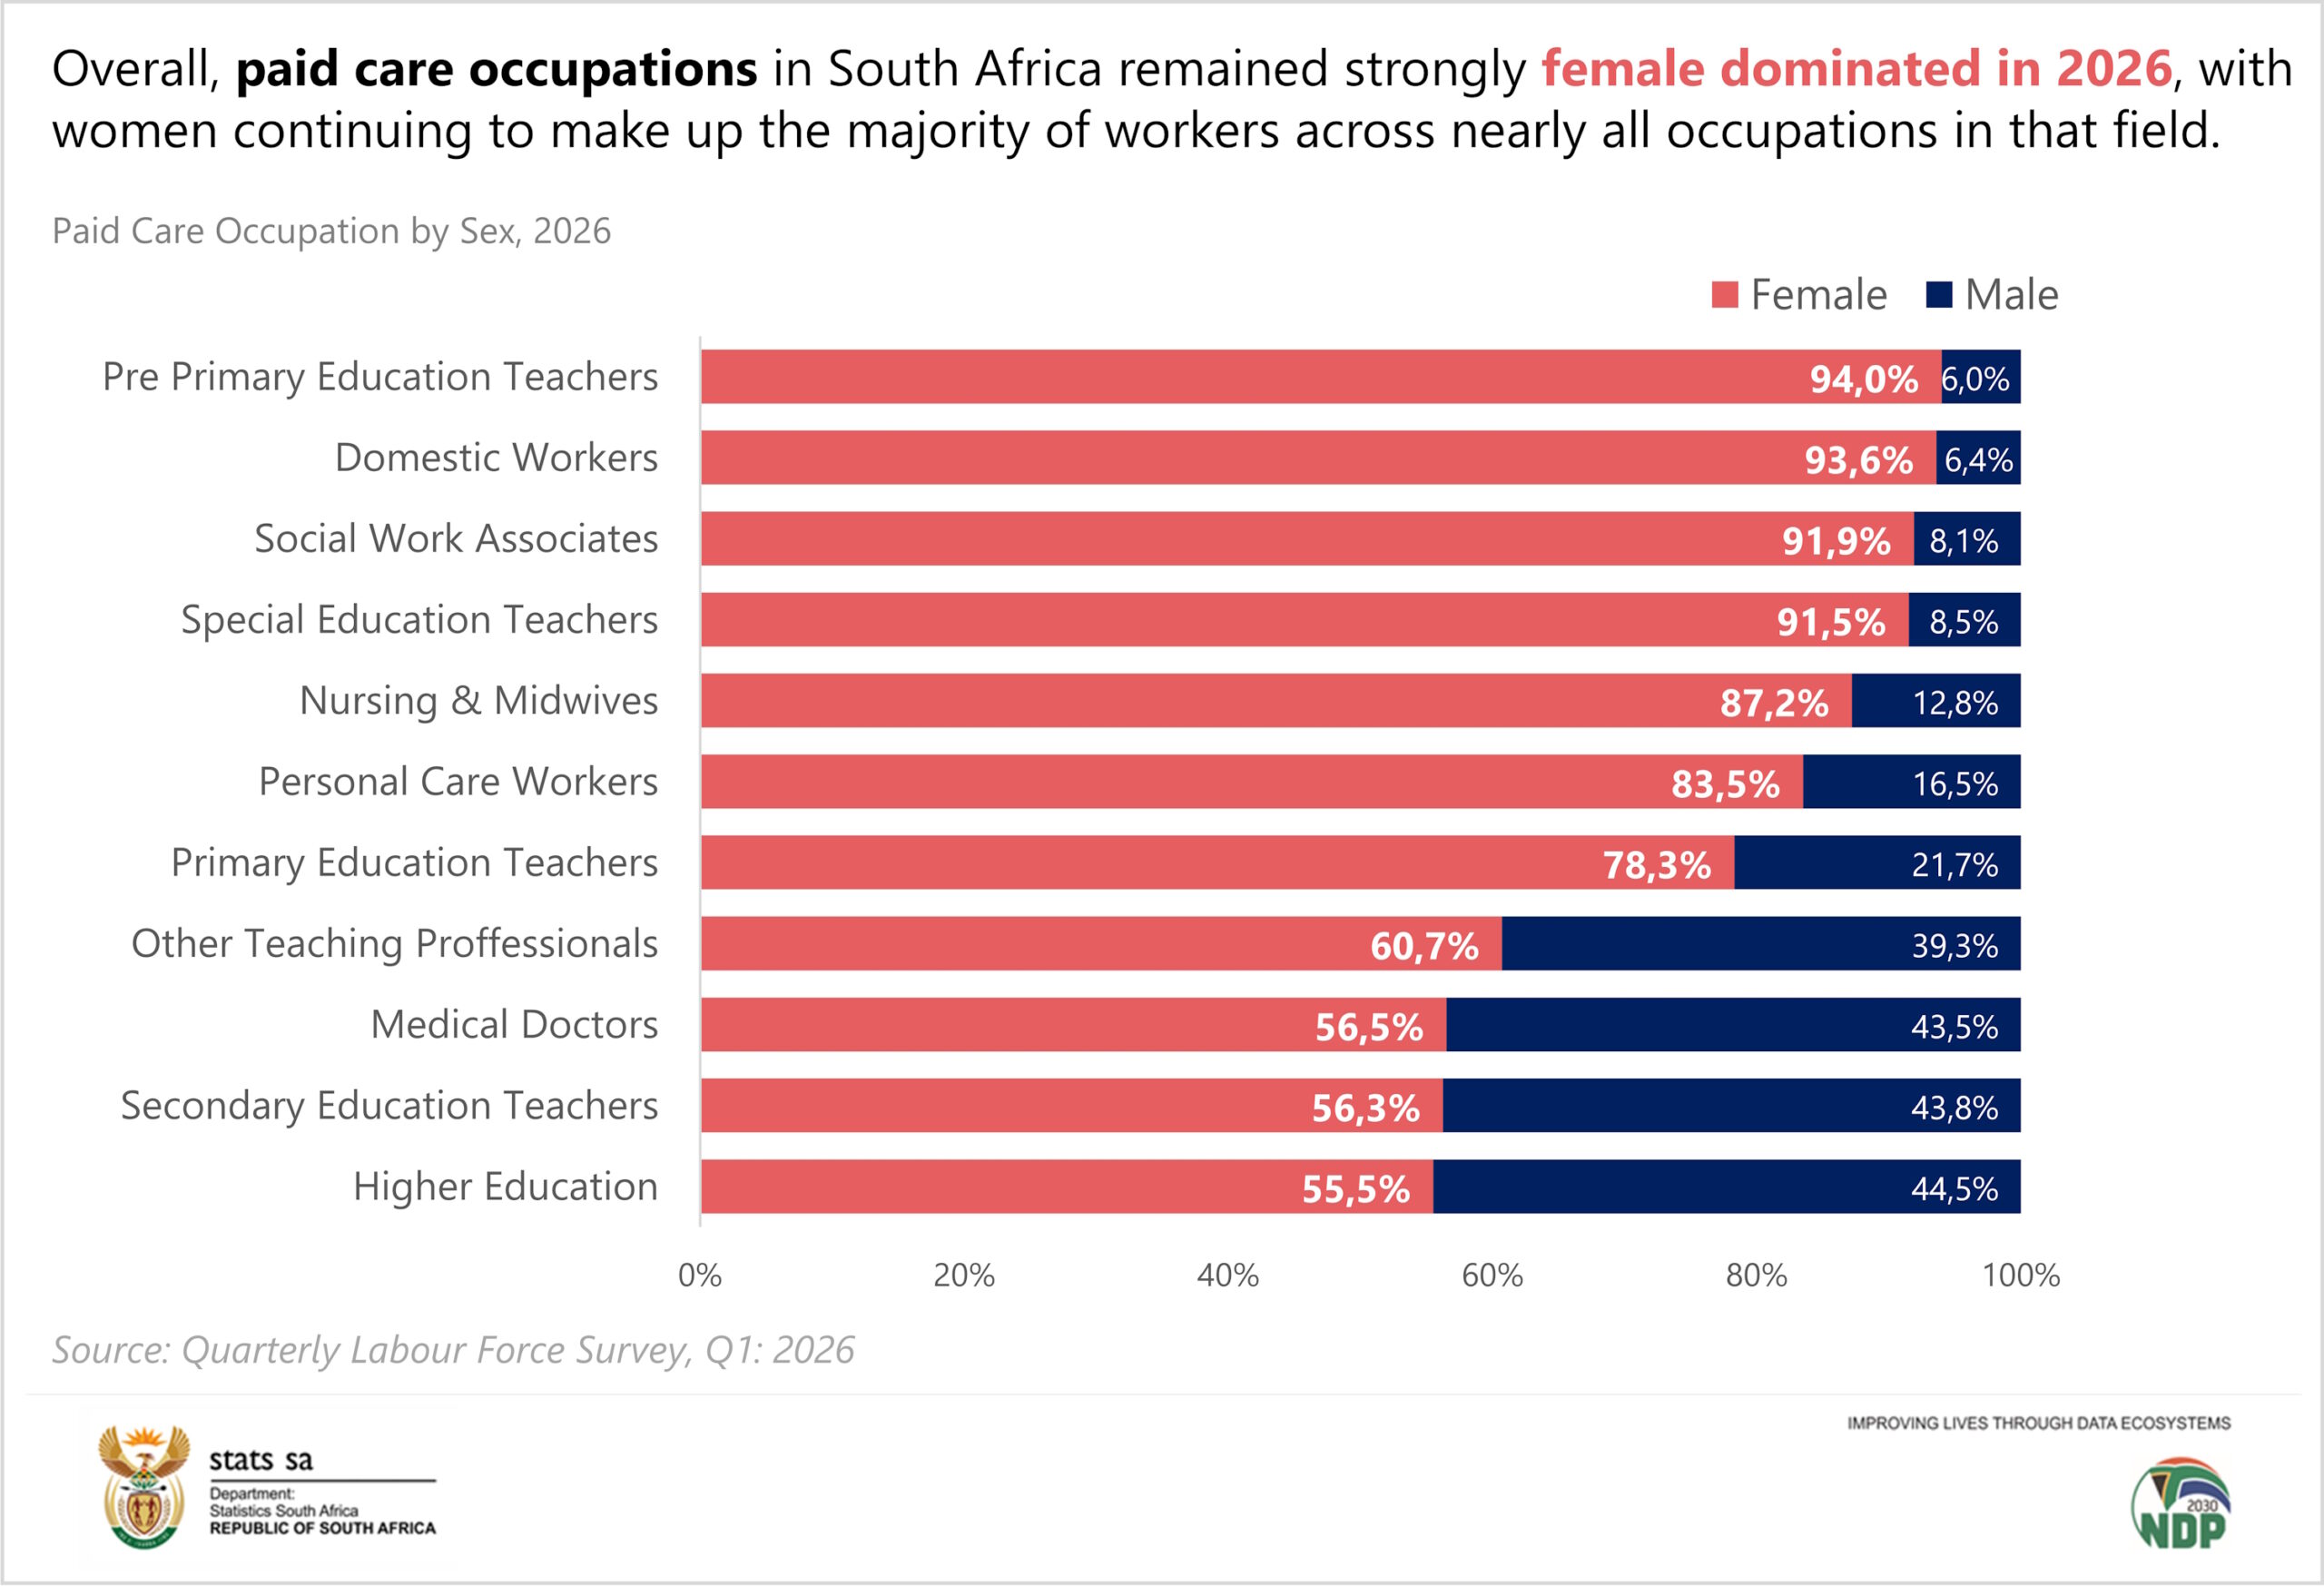
Gender differences were particularly evident in the types of occupations and industries in which people worked. Females dominated most care-related occupations, including domestic work, nursing, teaching and social work, in both 2015 and 2026. Females also dominated employment in private households and in communication, social and personal services. Employment in paid care was also predominantly female.
By contrast, construction, mining, transport and manufacturing remained male dominated,
The differences also extended to earnings. Median monthly earnings increased between 2018 and 2024, rising by R1 500 for males and R1 400 for females. However, the gap in earnings was more pronounced in the mining and quarrying, transport and communication industries.
Occupational and industry segregation by sex was observed alongside these employment patterns.
The economic cost of care
Financial demands of care are closely linked to women’s roles within households. Salaries remained the main source of household income across household types, provinces and geographic areas, while social grants were the second most common source. In Eastern Cape and Limpopo, a higher proportion of households relied on social grants as their main source of income. The cost of caring for children is also evident in household spending: average expenditure on pre-primary education increased from R7 785 in 2015 to R8 069 in 2023, reaching R14 677 in Western Cape and R11 172 in Limpopo.
Everyday day work which keeps a household running.
Care work is not only limited to looking after children or older persons. Everyday household tasks such as cooking, cleaning, collecting water and maintaining a healthy living environment also consume time and labour. When infrastructure is inadequate, these responsibilities can become particularly burdensome.
Access to safe drinking water and sanitation is essential for improving nutrition, preventing diseases and enabling a healthy living environment. Households were more likely to access water through piped water inside the dwelling or in the yard. The share of households dependent on public or communal taps for water declined from 13,9% in 2015 to 8,6% in 2025, a decline of 5,3 percentage points over the period.
Gender differences were also evident in the collection of water. Approximately 3,1% of female-headed households fetched water from the stream/river in 2015, compared with 1,7% of male-headed households. About 79,6% of male-headed households spent less than 30 minutes fetching water, while 69,8% of female-headed households spent the same amount of time.
The energy used for everyday household tasks showed fewer gender differences. Electricity was the main source of energy for cooking regardless of the sex of the household head, province or geographic location. Mpumalanga was the leading province for households using coal for cooking in both years.
Data are drawn from Statistics South Africa’s Gender Series Volume XIII (2026) and the 2026 Mid-year Population Estimates.
For more information, download the full report here.