As South Africa celebrates 30 years of constitutional democracy and census-taking, Census data provide a unique lens through which to assess the progress made by women, showcasing important gains in education, employment, and leadership between 1996 and 2022.
Since 1996, South Africa has made significant strides in improving their lives and opportunities. Supported by the Constitution’s commitment to equality and human rights, women have played an increasingly important role in the country’s development, contributing to labour markets, education, and household leadership. Over the period 1996–2022, progress in equalisation of rights has been reflected in rising educational attainment, increased participation in professional sectors, and greater visibility in leadership roles. While challenges such as higher unemployment rates compared to men remain, women’s resilience and achievements have made a significant contribution to shaping South Africa’s democratic and developmental trajectory.
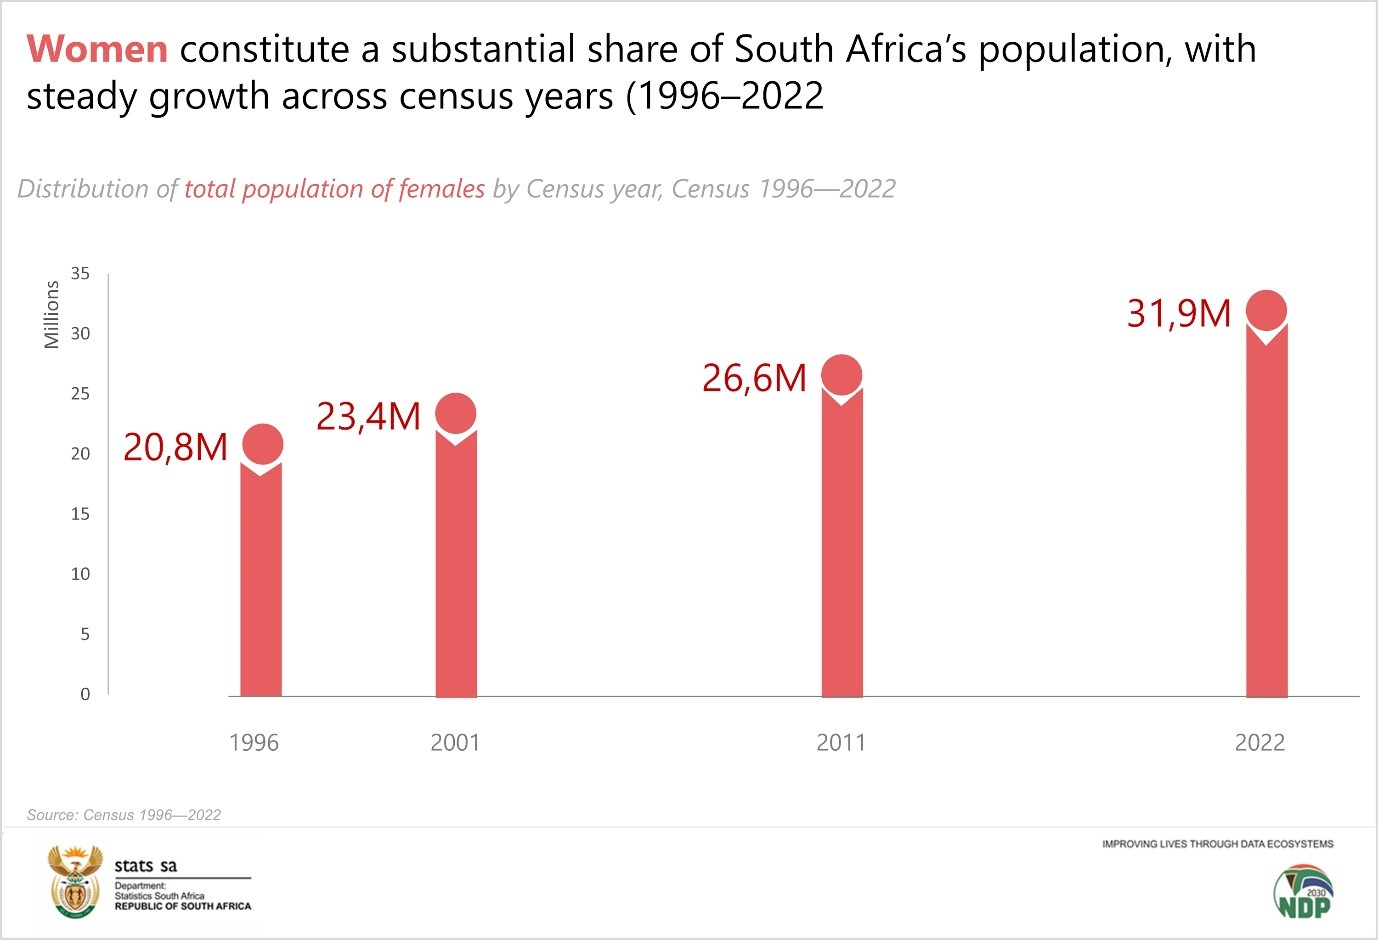
Figure 1.1: Distribution of total population of females by Census year, Census 1996—2022
Source: Census 1996—2022, MYPE 2026
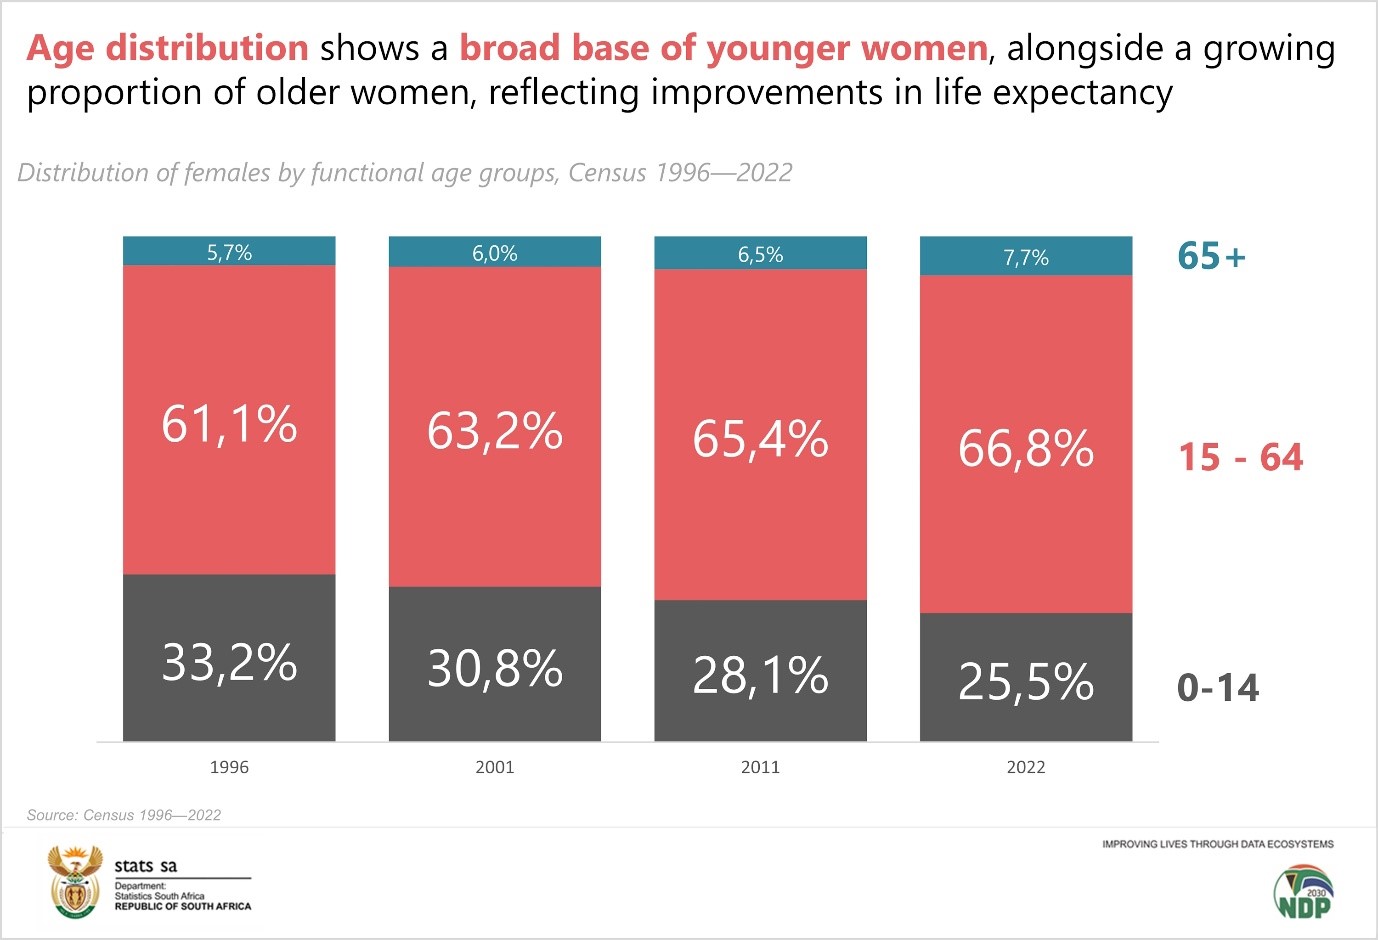
Figures 1.1 and 1.2 show how the number and age distribution of women in South Africa have changed over time. Women make up a large share of South Africa’s population, and their number have grown steadily across census years (1996–2022). Age distribution shows a broad base of younger women, alongside a growing proportion of older women, reflecting improvements in life expectancy. The data also show that a growing proportion of women are in the working-age group (15 to 64 years). This highlights the important role women play in the economy, the labour market, and the overall development of South Africa
Figure 1.2: Distribution of females by functional age groups, Census 1996—2022
Source: Census 1996—2022
Women and marital status
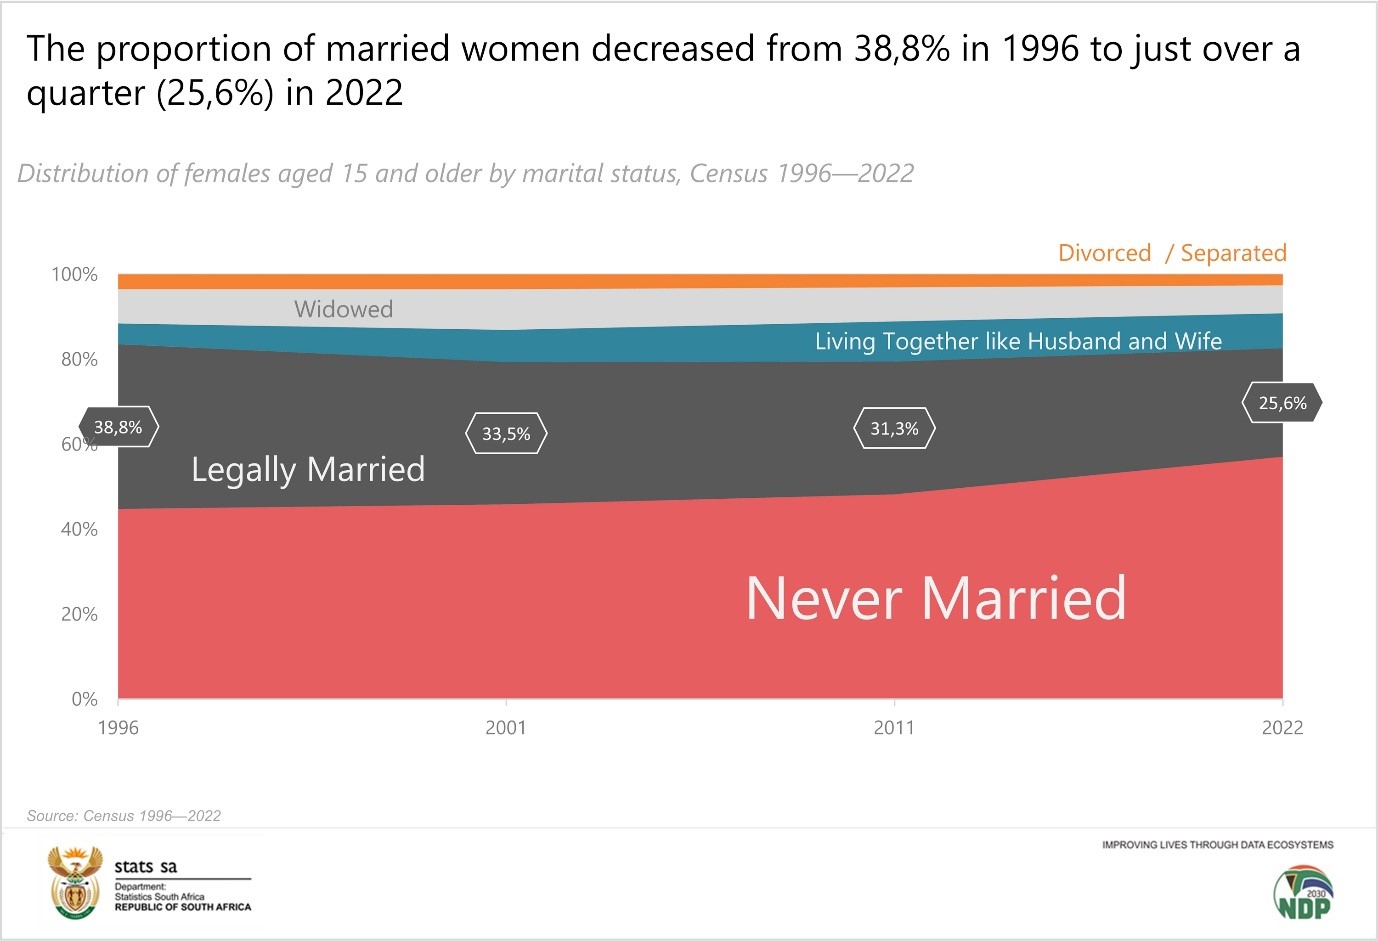
Figure 1.3 shows the marital status of women aged 15 and older from 1996 to 2022. The share of women who had never married went up from 44.7% in 1996 to 57.1% in 2022. During the same time, the percentage of married women dropped from 38.8% to 25.6%. More women were in cohabiting relationships, rising from 4.9% to 8.2%, while the share of women who were divorced or separated fell from 3.5% to 2.6%.
Figure 1.3: Distribution of females aged 15 and older by marital status, Census 1996—2022
Source: Census 1996—2022
Woman and education
Over the past three decades, South Africa has made significant progress in improving women’s access to education. From 1996 to 2022, school attendance among young women increased steadily, reflecting both expanded access to schooling and the country’s commitment to equalising rights. This progress has not only narrowed gender disparities but also positioned women as key drivers of socio-economic development, with more females completing secondary education and advancing into higher education than ever before.
Educational attainment and attendance
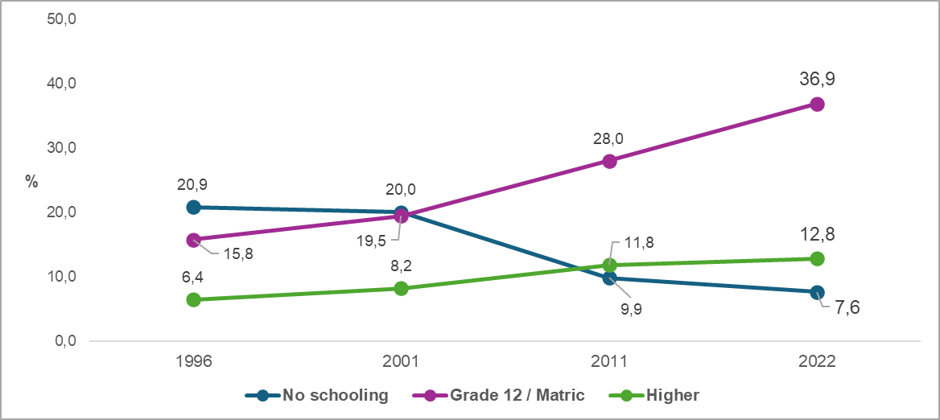
Figure 2.1 shows that women have made significant progress in education over the past three decades. The percentage of women who completed matric/grade 12 increased from 15,8% in 1996 to almost 40% in 2022. Over the same period, the proportion of women who completed a post-matric qualification doubled, rising from 6,4% to 12,8%. At the same time, the percentage of women with no formal schooling significantly decreased from 20,9% to 7,6%
School attendance among females aged 15 to 24 also improved, increasing from 67,9% in 1996 to 73,6% in 2022. This growth reflects expanded access to education and ongoing efforts to promote equal opportunities. These gains have helped reduce gender disparities in education and positioned women as key drivers of socio-economic development.
Figure 2.1: Distribution of females aged 20 and older by highest level of education, Census 1996—2022
Source: Census 1996—2022
Educational progression
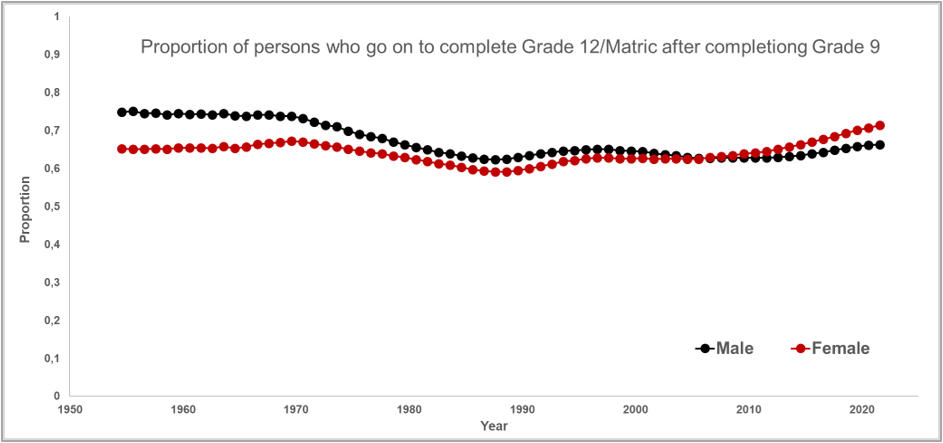
Figure 2.2 shows that more women are progressing through the education system and advancing to higher levels of education than before. The trend marks a significant milestone in the journey toward educational equity and empowerment of women in South Africa.
Figure 2.2: Time plot for proportions of persons completing grade 12 after completing grade 9 by sex, Census 2022
Source: Census 2022
The figure indicates that males had higher progression ratios for completing grade 12 after completing grade 9 up until the early 2000s. This pattern began to change from year 2010 to date, where females surpassed their male counterparts.
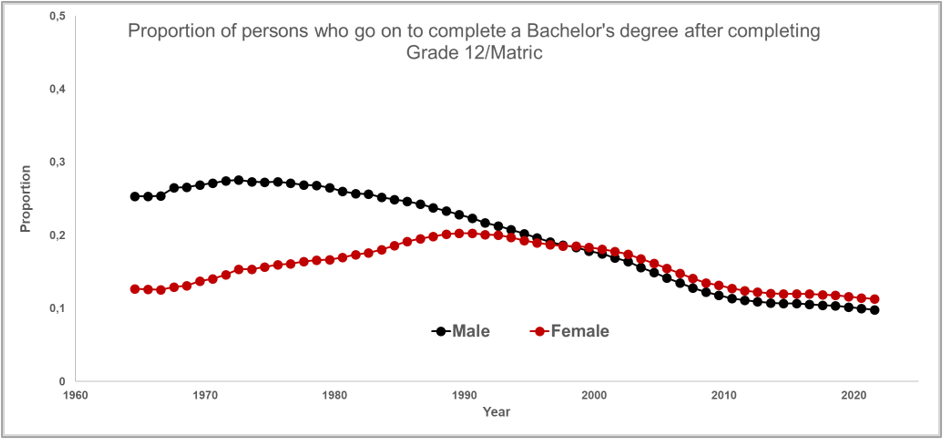
Looking at progression ratios in Figure 2.3 of persons completing a bachelor’s degree after completing grade 12 by sex, it is noticeable that the gender gap has narrowed in favour of women, who have outpaced their male counterparts in the last three decades.
Figure 2.3: Time plot for proportions of persons completing a bachelor’s degree after completing grade 12 by sex, Census 2022
Source: Census 2022
These progression ratios show a shift, over the period observed, in relative rates of educational advancement between males and females.
Field of education
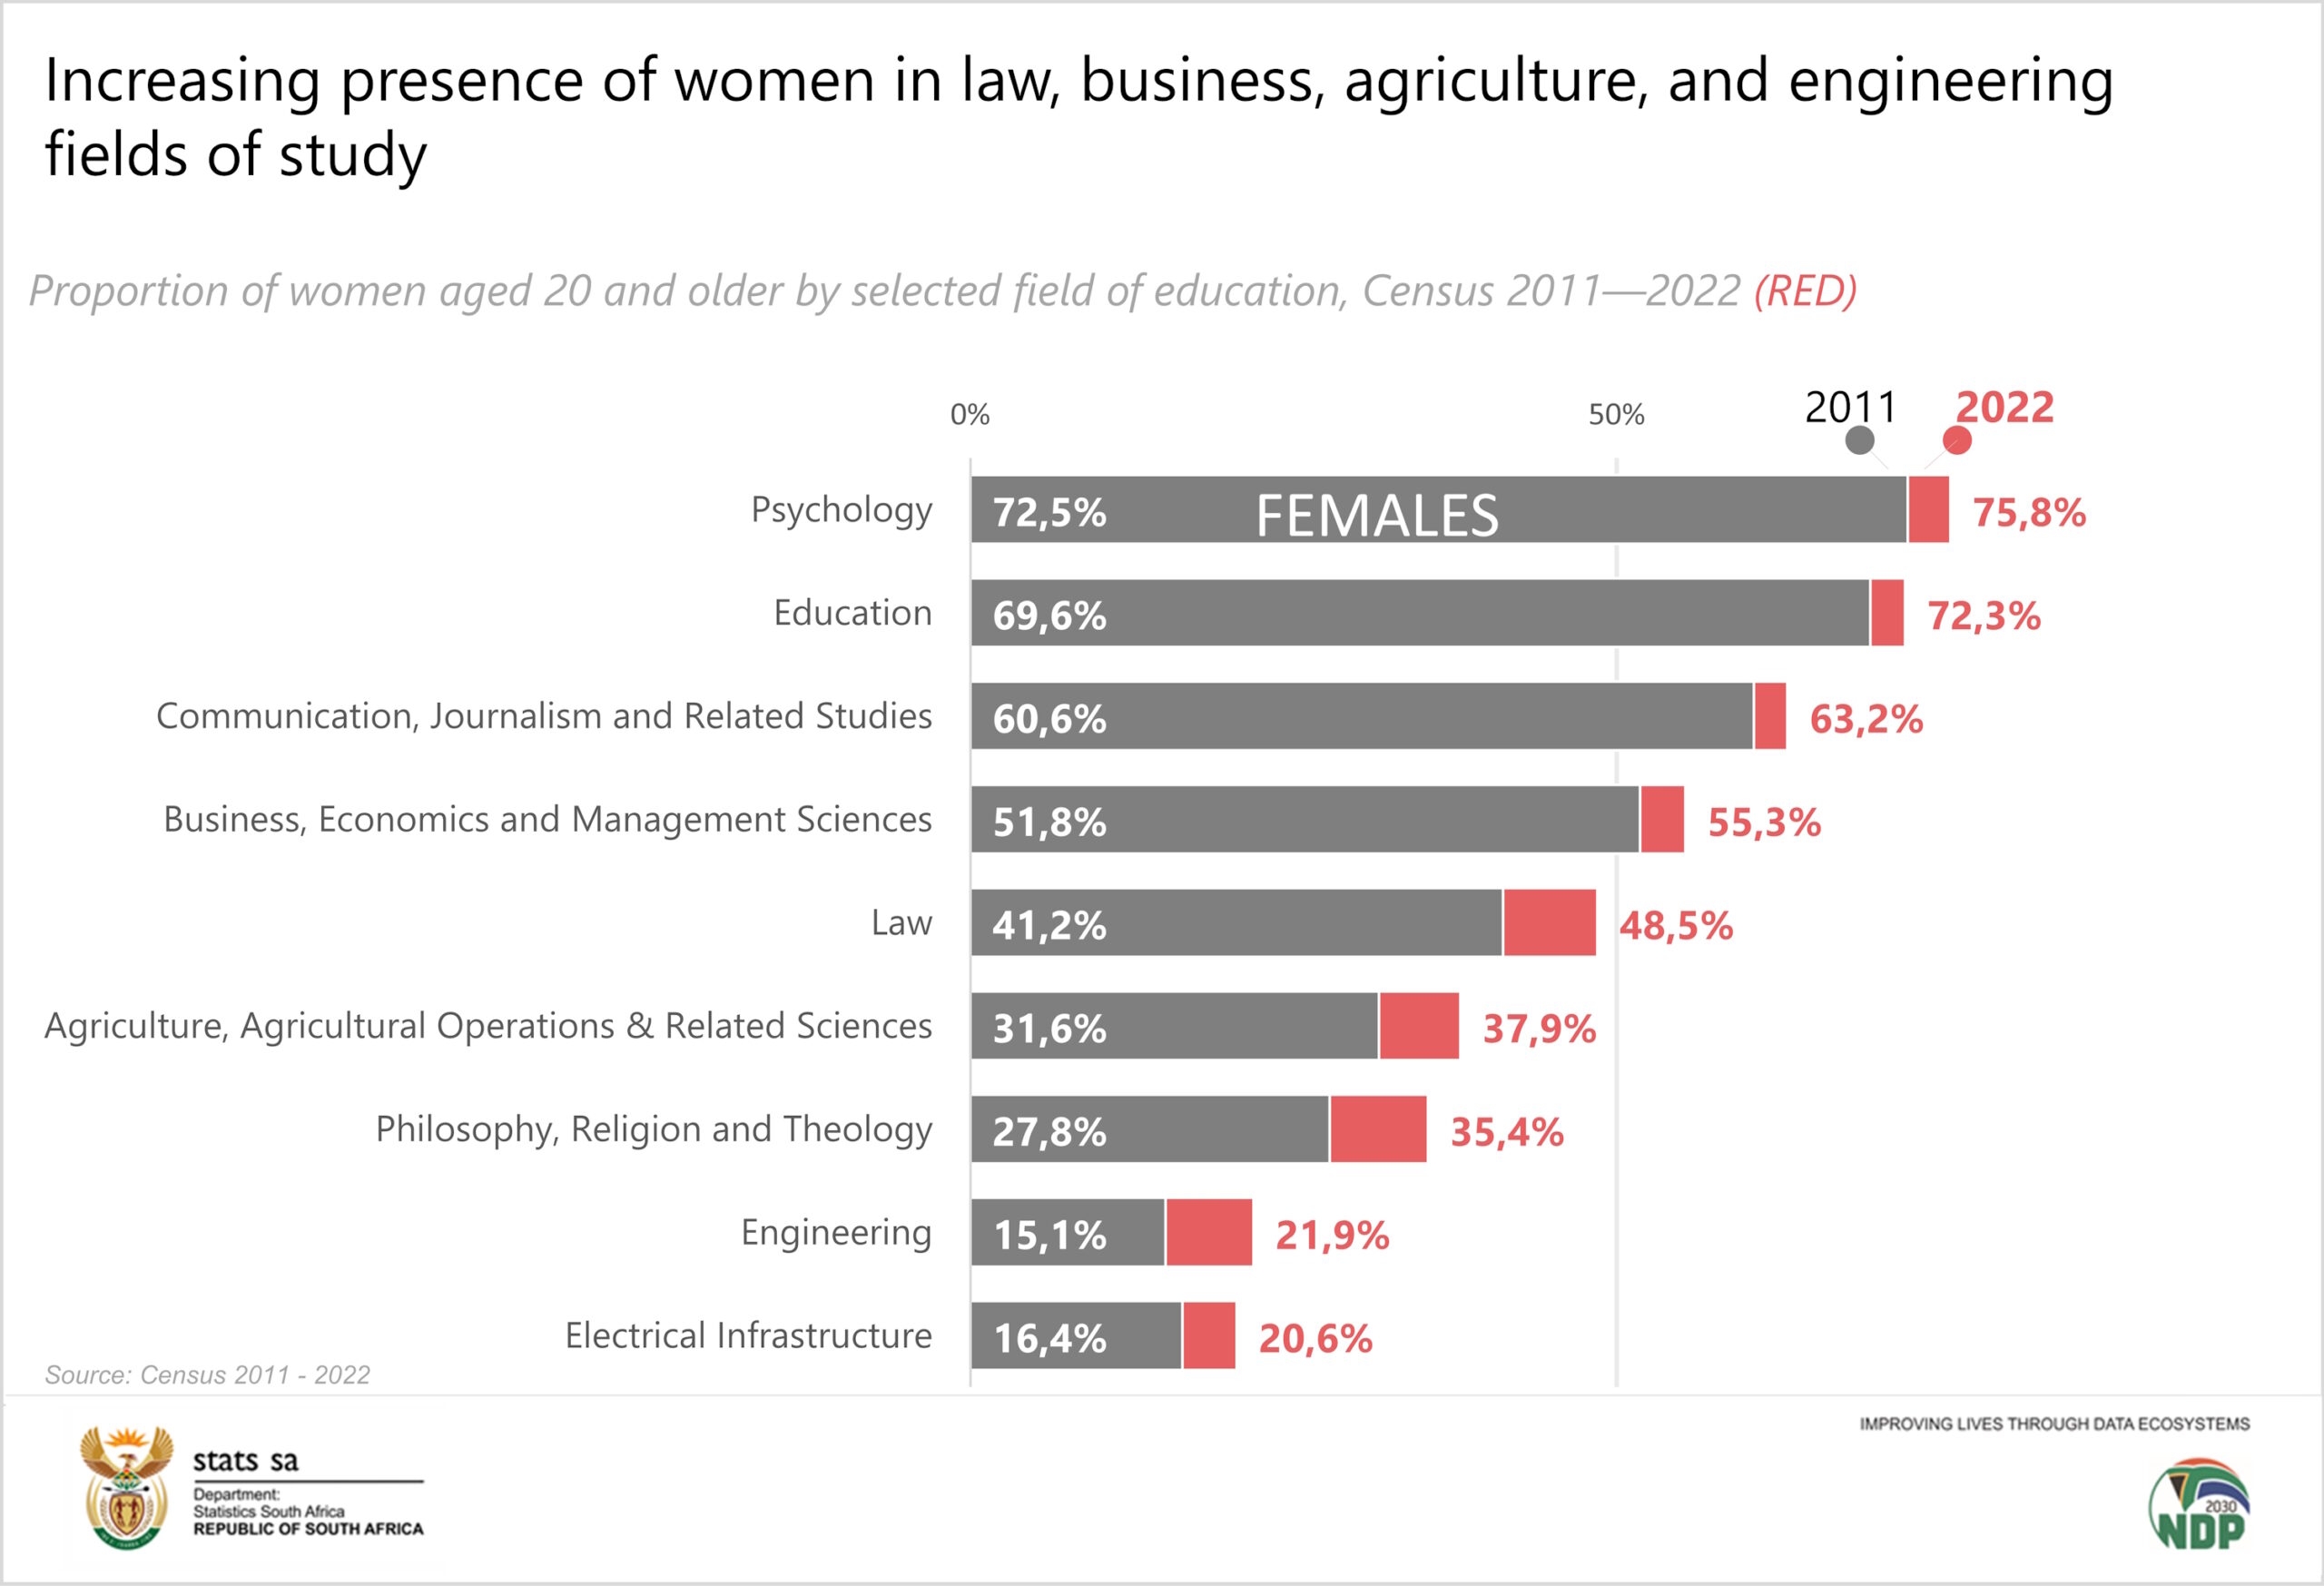
Figure 2.4 shows that women’s participation across different fields of education has increased significantly over the past decade. Whilst women continue to dominate fields such as Psychology (75.8% in 2022), Education (72.3%), and Communication & Journalism (63.2%), there has also been growing participation in fields that have traditionally had lower female representation. Results show a greater proportion of women qualifying in Business, Economics & Management Sciences (from 51.8% to 55.3%) and Law (from 41.2% to 48.5%). These gains suggest that more women are entering fields that can lead to leadership positions, influence decision-making, and contribute to economic growth. The increasing presence of women in law, business, agriculture, and engineering demonstrates both progress in equalising opportunities and the ongoing journey toward achieving parity in fields historically dominated by men.
Figure 2.4: Proportion of women aged 20 and older by selected field of education, Census 2011—2022
Women in employment
Over the past three decades, women in South Africa have played an increasingly important role in the labour market, contributing to the country’s socio-economic transformation. While overall employment among women has grown steadily, the unemployment rate has increased. Women’s participation in the labour market has diversified beyond traditional roles into professional, financial, and technical sectors.
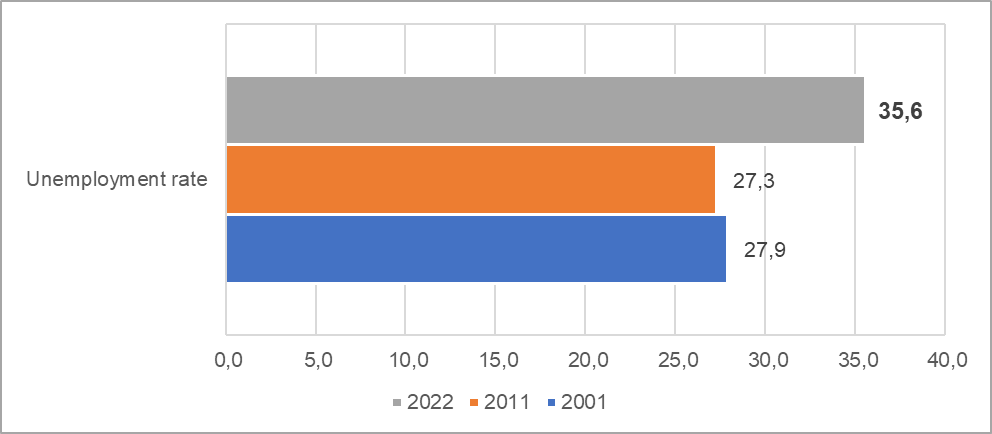
Figure 3.1: Distribution of females aged 15 to 64 by unemployment rate, QLFS 2001 & QLFS 2011—2022
Source: LFS 2001, QLFS 2011—2022
Figure 3.1 shows that unemployment amongst women increased over the last three decades (from 27.9% in 2001 to 35.6% in 2022), highlighting the ongoing challenges women encounter in accessing employment, and persistent labour market barriers.
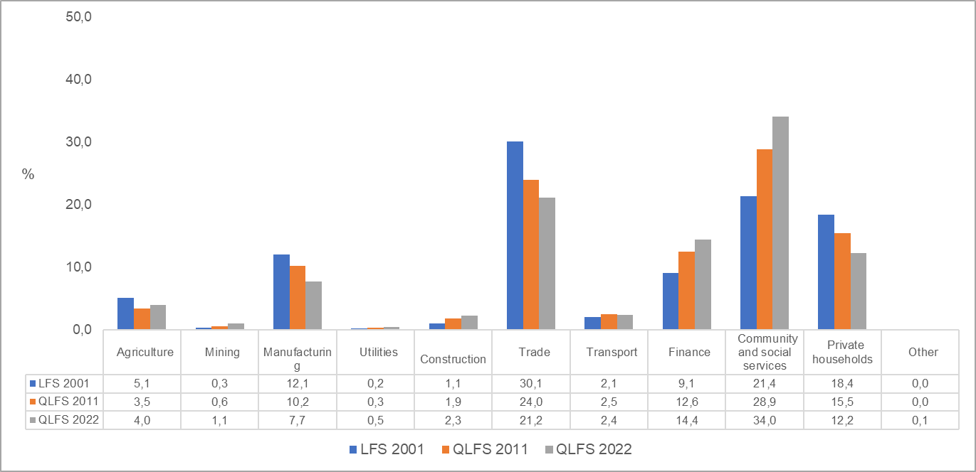
Despite rising unemployment, Figure 3.2 indicates that the number of employed women increased from 5.5 million in 2001 to 6.8 million in 2022. Statistics on employment of women by industry show that there was an expansion in the number of women employed in the community & social services, finance, construction and utilities sectors. The number of women employed in community and social services almost doubled from 1.2 million in 2001 to 2.3 million in 2022, showing women’s strong role in education, health, and public services. The number of women employed in the finance sector increased from 502,000 in 2001 to 987,000 in 2022. The construction and utilities sectors also increased over the same period.
Some industries, including private households, manufacturing and trade, recorded declines in the number of women employed. In private households, employment of women fell from 1.02 million in 2001 to 837,000 in 2022, indicating shifts in domestic work patterns.
Figure 3.2: Distribution of females aged 15 to 64 by broad employment industry, QLFS 2001 & QLFS 2011—2022
Source: LFS 2001, QLFS 2011—2022
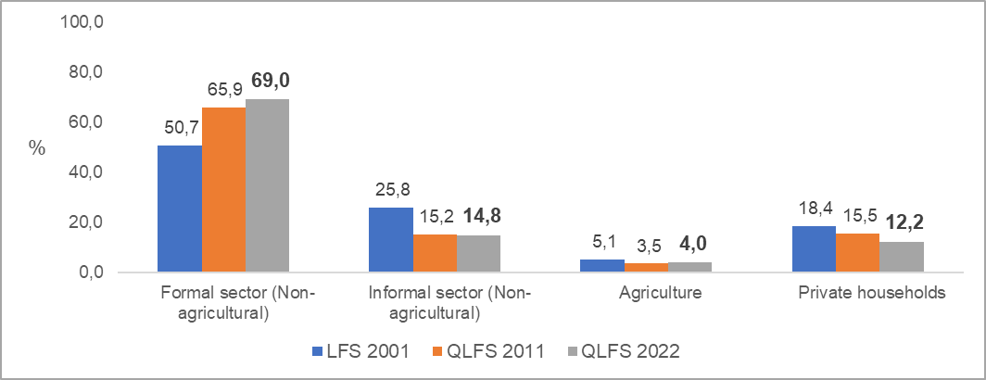
Figure 3.3 shows a significant increase in the proportion of women employed in the formal non-agricultural sector, from 50,7% in 2001 to 69,0% in 2022. Women employed in the informal non-agricultural sector and agricultural sector decreased in the same period.
Figure 3.3: Distribution of females aged 15 to 64 by employment sector, QLFS 2001 & QLFS 2011—2022
Source: LFS 2001, QLFS 2011—2022
Women’s living arrangements
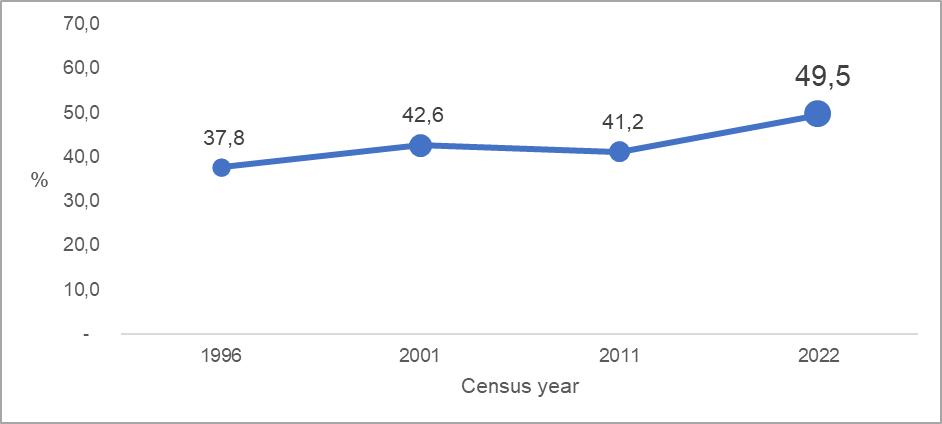
Women’s roles as household heads have shifted significantly over the last three decades. In 1996, almost two out of five (37,8%) households were headed by females; in 2022, almost half (49,5%) of all households were headed by women.
Figure 4.1: Proportion of female-headed households, Census 1996—2022
Source: Census 1996—2022
Over the last three decades, women in South Africa have achieved significant progress in education and employment, despite ongoing challenges relating to unemployment. From 1996 to 2022, women’s educational levels, their presence in professional, financial, and technical jobs, and the number of female-headed households all increased. During this time, the female unemployment rate also rose from 27.9% in 2001 to 35.6% in 2022. Job growth was not even across industries: more women worked in community and social services, finance, and construction and utilities, while fewer worked in private households, manufacturing, and trade.
Sources