
Stats SA welcomed the return of a regular data series to its publication schedule in July.
Reintroduction of insolvency data
Stats SA resumed the publication of the monthly Statistics of insolvencies statistical release after a long break. The release provides a monthly count of insolvencies in each province from January 2023 to June 2026. According to the data, the number of insolvencies in the South African economy declined by 11,1% (from 847 to 753 cases) in the first six months of 2026 compared with the first six months of 2025.
Insolvencies refer to partnerships or individuals that are unable to pay their debts and are placed under final sequestration. A possible outcome of insolvency is liquidation, which refers to the winding-up of a company or close corporation when its liabilities exceed assets and it is unable to meet its financial obligations. Stats SA’s Statistics of liquidations statistical release showed the number of liquidations declined by 0,9% (from 1 373 to 1 361 cases) in the first six months of 2026 compared with the first six months of 2025. The 1 361 cases in the first half of 2026 comprised 1 299 voluntary and 132 compulsory liquidations (i.e. by order of the court).
The latest monthly business indicators
The insolvency and liquidation datasets are among the many published by Stats SA that provide insight into the health of the economy. Figure 1 below shows additional indicators from the statistical agency’s monthly business surveys and inflation series. In May, mining; manufacturing; electricity generation; buildings completed (as reported by large municipalities); wholesale trade sales; restaurants, catering & fast-food; rail freight transport; and road passenger transport were weaker year-on-year (see Figure 1 below).
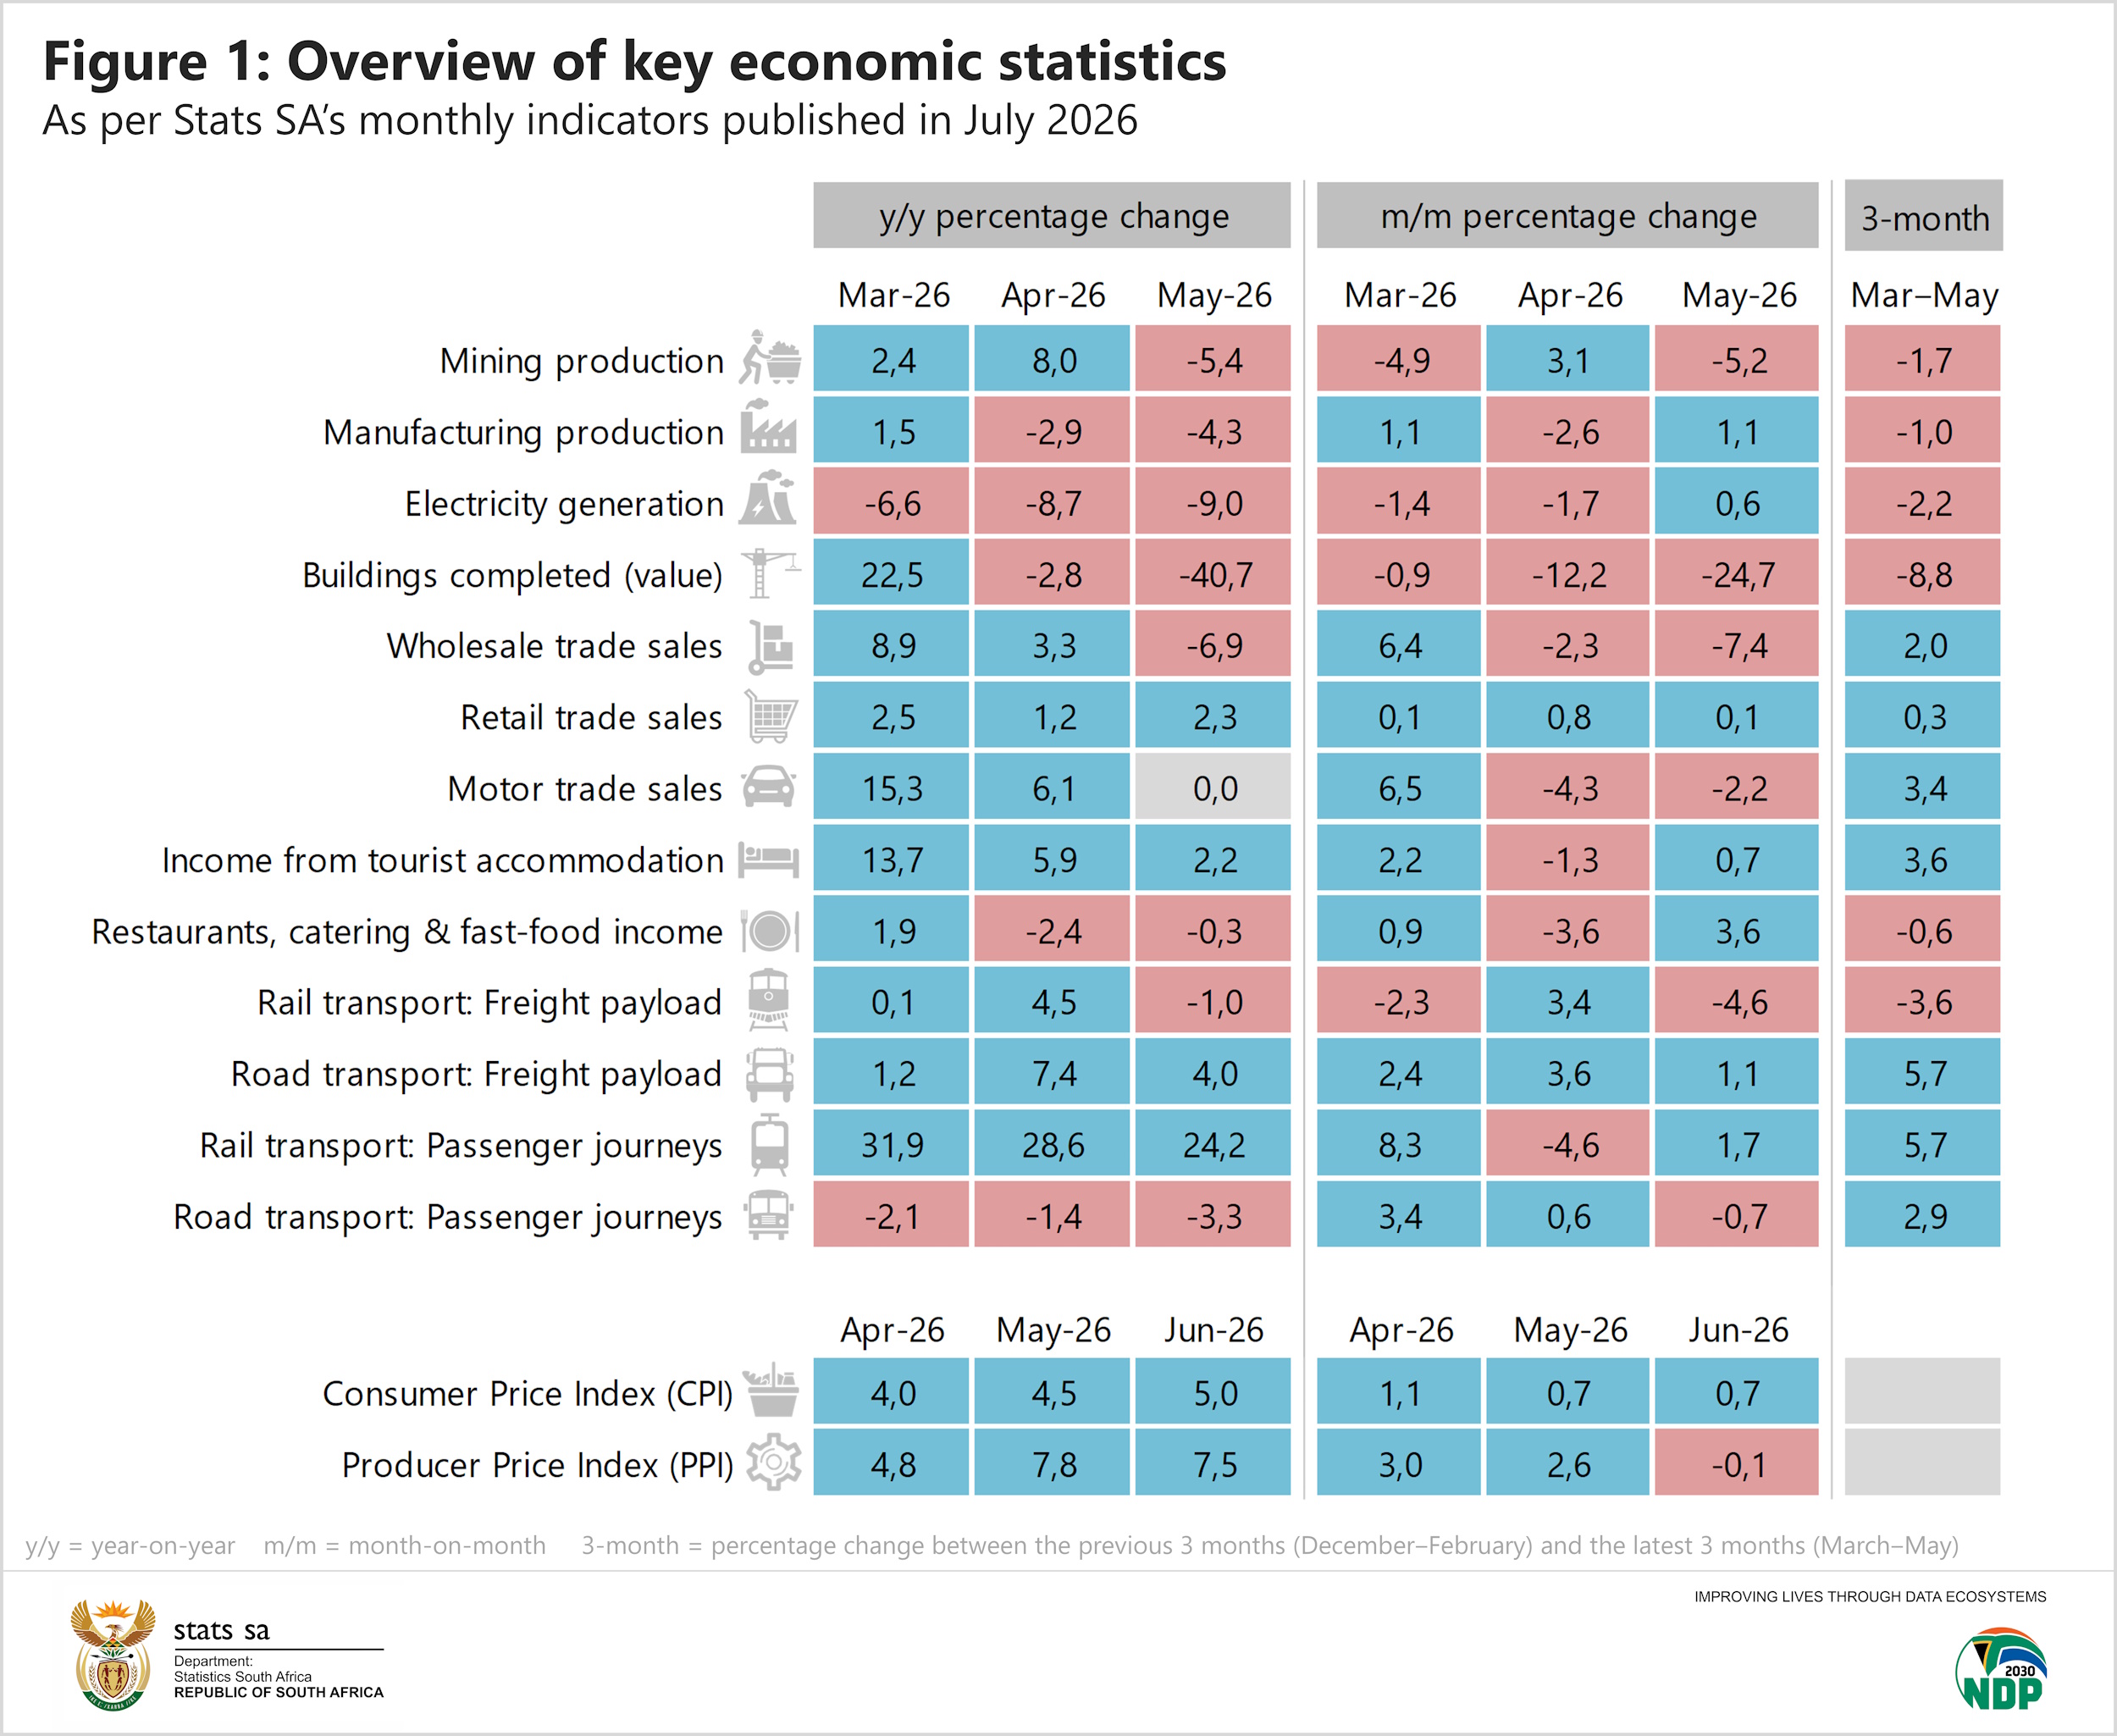
Mining activity cooled by 5,4% with iron ore, coal and platinum group metals the largest negative contributors. Iron ore production declined by 12,7%, coal by 6,1% and platinum group metals by 4,4%. Together, the three subtracted 4,8 percentage points from overall growth. Diamonds, nickel, copper and gold were also softer year-on-year. Chromium ore and manganese ore registered positive growth.
South African manufacturing decreased by 4,3%. Seven of the ten manufacturing divisions experienced a lacklustre month. Food & beverages was the most significant negative contributor, retreating by 6,4% year-on-year and pulling overall growth down by 1,6 percentage points. Six other divisions also recorded losses in May, with wood, paper, printing & publishing; furniture & other manufacturing; and glass & non-metallic mineral products registering the sharpest decreases.
Three divisions were stronger. Petroleum, chemical, rubber & plastic products; textiles & clothing; and electrical machinery recorded gains, but their influence was not enough to offset declines elsewhere in the industry.
National electricity generation weakened by 9,0% year-on-year. Production was up by 0,6% month-on-month, following three consecutive decreases.
On the upside, Figure 1 shows retail trade sales, tourist accommodation, road freight transport and rail passenger transport increasing year-on-year in May.
Retail trade strengthened by 2,3%. Five of the seven retail groups recorded a rise in sales, with the miscellaneous category – all ‘other’ retailers – and textiles & clothing the leading drivers of growth. The all ‘other’ retailers category includes online stores and retailers specialising in jewellery, stationery and sports goods. Household furniture & appliances, pharmaceuticals & medical goods and general dealers were also stronger in May. On the downside, hardware, paint & glass recorded a decrease. Food & beverages was also weaker, registering its sixth consecutive month of year-on-year decline.
Consumer inflation accelerates to a 2-year high
Rising fuel prices continued to drive consumer inflation higher. The headline rate rose sharply to 5,0% in June from 4,5% in May, the highest reading since June 2024 when the rate was 5,1%. Food & beverages inflation, however, continued to slow, declining to 1,6% from 1,9% in May.
Factory-gate inflation dipped in June, edging lower to 7,5% from 7,8% in May.
What to look forward to in August
The next set of employment and unemployment data will be published on 11 August, and will cover the second quarter of 2026. The statistical release will be published here. For those interested in government statistics, financial data for extra-budgetary accounts and funds for 2024/2025 will be released here on 27 August.
Interested to know more? Keep up to date with our publication schedule. For a comprehensive list of products and releases, download our catalogue. For a regular update of indicators and infographics, visit our data story feed and download the latest edition of the Stats Biz newsletter.