
World Population Day is an event which aims to highlight the importance and urgency of population issues. The day was established by the former governing council of the UN Development Program in 1989 because of the commemoration and the interest shown with the world at 5 billion in 1987. The first World Population Day was observed on 11 July 1990 and, in December of the same year, the UN General Assembly resolved to continue observing this day in order to enhance awareness of population issues, particularly as they relate to the environment and development.
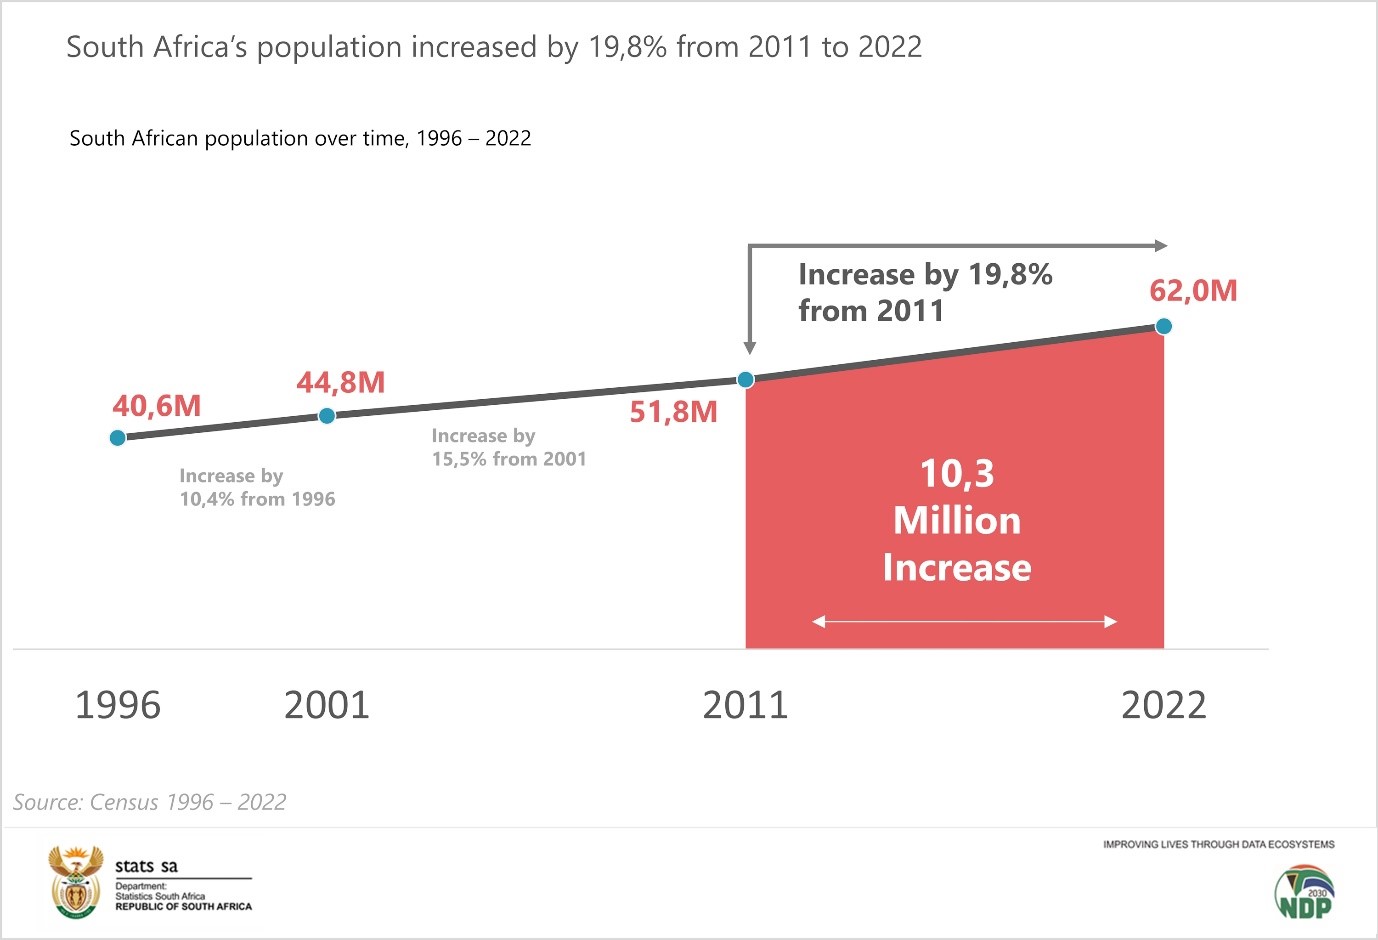
According to census data, South Africa’s population has grown from 40,6 million to over 62,0 million over 3 decades, from 1996 to 2022. Between 1996 and 2022 the population grew at an annual average growth rate of 1,7%. Approximately 51,5% (31,9 million) of the population was female in 2022.
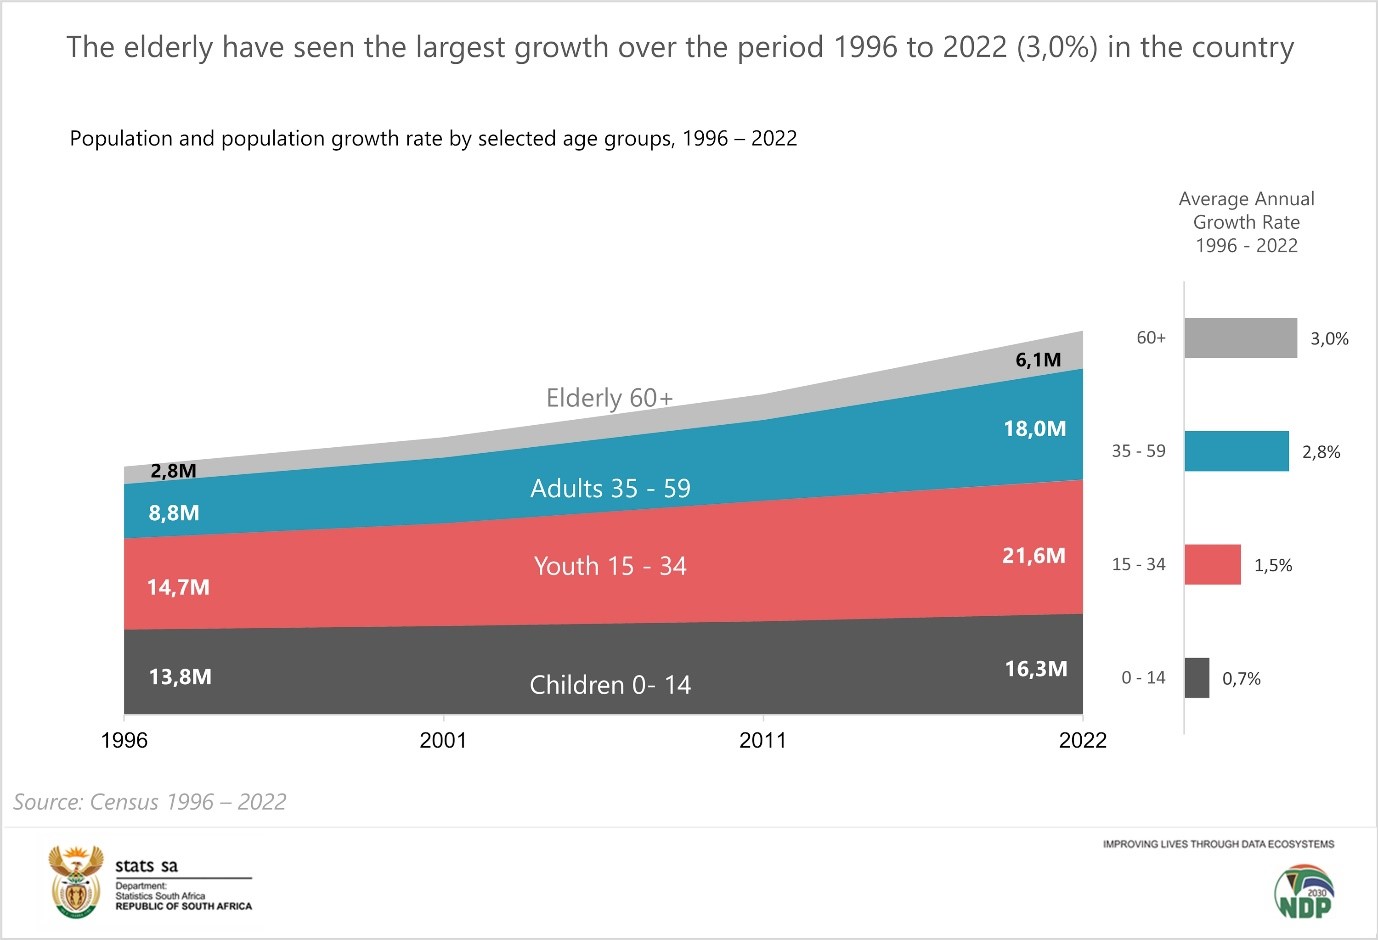
The elderly have seen the largest growth over the period 1996 to 2022 (3,0%). In the same period, the average annual growth rate of children aged 0-14 was the lowest (0,7%) followed by the youth (1,5%). Adults have a growth of 2,8%, increasing from 8,8 million in 1996 to almost 18 million in 2022. South Africa is considered a youthful population. When compared to the proportion of children, adults and the elderly, the youth constituted the largest proportion in 2022 at just over 21,6 million.
Source: Census 1996 – 2022
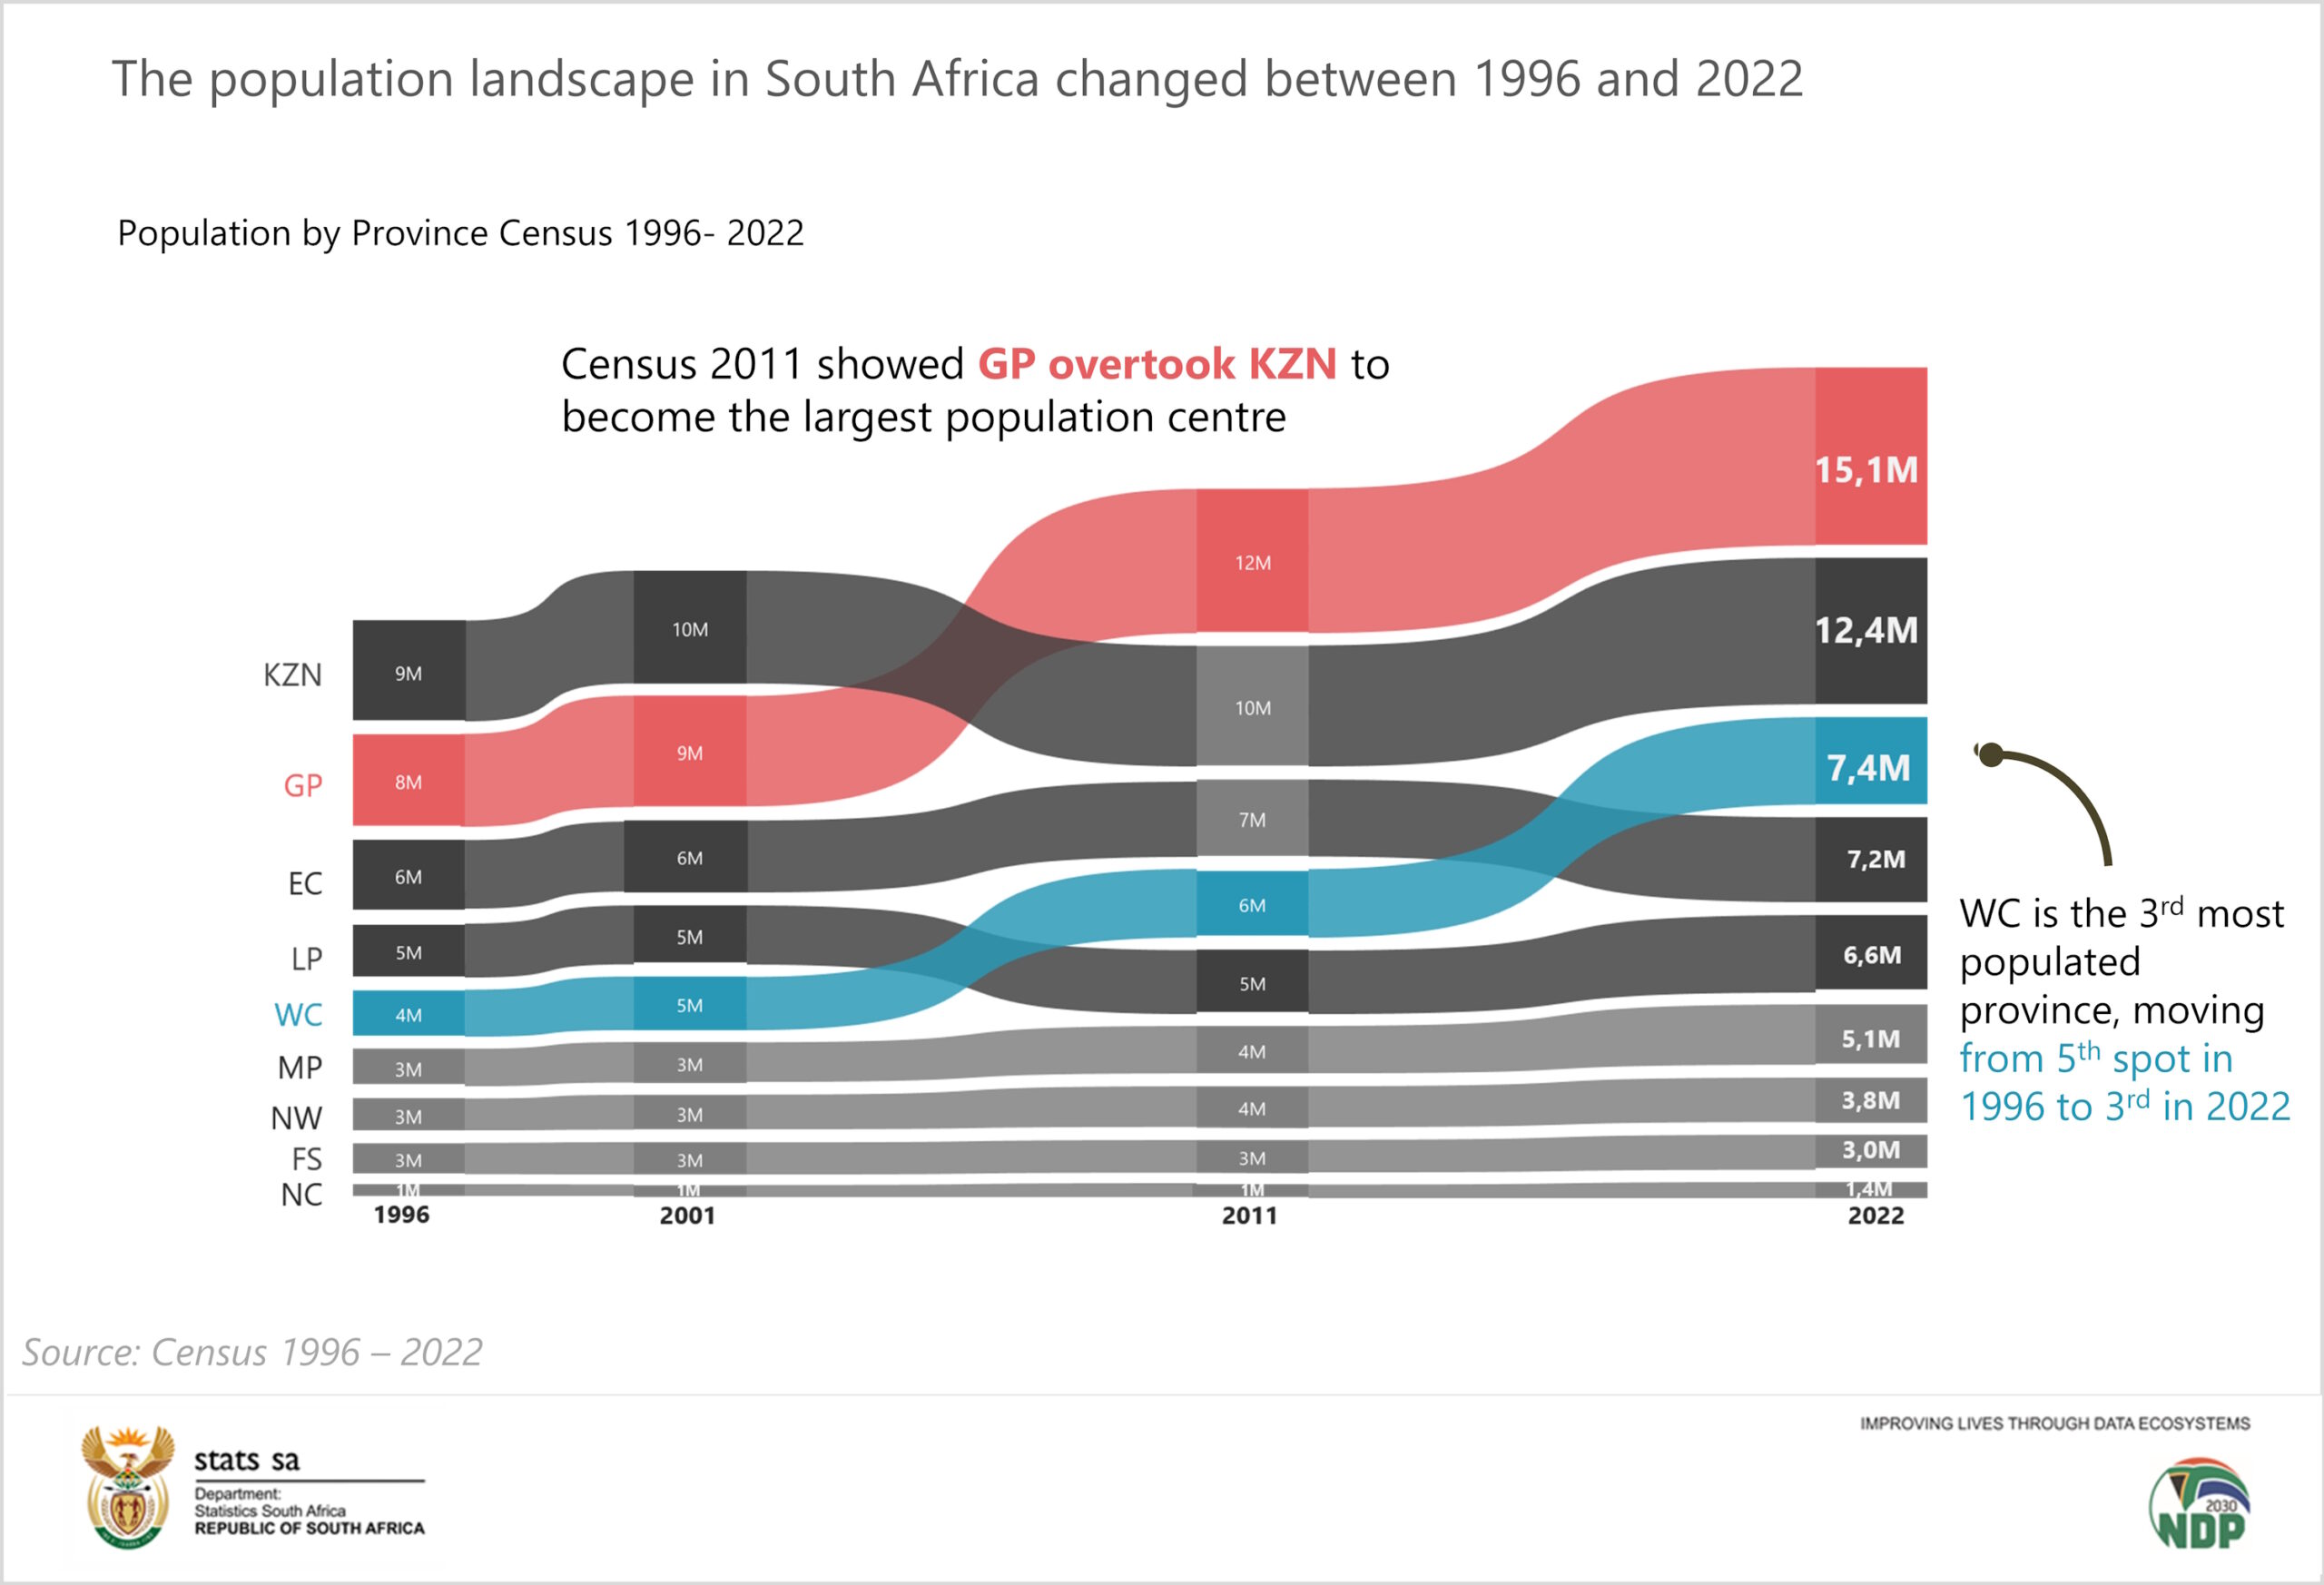
Gauteng became the most populated province in the country in 2011, after it overtook KwaZulu-Natal, with a population of over 15 million in 2022. Western Cape became the third-most populated province in 2022, moving from the number five spot, below Eastern Cape and Limpopo. Free State and the Northern Cape have consistently been the least populated provinces in the country.
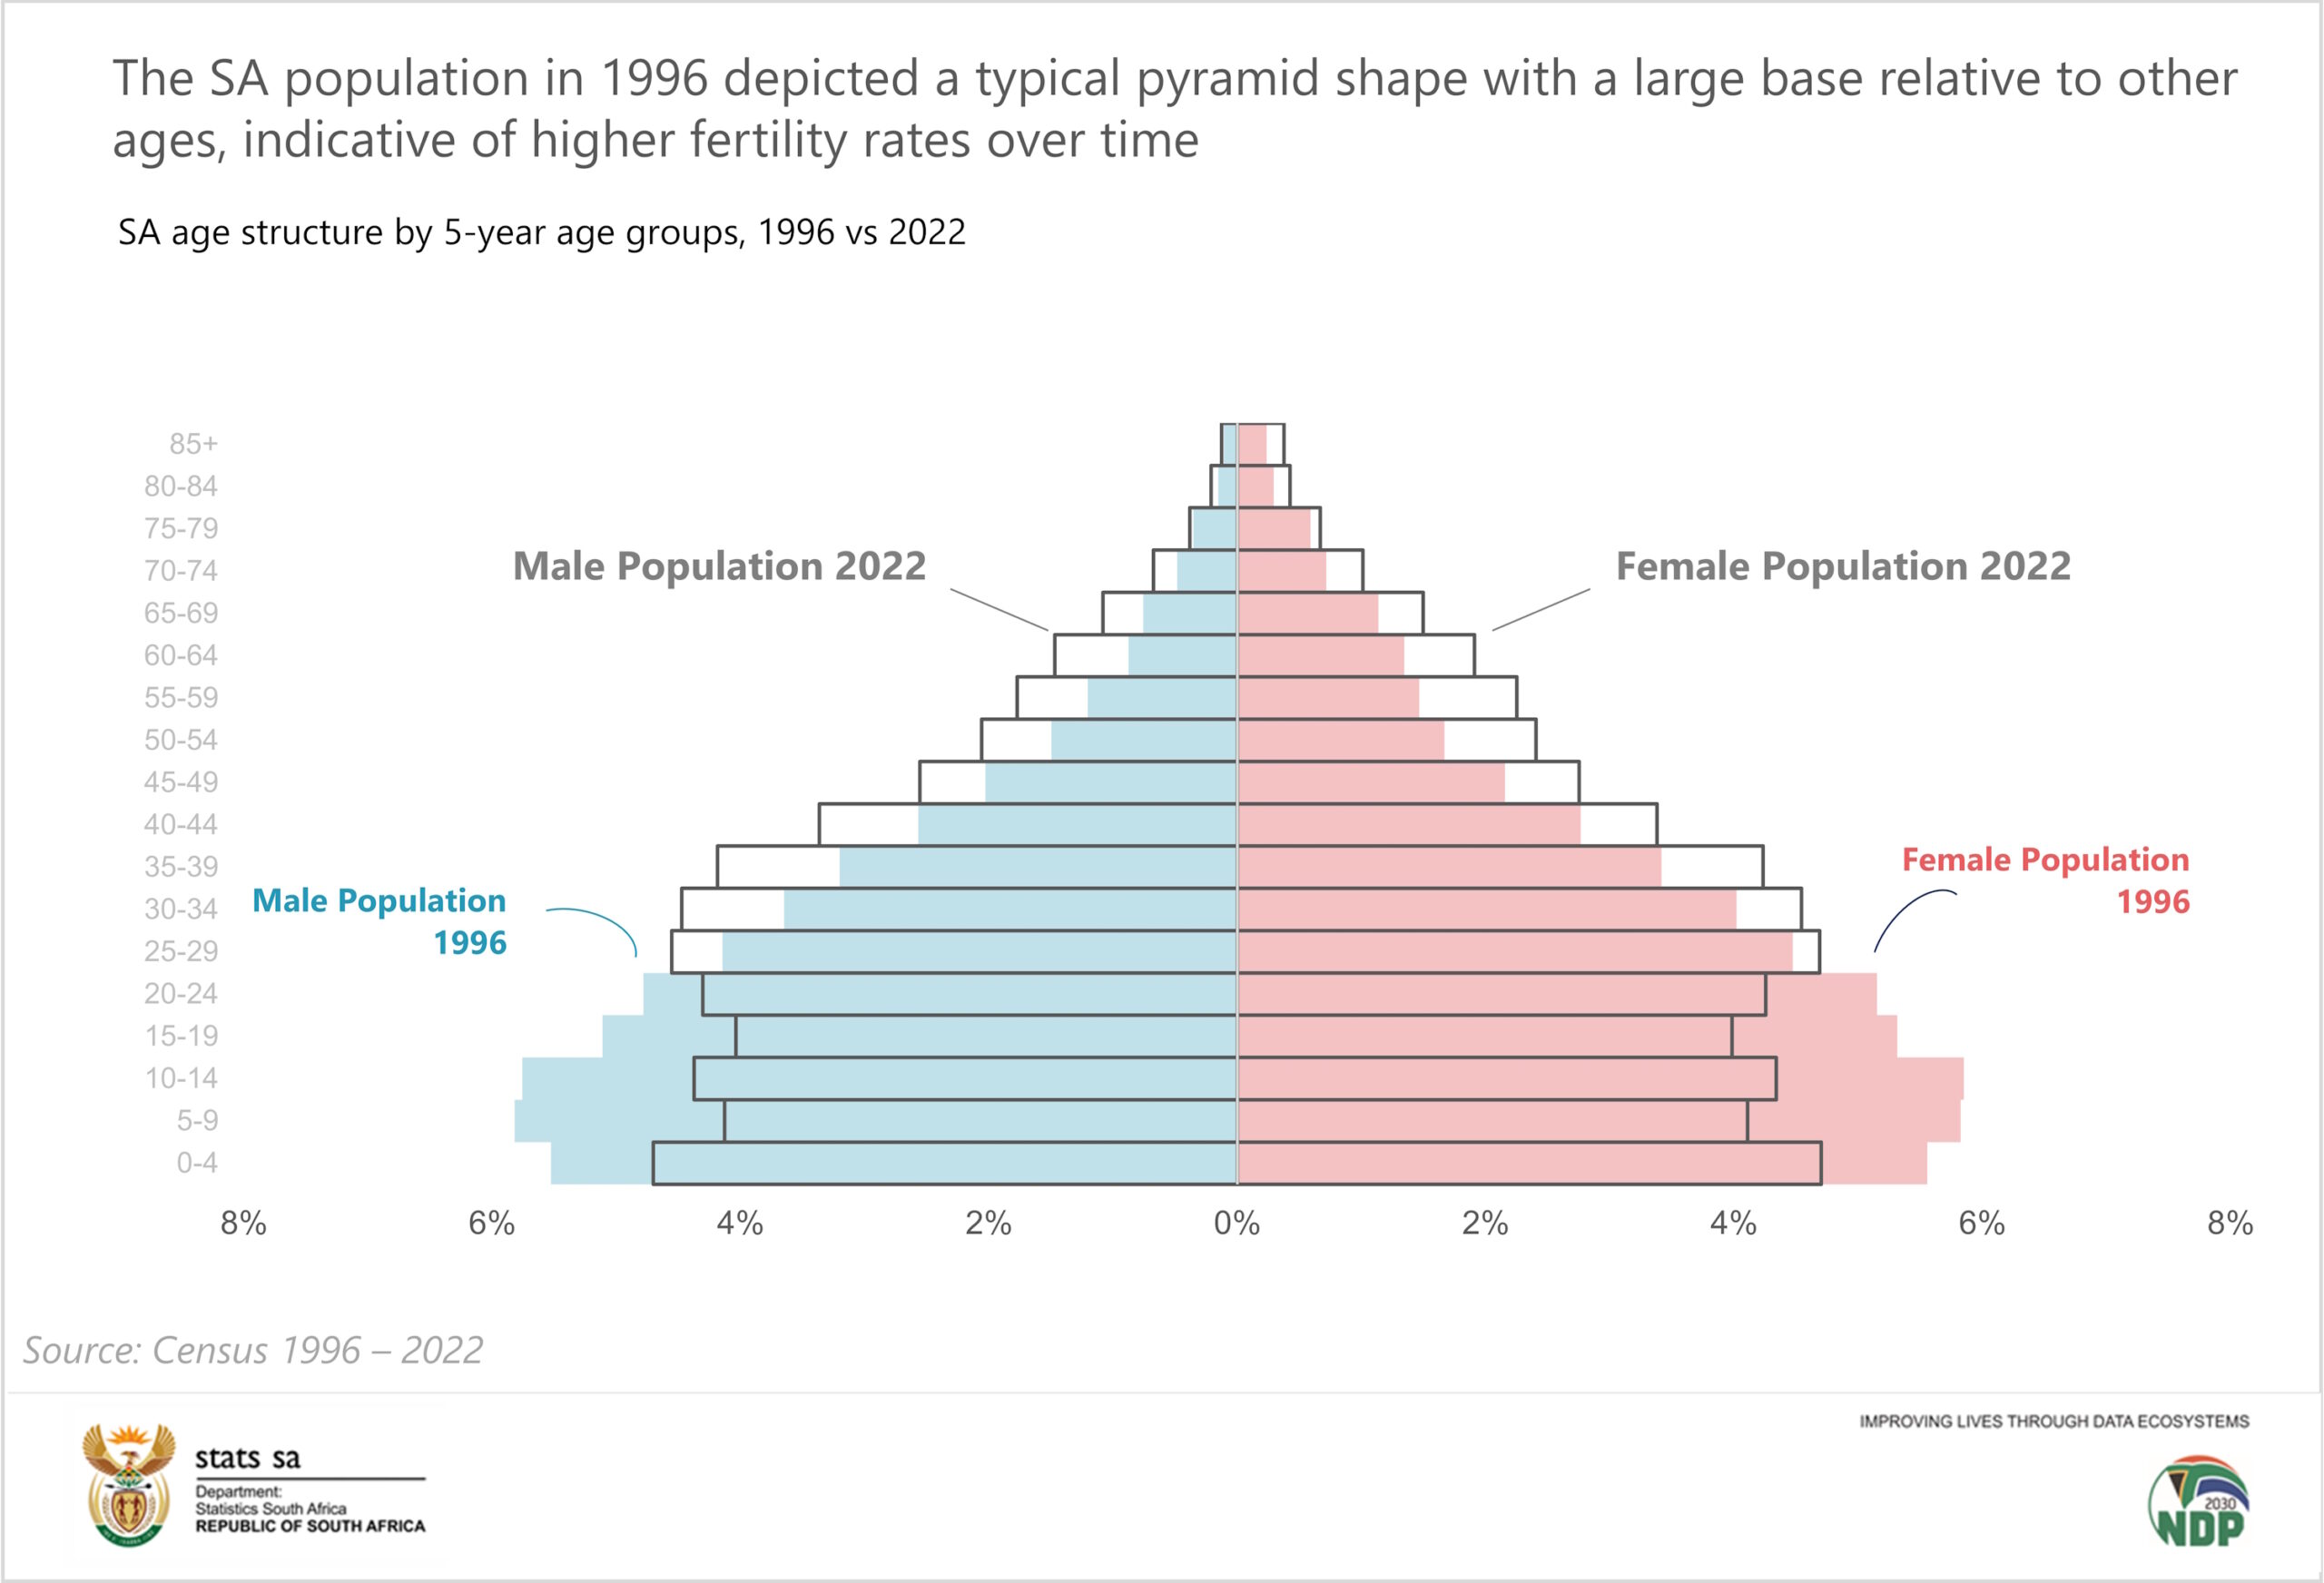
Changes in births, deaths and migration impact the population age and sex structure over time. The population pyramid tells the historical story of fertility, mortality and migration on the population. The population in 1996 depicted a typical pyramid shape with a large base relative to other ages, indicative of higher fertility rates over time. Furthermore, the pyramid shows a fairly large proportion of persons at younger ages (0–24 years) in 1996 compared to 2022. The results indicate a substantial decrease in the proportion of younger persons in 2022, while a steady increase is observed in ages 25 and older compared to the 1996 distribution. This is indicative of a fairly young population in 1996, which has shifted upward in 2022.
Selected provincial population age and sex structure over time (1996-2022)
Population pyramids are far more than mere graphic representations of the population by age and sex. Population pyramids tell us of past demographic patterns of fertility, mortality and migration. It is also used to tell us of the likely future trajectory of births, deaths and, subsequently, future needs and demands i.e. social security, schools, frail care, job opportunities, etc. Below we look at two selected provincial (Limpopo and Gauteng) pyramids with different age and sex structures.
The Limpopo pyramid depicts a typical pyramid shape with a larger base, especially in 1996, relative to other ages, indicative of higher fertility rates over time. Nevertheless, the 2022 structure shows an upward shift where the base has narrowed, while ages from 25 and older has increased, indicating a growing working age population in the past 26 years.
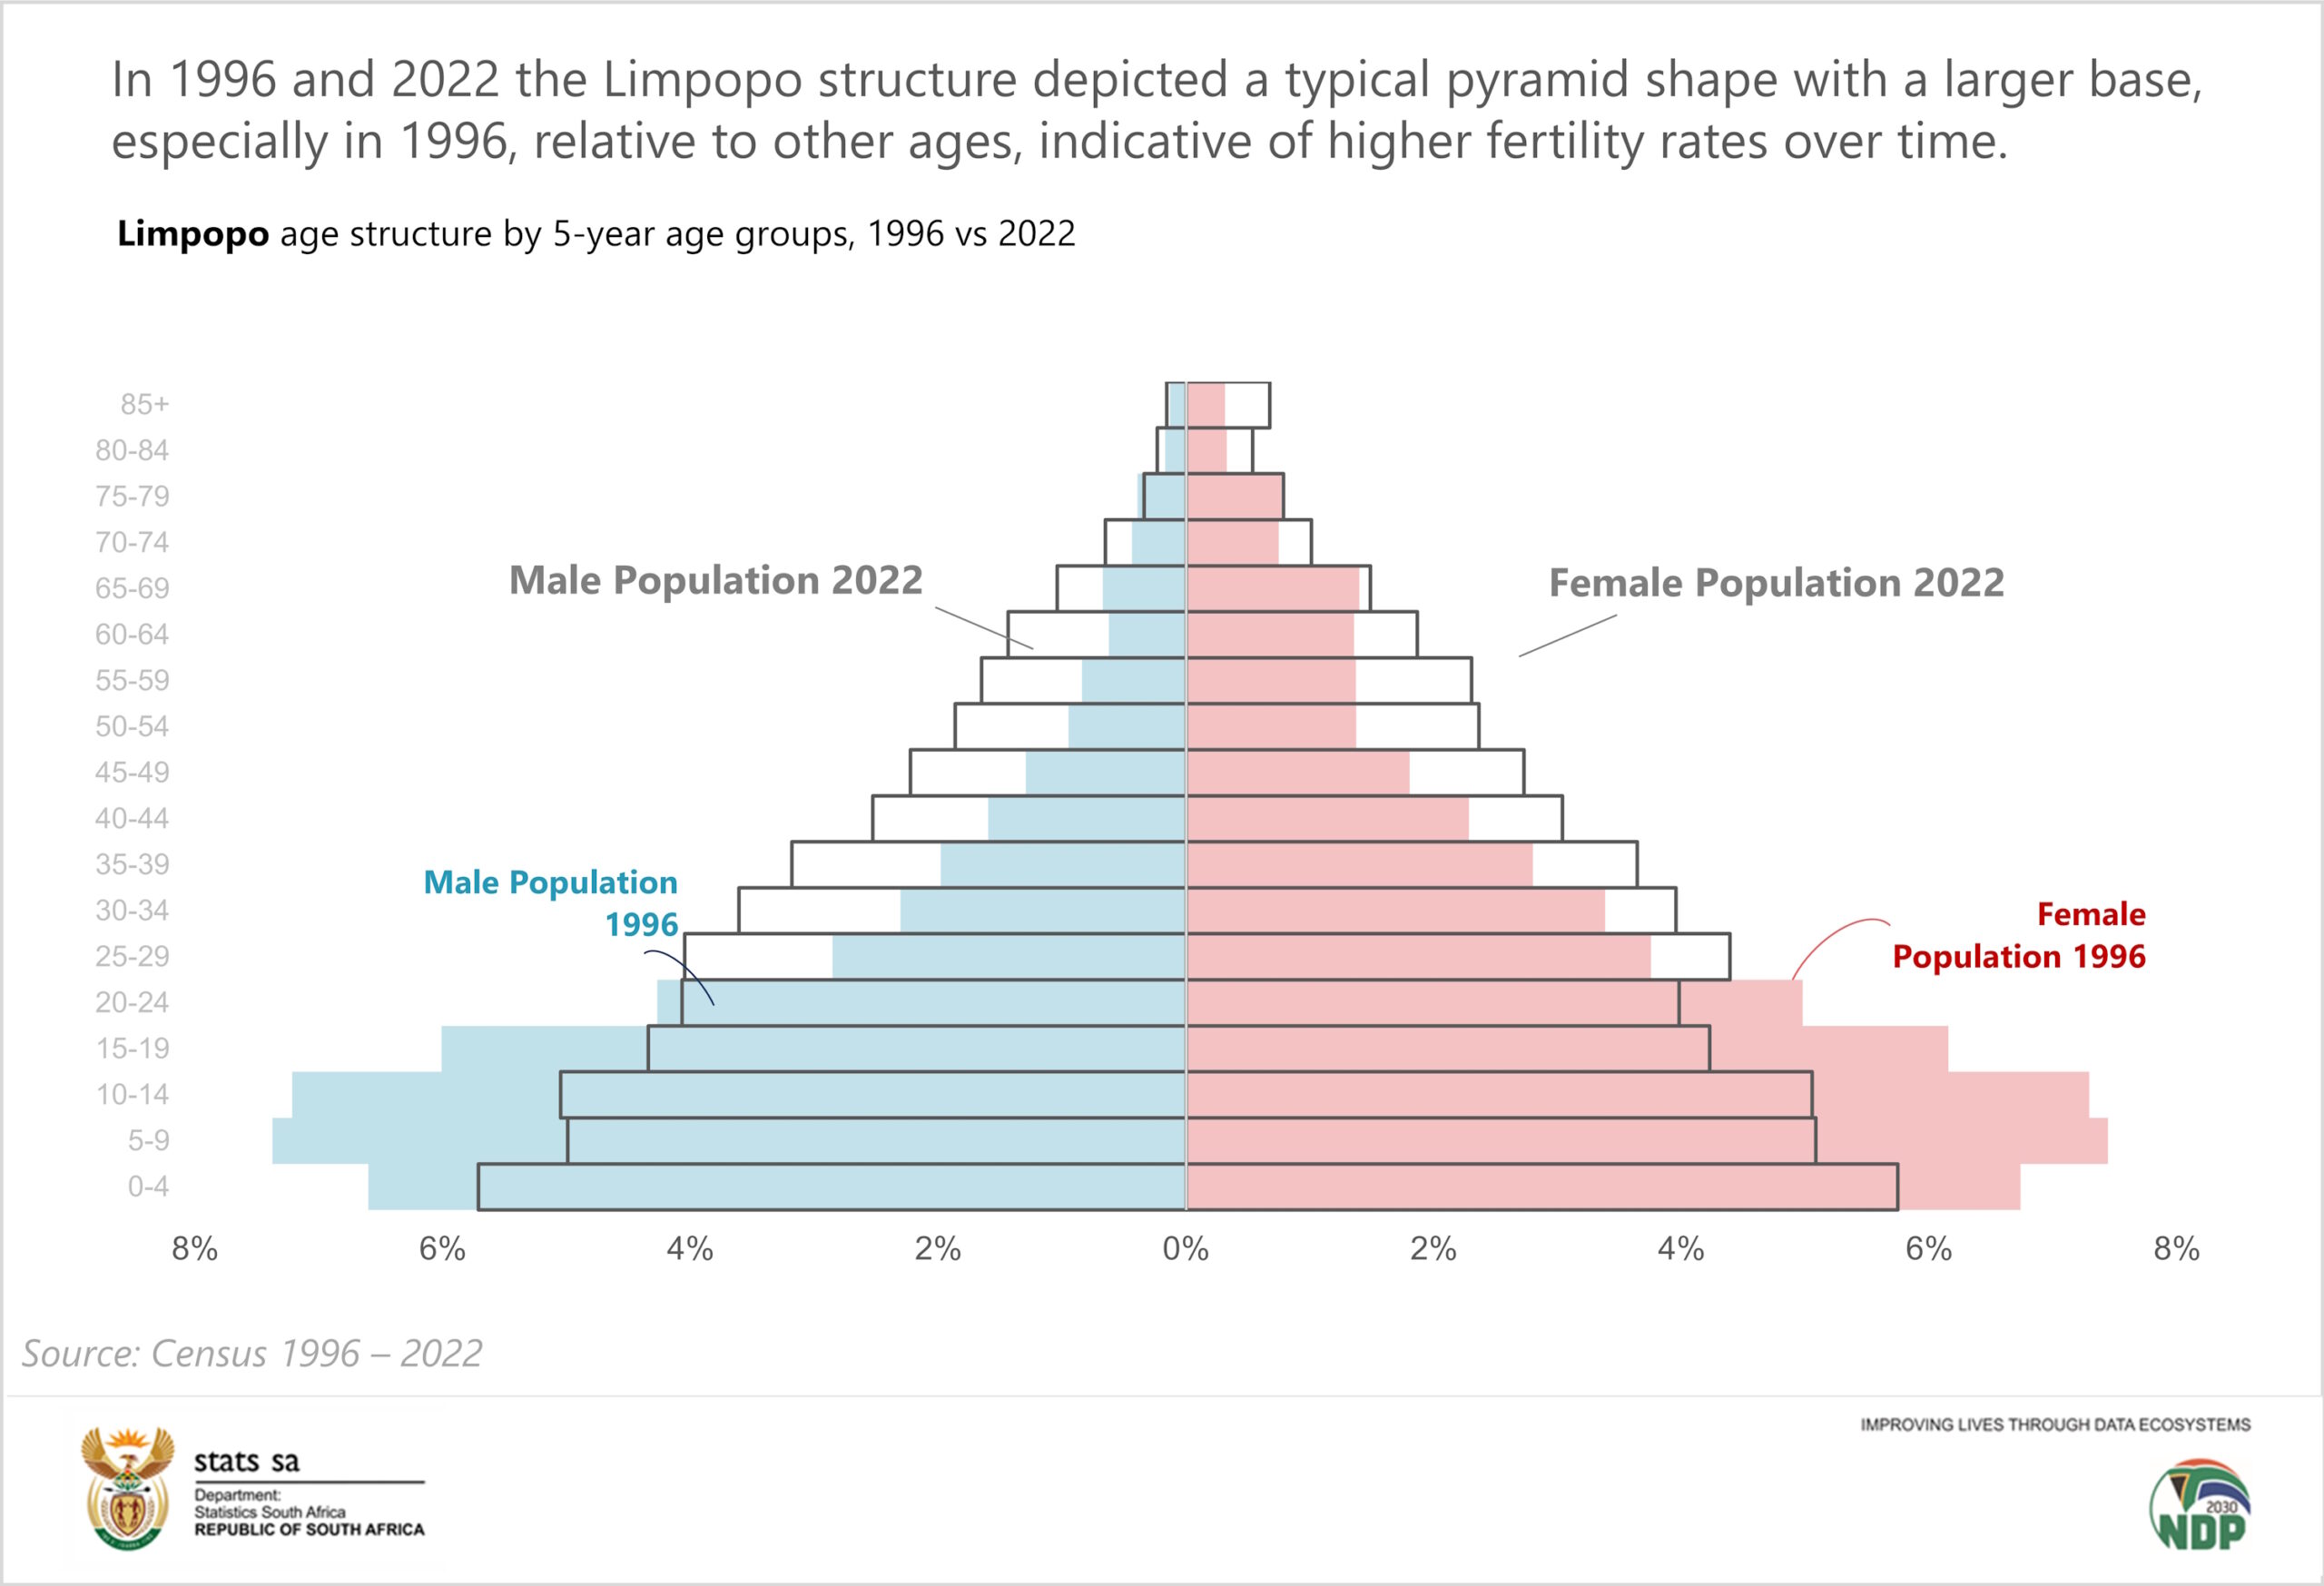
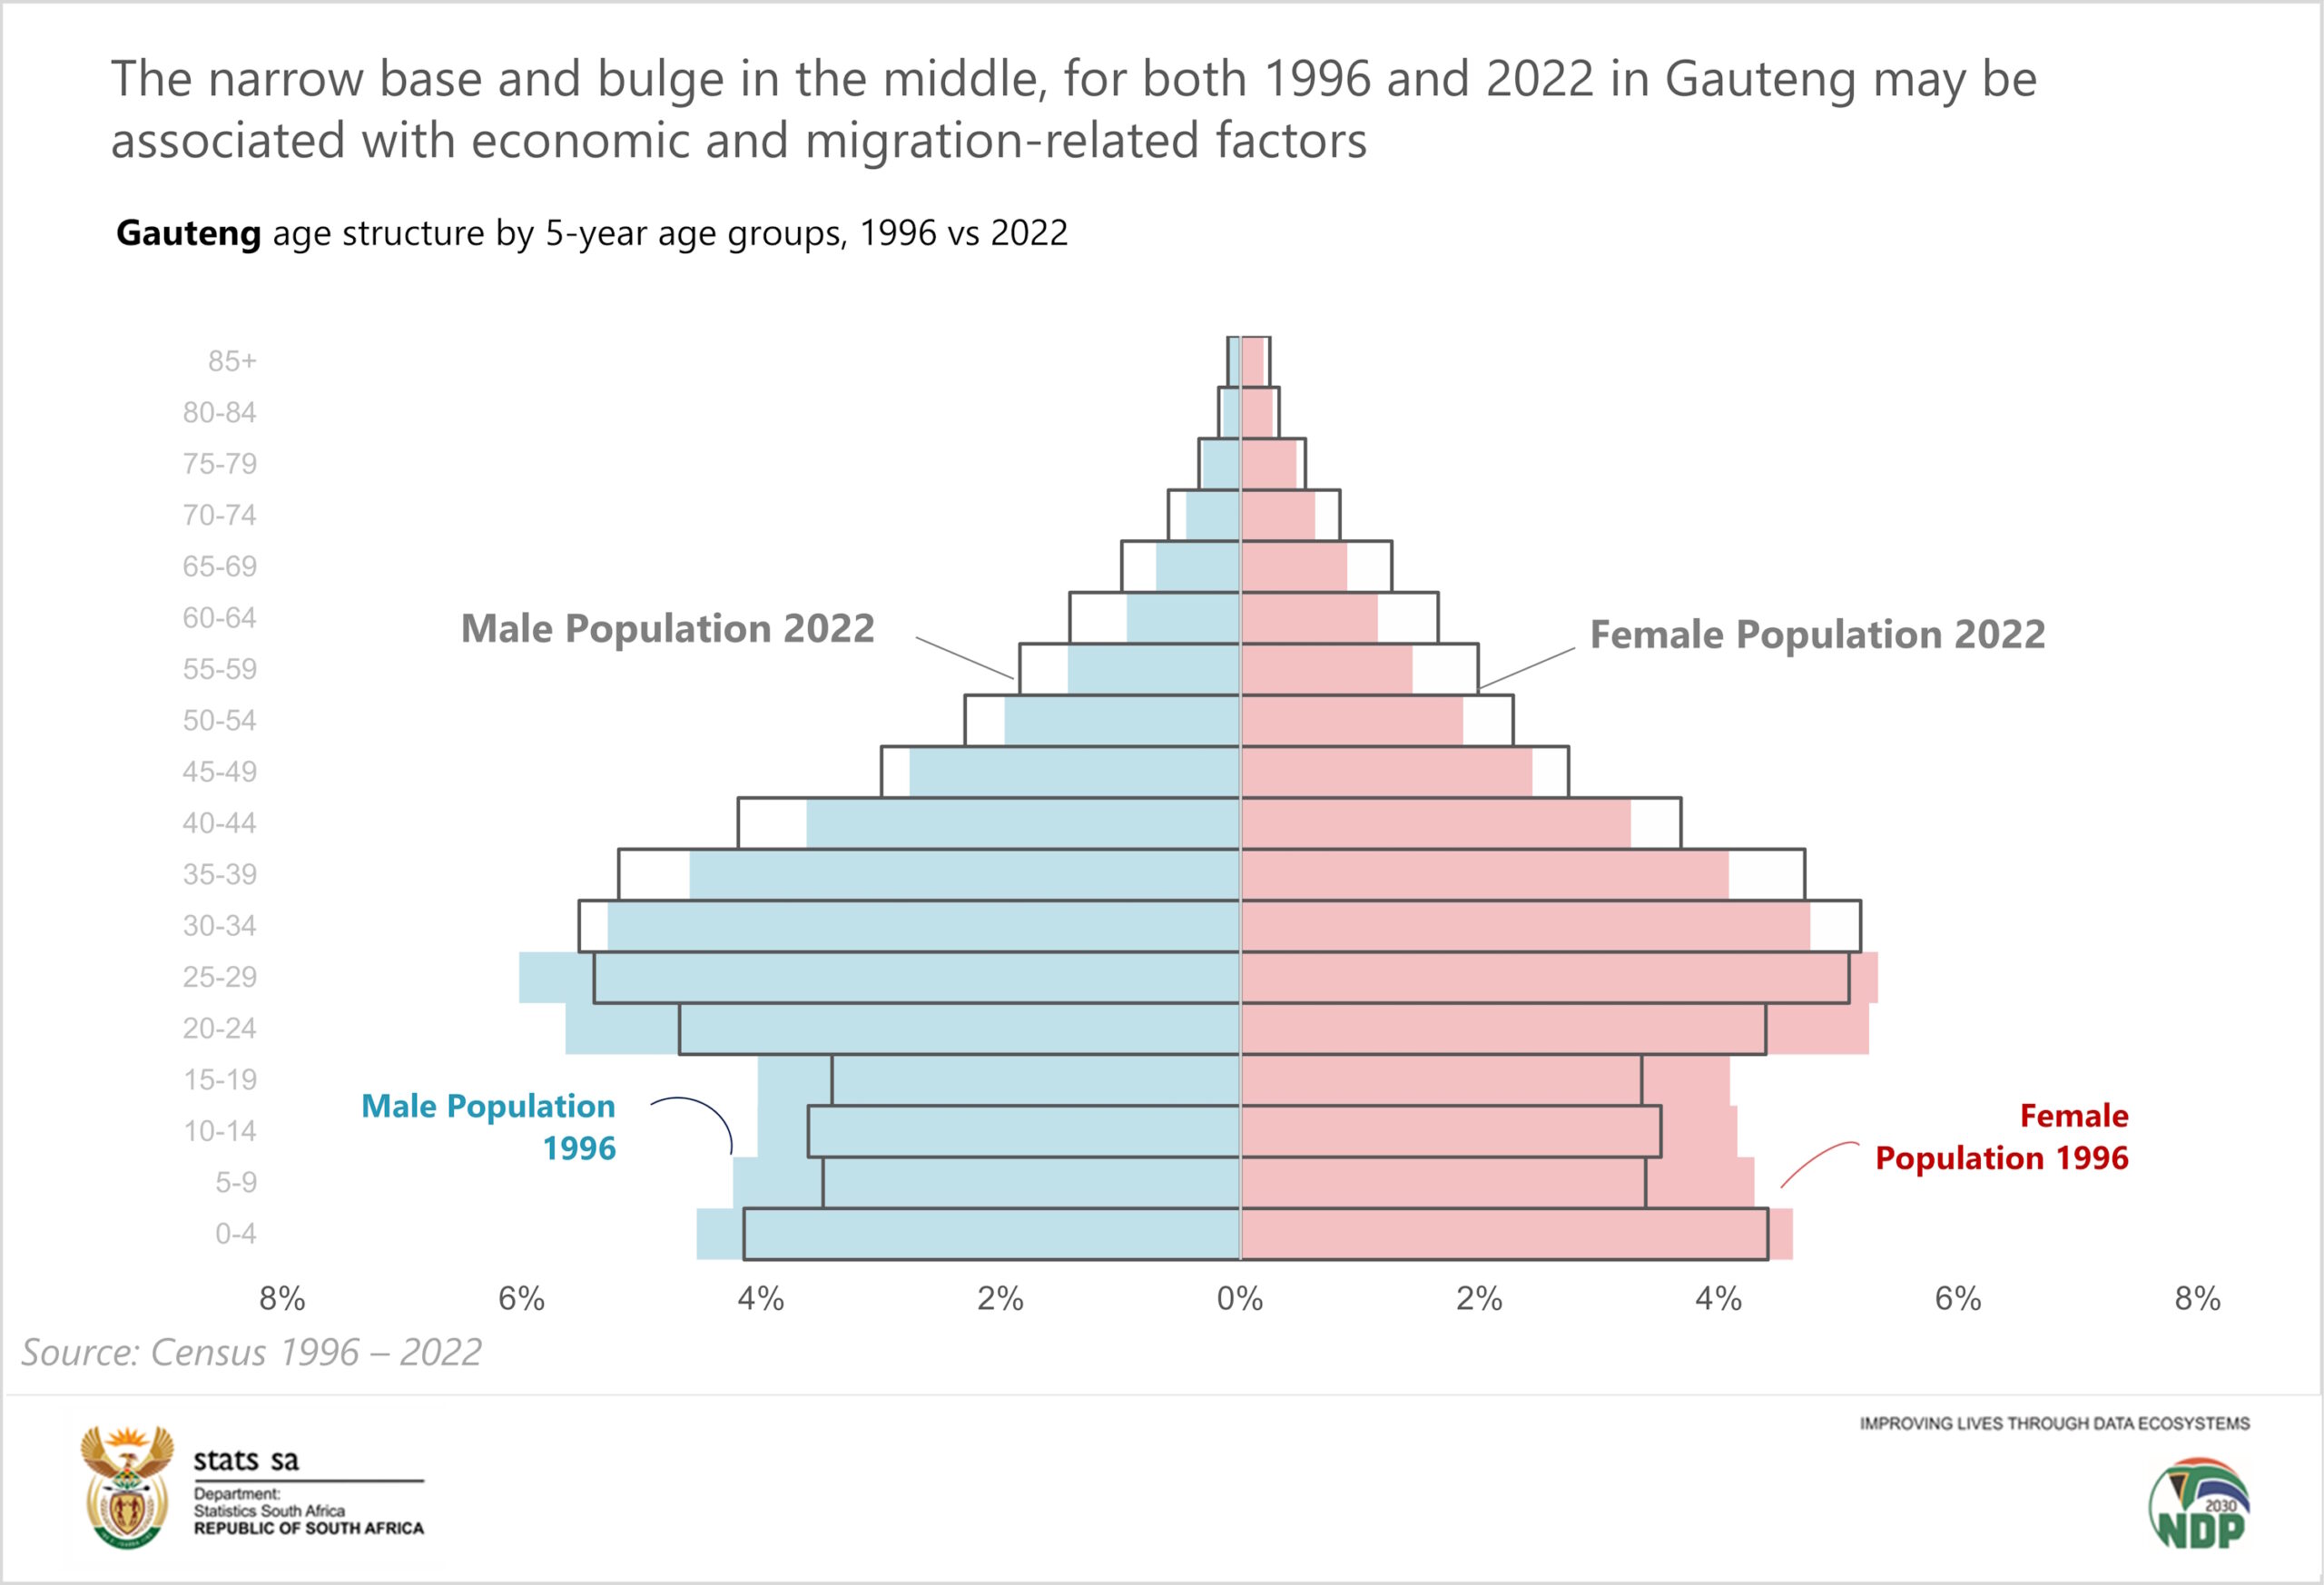
Figure 2.3 shows the Gauteng pyramid for 1996 and 2022. The narrow base and bulgy middle for both periods in may be associated with economic and migration-related factors, resulting in a large number of working-age population moving into the province.
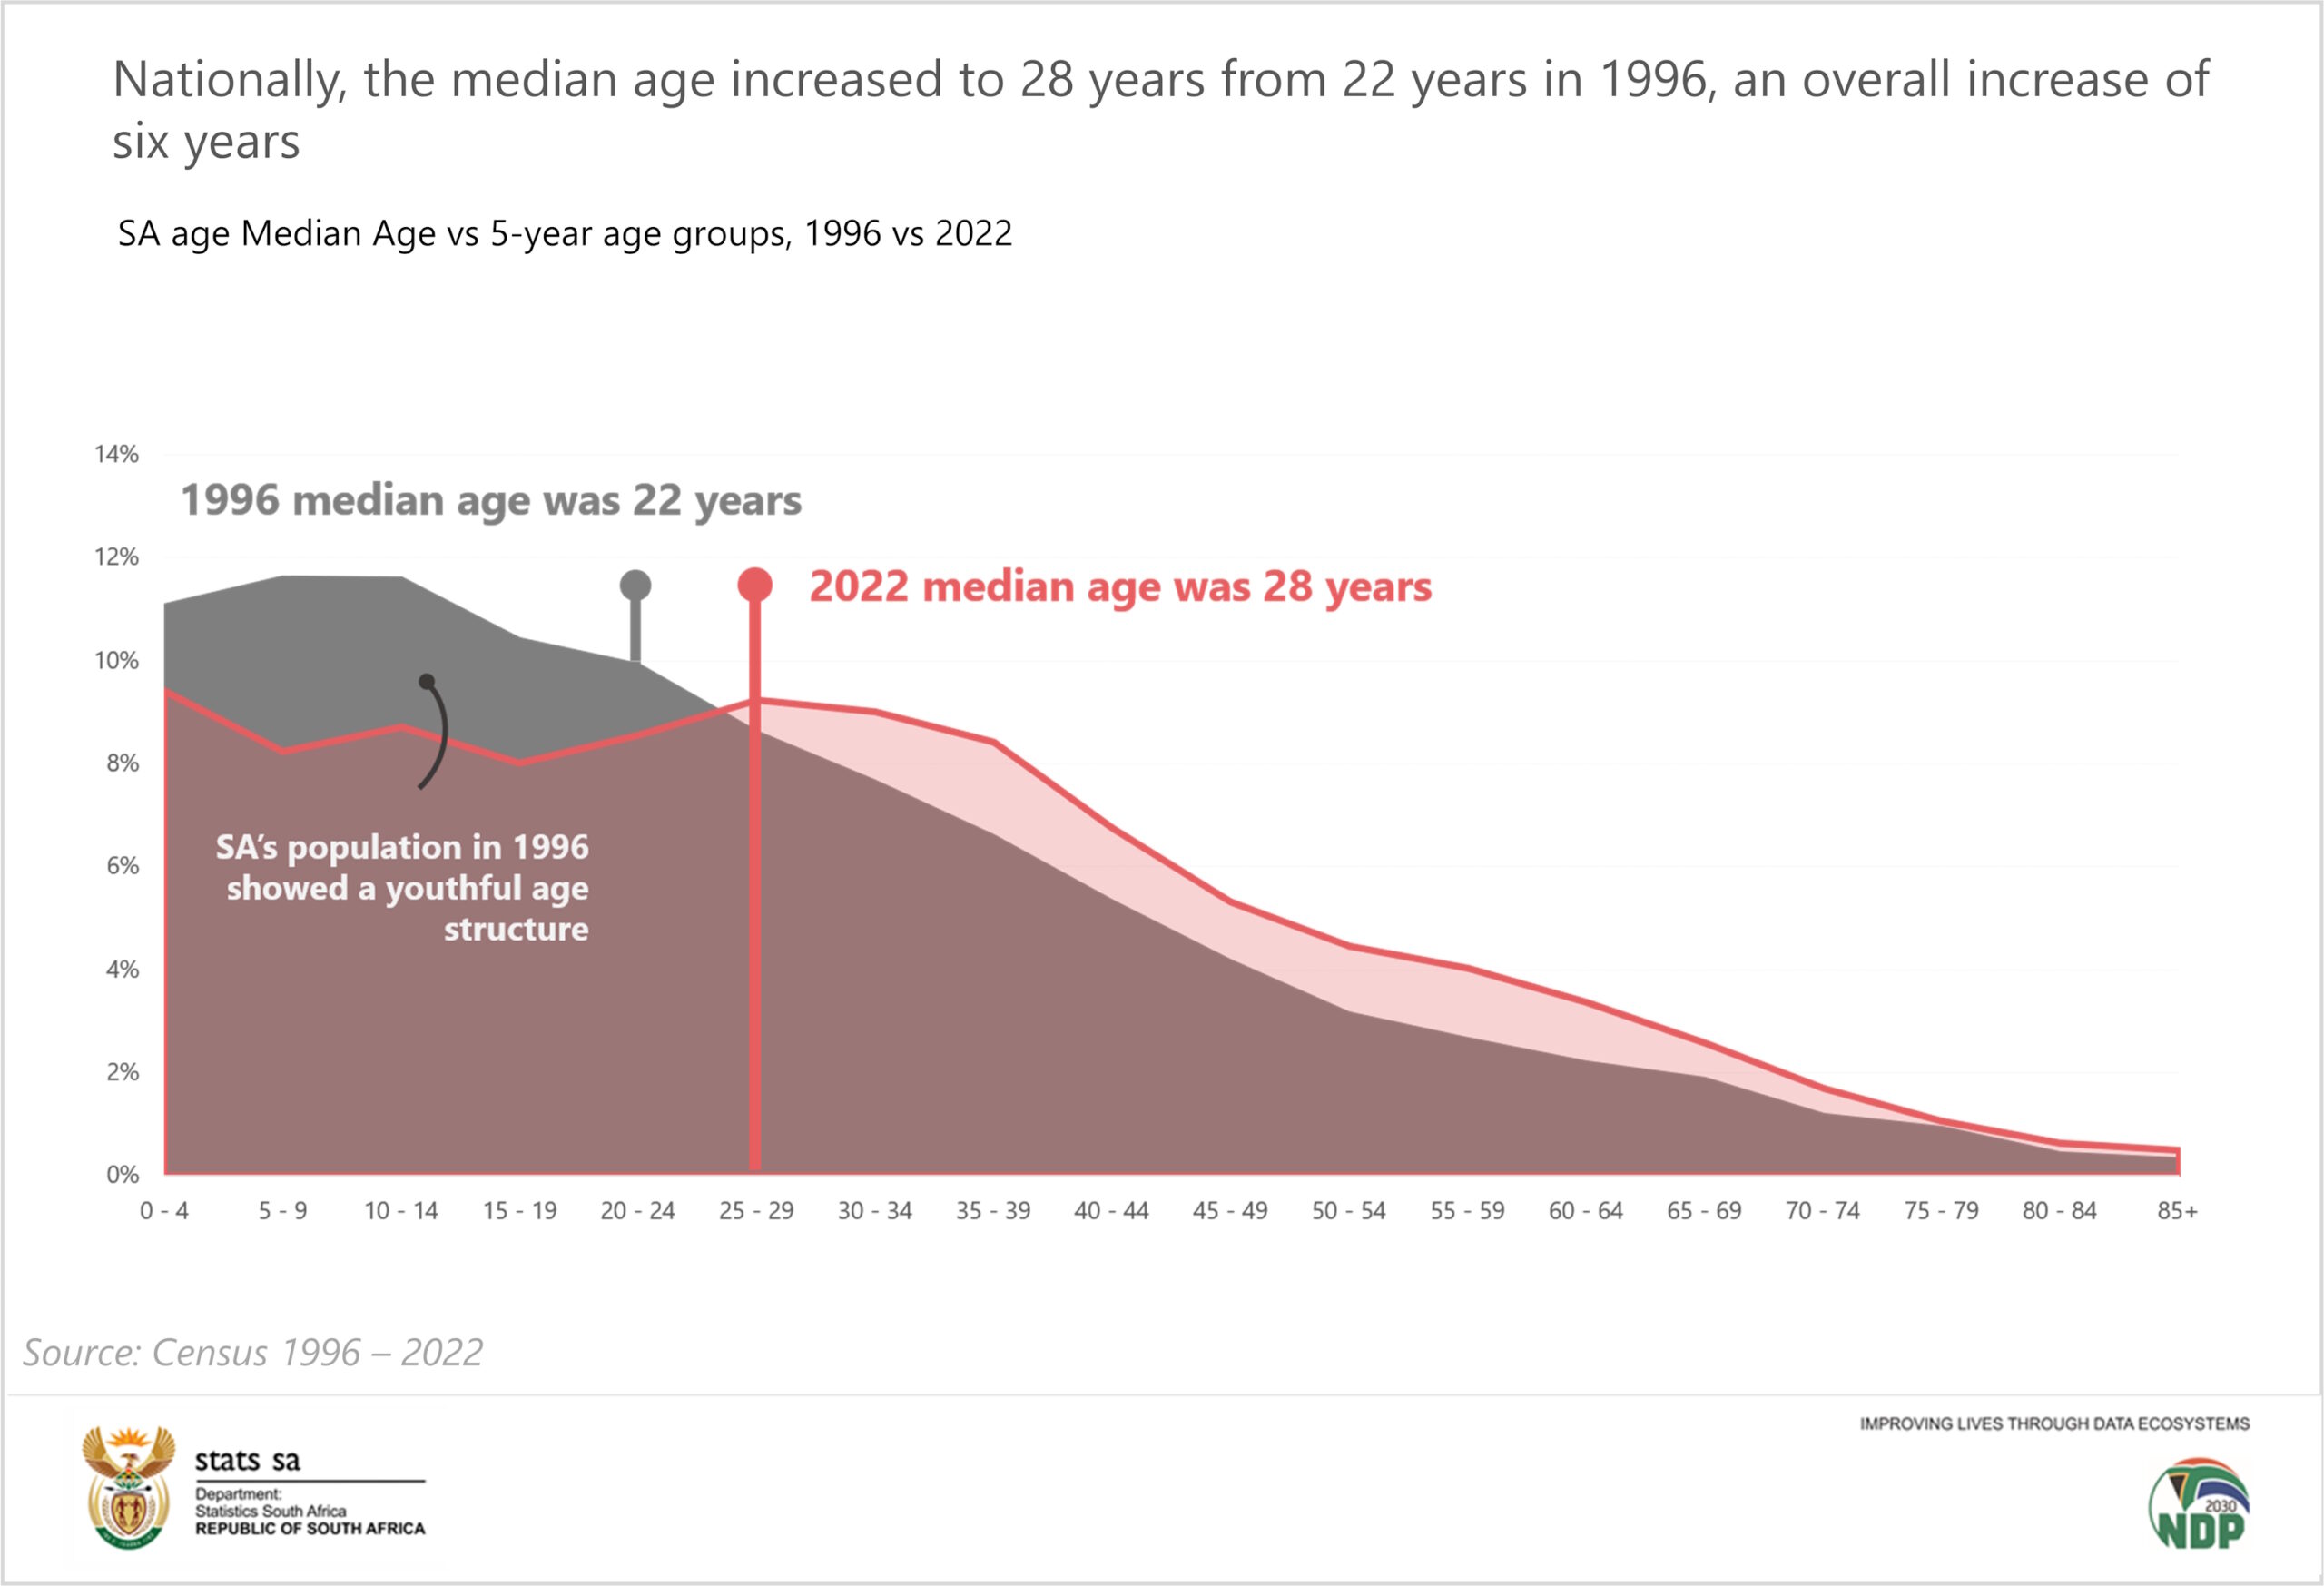
Median age, 1996 vs 2022
The median age measures the age above which one-half of the population is located and below which the other half is located. It provides an indication of whether the population is young, intermediate or old. Figure 2.4 shows the median age for Census 1996 to 2022. The results indicate that over time the median ages increased consistently, from 22 years in 1996 to 28 years in 2022, an overall increase of six years since 1996.
Results from Census 2022 show that eight in ten South Africans were black African, and less than one in ten were white in 2022. Black Africans remained the highest population group, increasing from 77% recorded in 1996 to 81,4% in 2022. On the other hand, the white population group declined from 11% in 1996 to 7,3% in 2022. The Indian/Asian population group remained below 3% across the four censuses, while the coloured population constituted 8,2% of the population in 2022.
Figure 2.5: Percentage distribution of population in South Africa by population group, Census 1996 – 2022
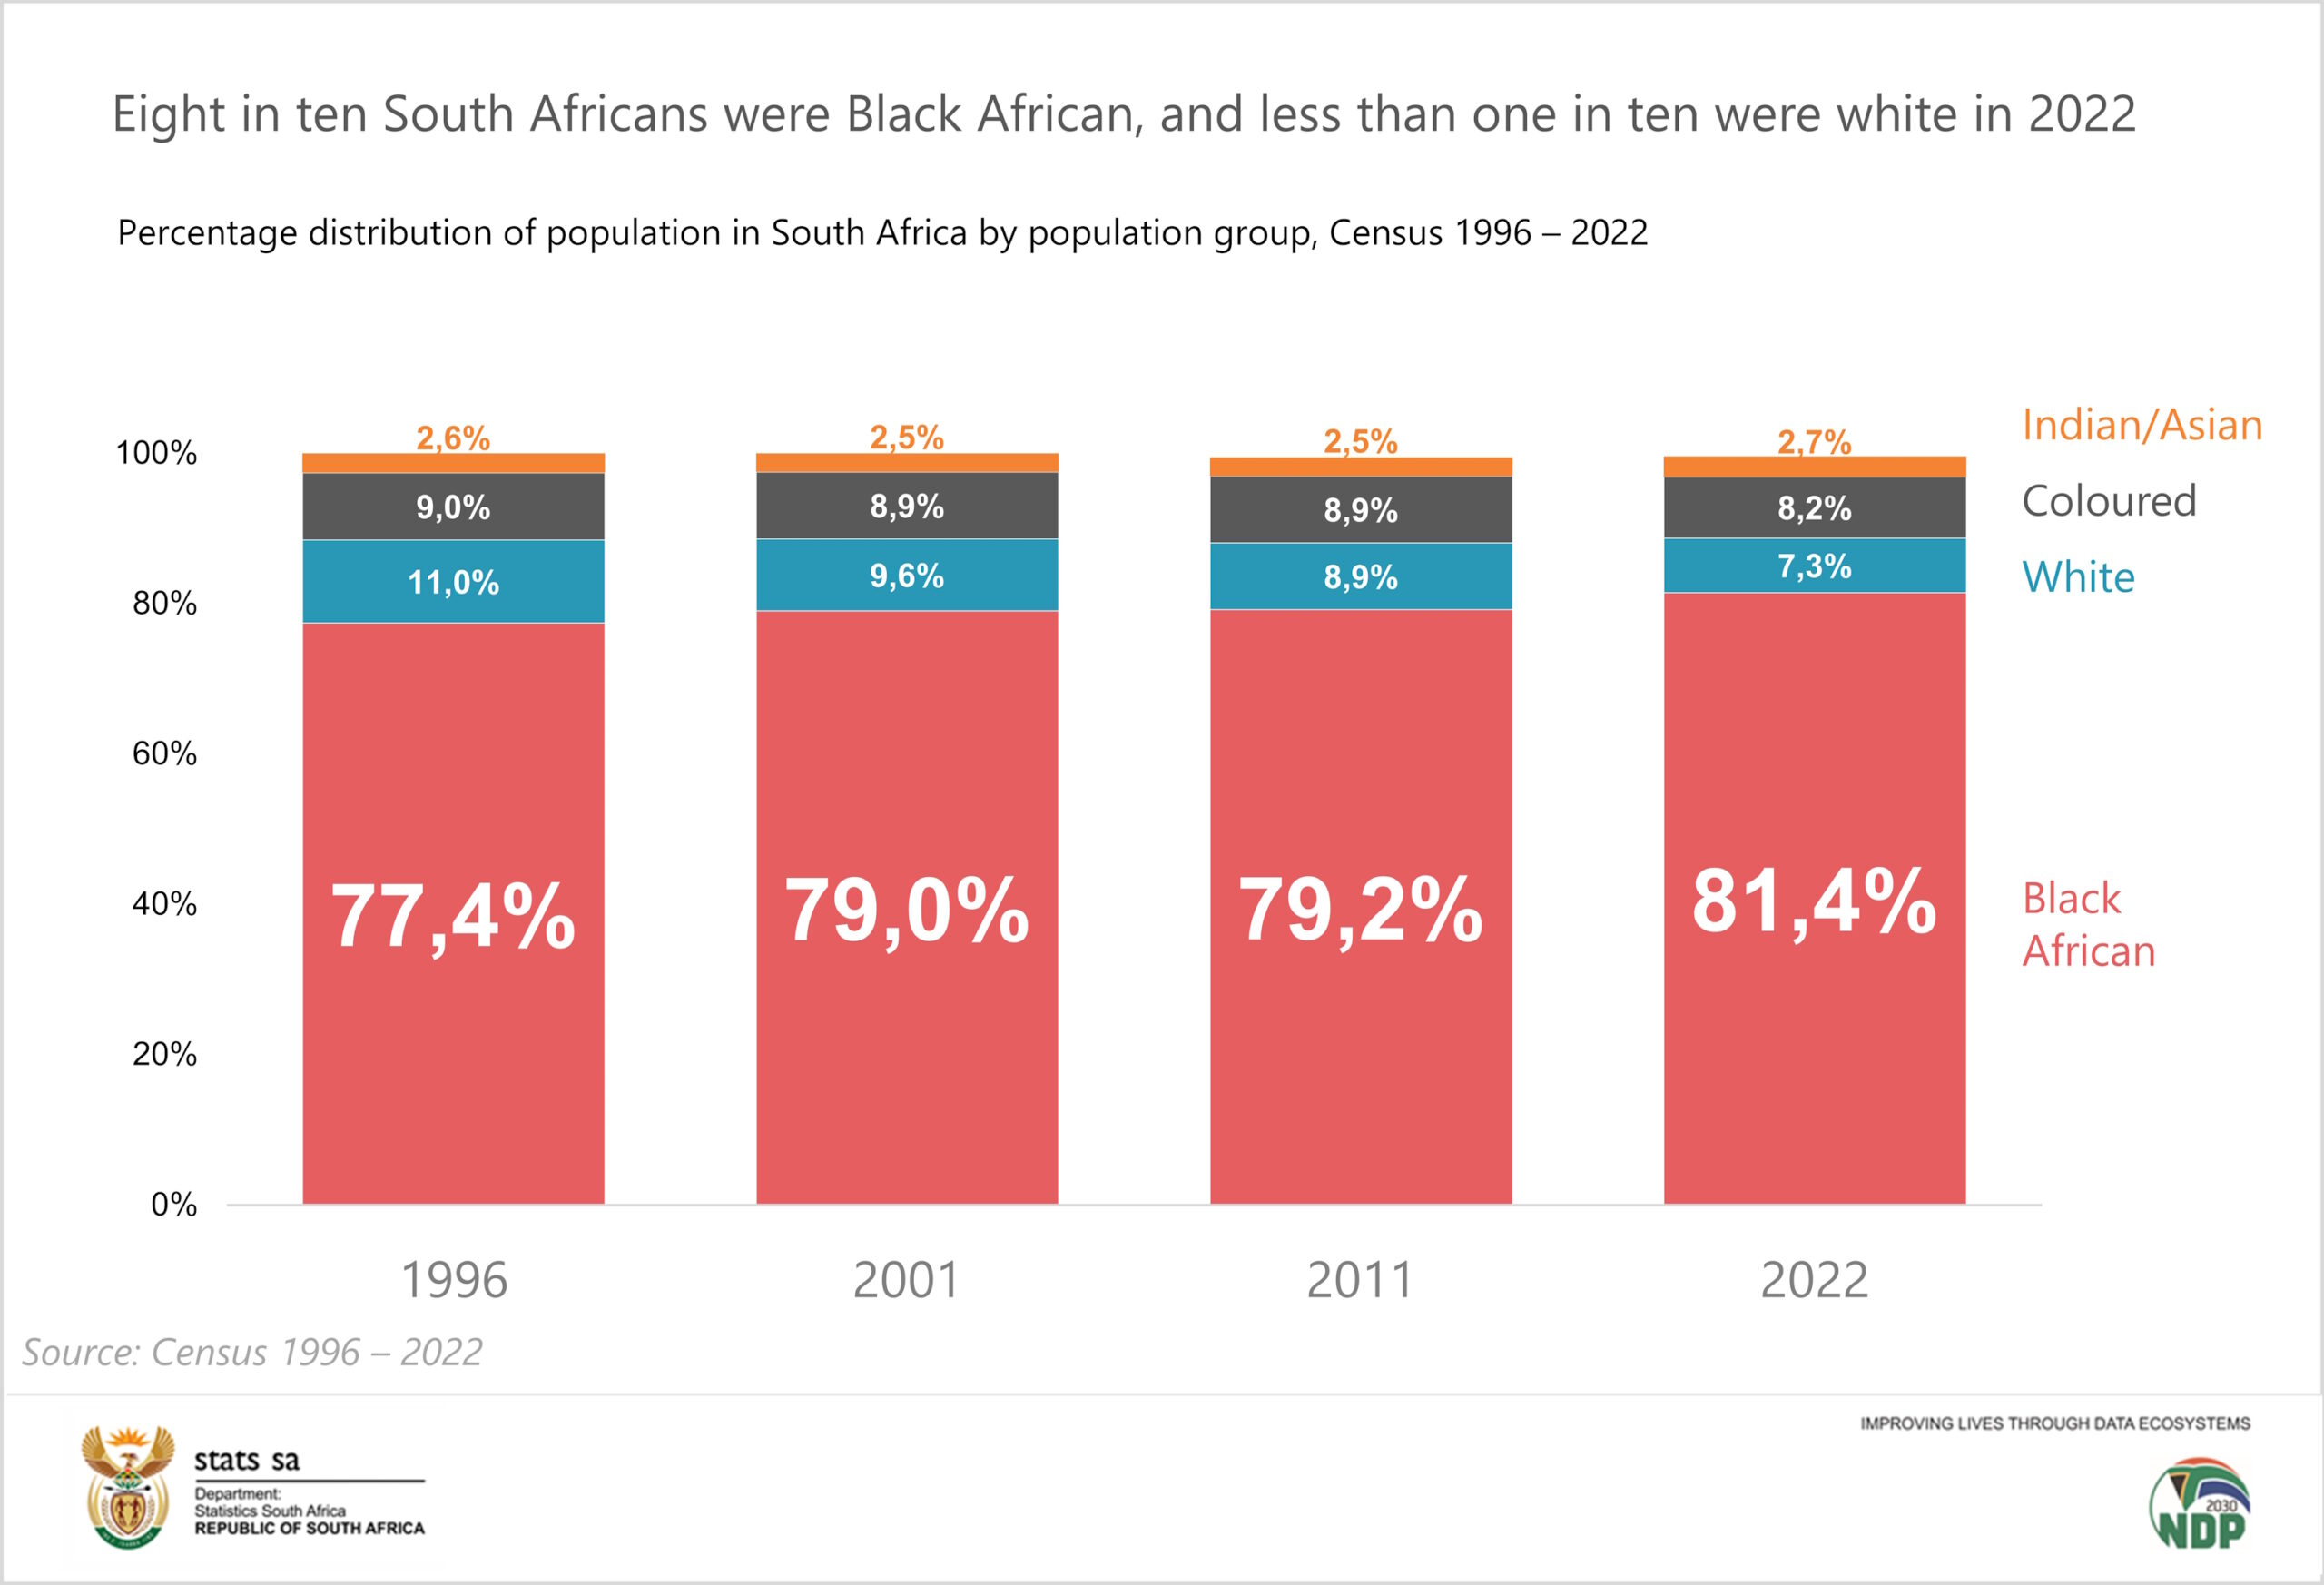
Figure 2.6 profiles dynamics in language most often spoken by households over the period 1996–2022. In 2022, isiZulu remained the most spoken language in the country, constituting almost a quarter (24,4%), followed by isiXhosa (16,3%) and Afrikaans (10,6%). The findings showed a downward trend in persons who speak Afrikaans (from 14,5% in 1996 to 10,6% in 2022), followed by isiXhosa speakers. The proportion of persons who speak English, Xitsonga and Tshivenda remained relatively stable. The results further showed that less than 1% of the population communicated using sign language in both Censuses 2011 and 2022. Sign language was promulgated as South Africa’s 12th official language in July 2023. As such, it is recognised by law as one of the official languages.
Figure 2.6: Percentage distribution of languages most often spoken in the household, Census 1996 – 2022
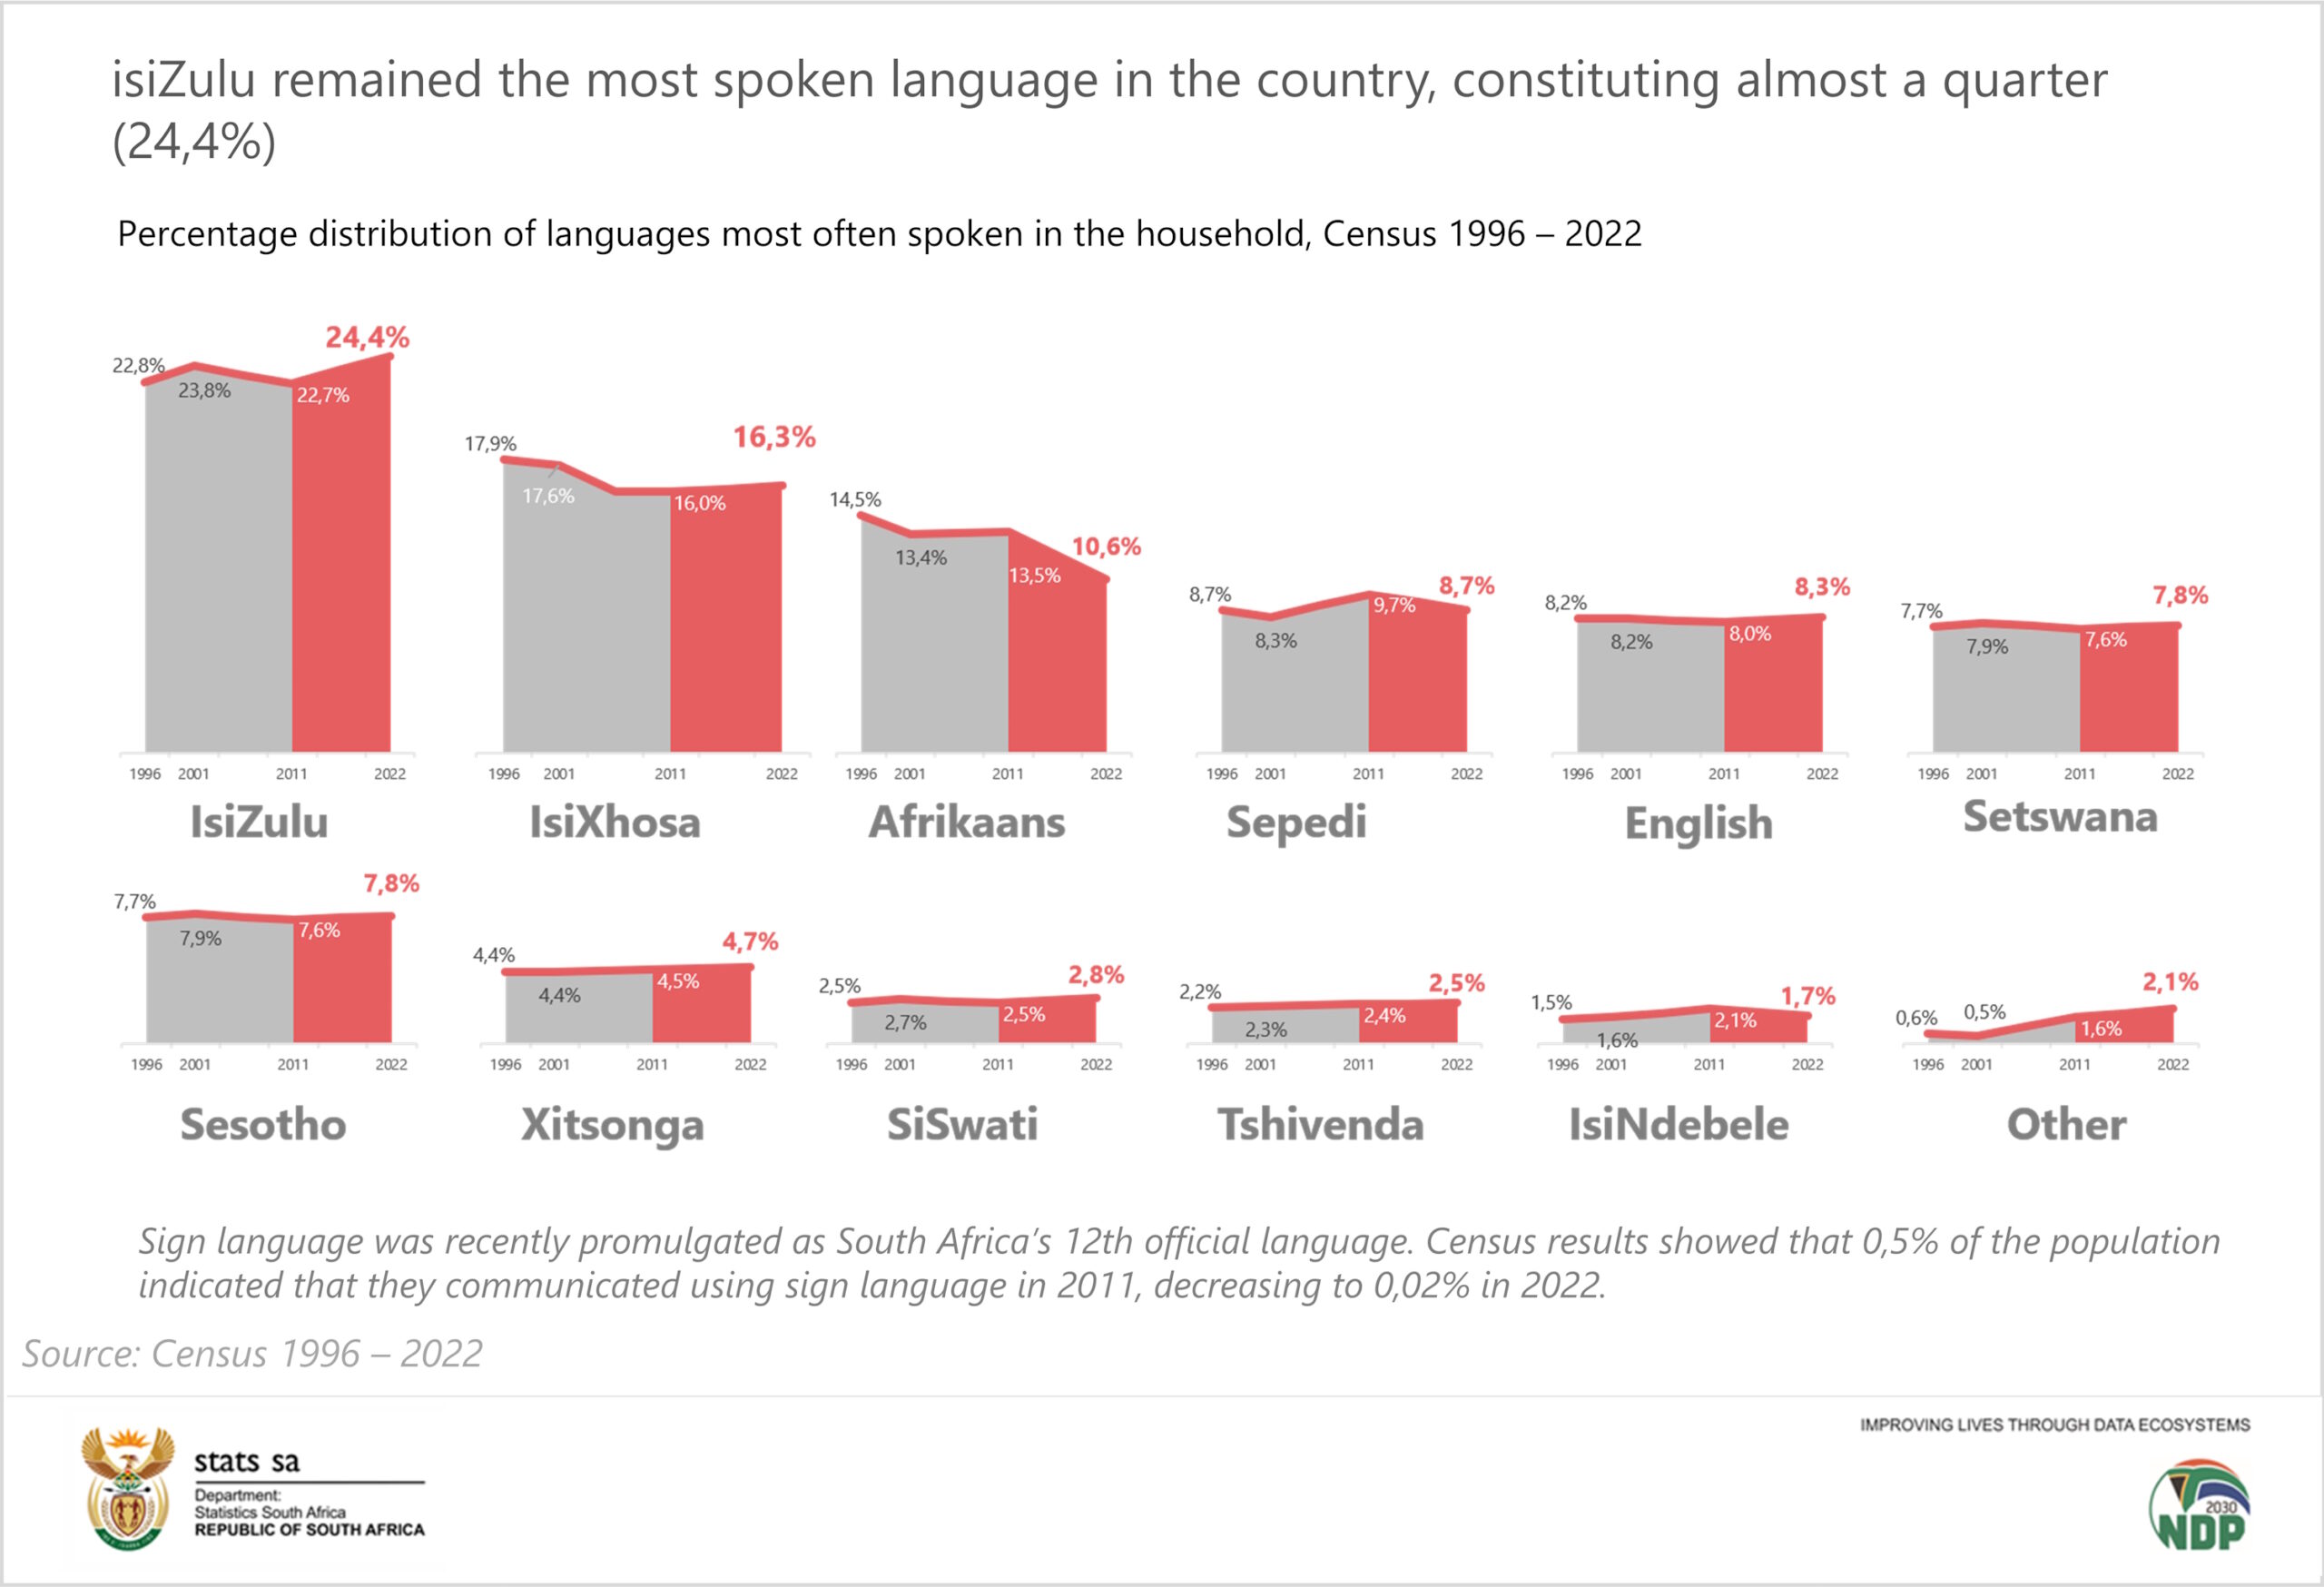
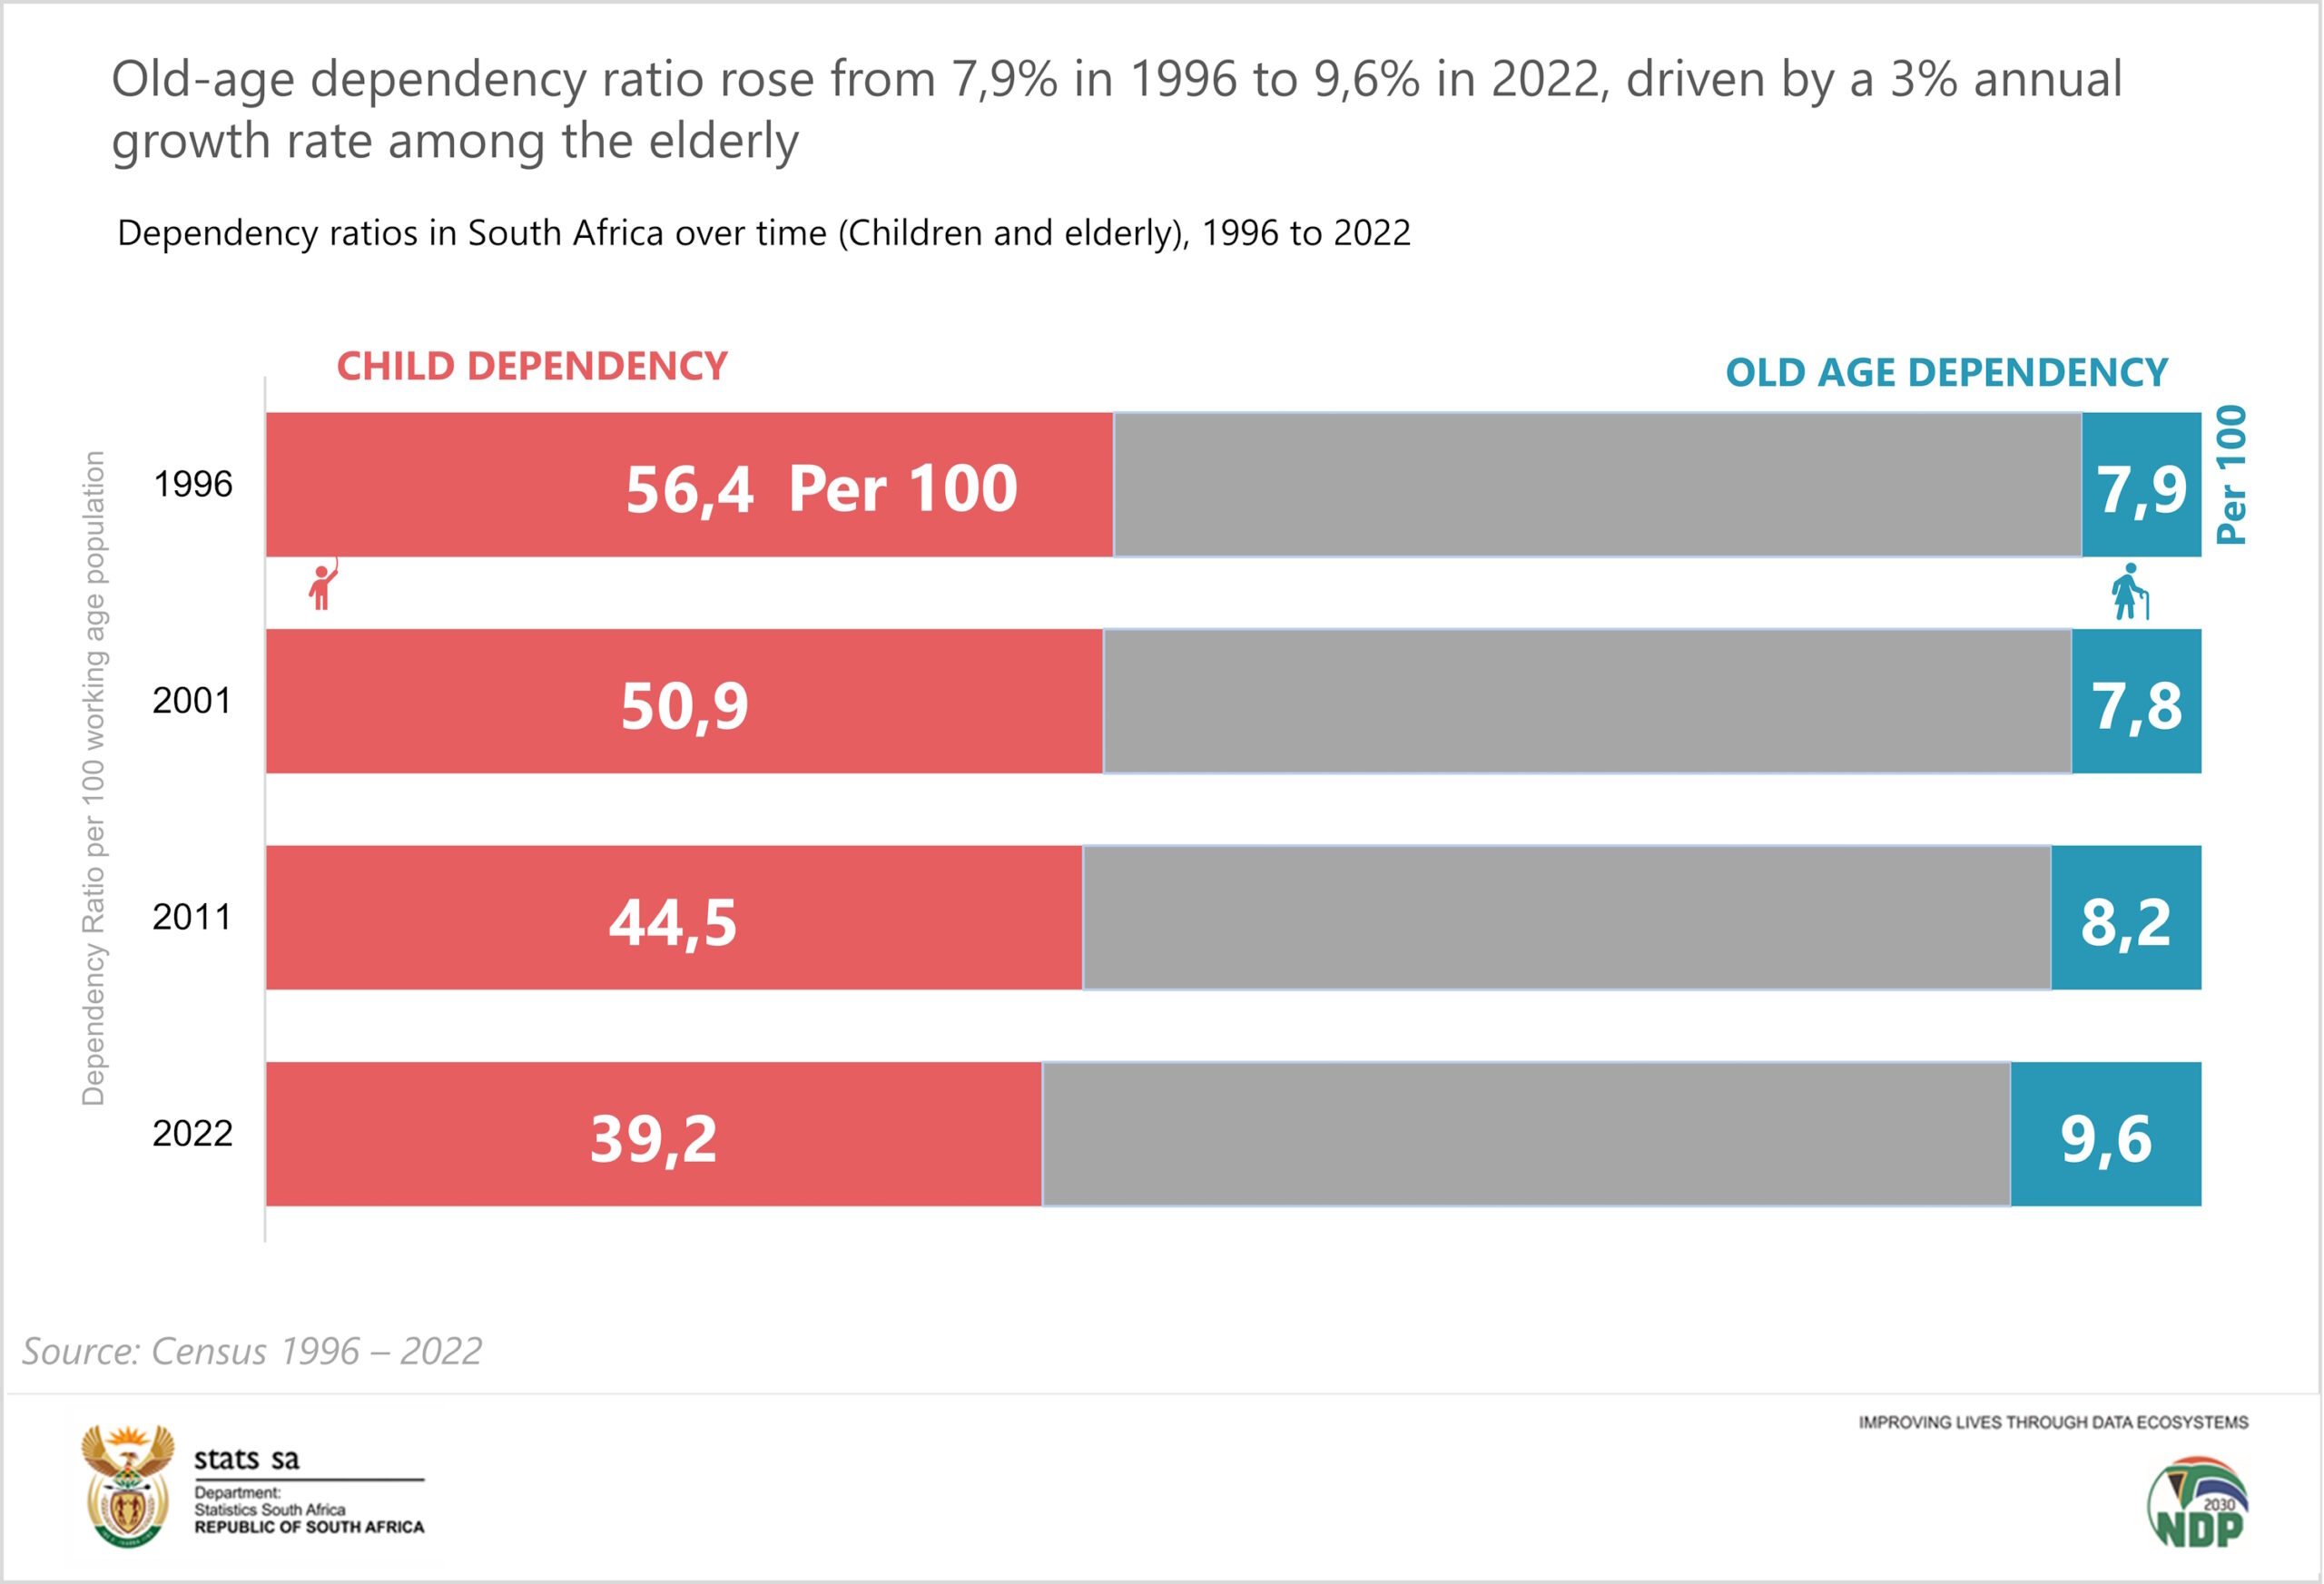
Figure 2.7 illustrates the evolution of dependency ratios in South Africa across the four census periods. The dependency ratio is defined as the number of children (0-14 years) and older (65 years and older) persons per hundred persons of working age (15-64 years old). It can be expressed as the sum of the child dependency ratio and the old-age dependency ratio (United Nations, 2022[i]).
Over the 26-year period, the national dependency ratio declined significantly from 64,4% in 1996 to 48,8% in 2022. This shift reflects a demographic dividend, characterized by an expanding working-age population relative to dependents. This contraction was primarily driven by a substantial reduction in the child dependency ratio, which dropped from 56,4% to 39,2%, indicating a declining youth cohort relying on the workforce. On the other hand, the old-age dependency ratio rose from 7,9% in 1996 to 9,6% in 2022. Driven by a 3% annual growth rate among the elderly, this increase emphasizes a gradual aging trend within the South African population relative to the active labour force.
Demographic Dividend
Over the period 1996-2022, the population size and structure in terms of functional age groups (0-14, 15-34, 35-64 and 65 years and older persons) depict sharp decline in child dependency (from 56,4% to 39,2%), and modest increase in old-age dependency (from 7,9% to 9,6%).
This shift reflects an expanding working-age population relative to dependents; a pattern associated with the demographic dividend. The profiled demographic shift is consistent with the condition-associated demographic dividend characterised by a growing working-age population relative to dependents.
[i] United Nations Conference on Trade and Development, (2022). UNCTAD handbook of statistics 2022: Population. United Nations. https://unctad.org/system/files/official-document/tdstat47_FS11_en.pdf