

The construction industry in South Africa has faced numerous challenges over the years. Some of the key contributing factors, according to Infrastructure South Africa,1 were slow economic growth, low investment, loadshedding, labour shortages, the COVID-19 pandemic and criminal activity.
According to gross domestic product (GDP) estimates, construction’s contribution to national economic activity peaked at 4,2% of value added (in current prices) in 2008. Since then, its contribution has slowly decreased to 2,4% in 2024 and 2,3% in 2025. The size of the construction industry has also waned. In 2016, the industry was valued at R156,0 billion (in constant prices), gradually shrinking to R103,6 billion in 2024 and R99,1 billion in 2025.2
The recent release of the Construction Industry 2024 statistical report provides a detailed update of several indicators. Based on a large sample survey of enterprises registered for value-added tax (VAT), the report covers data on finances, employment, details of services, details of purchases, the industry’s client base and ICT usage.
Below are three notable trends drawn from the report.
1. Large firms have given way to smaller players
The challenging conditions experienced by the industry saw several large construction companies enter business rescue, such as Group Five, Basil Read and Murray & Roberts. The declining influence of large, once well-established firms may have opened some room for small and micro enterprises.
Two indicators shed light on this. First, small and micro enterprises now account for a larger share of construction income. In 2014, small and micro enterprises were responsible for 25,0% of total income,3 rising to 32,2% in 2024.
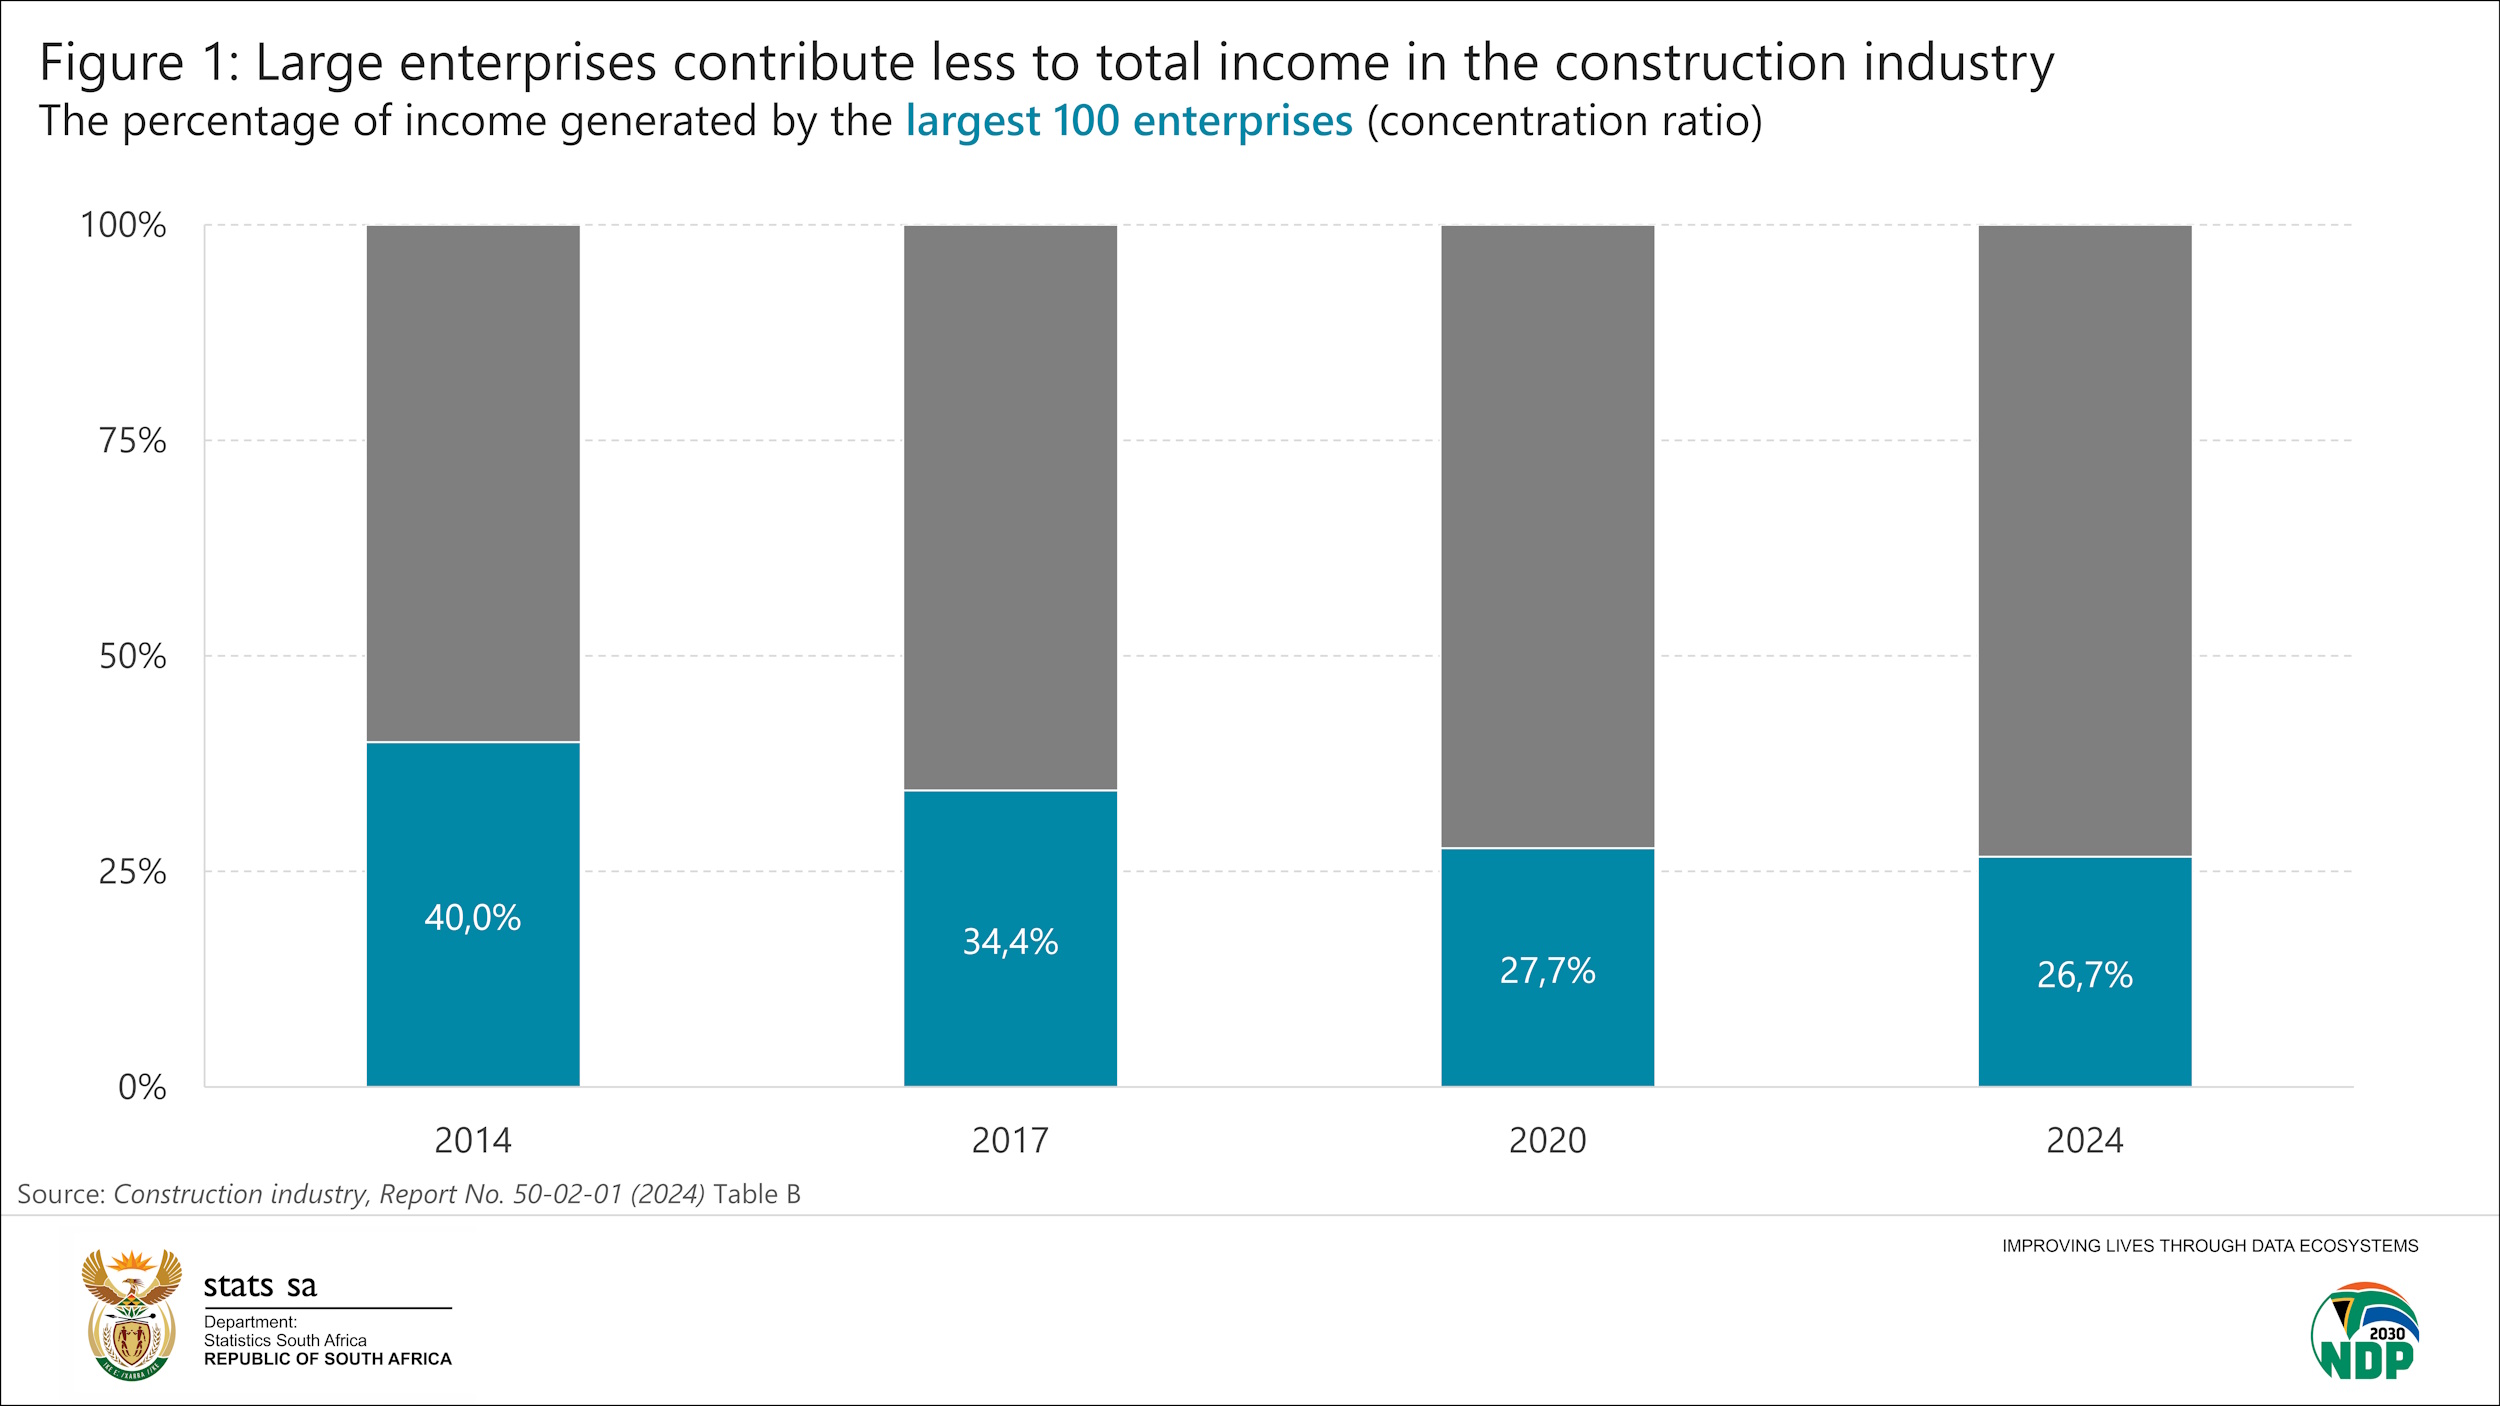
Second, the industry has become more diverse as large enterprises have waned, according to the concentration ratio. This ratio indicates the share of total income in an industry that the largest enterprises produce. A high concentration ratio (i.e. near 100%) is an indication that a few, large enterprises dominate. A low ratio (i.e. near 0%) means that there is more diversity, with income that is more equally distributed. In the construction industry, the largest 100 firms accounted for 40,0% of total income in 2014, declining to 26,7% in 2024 (see Figure 1 below).
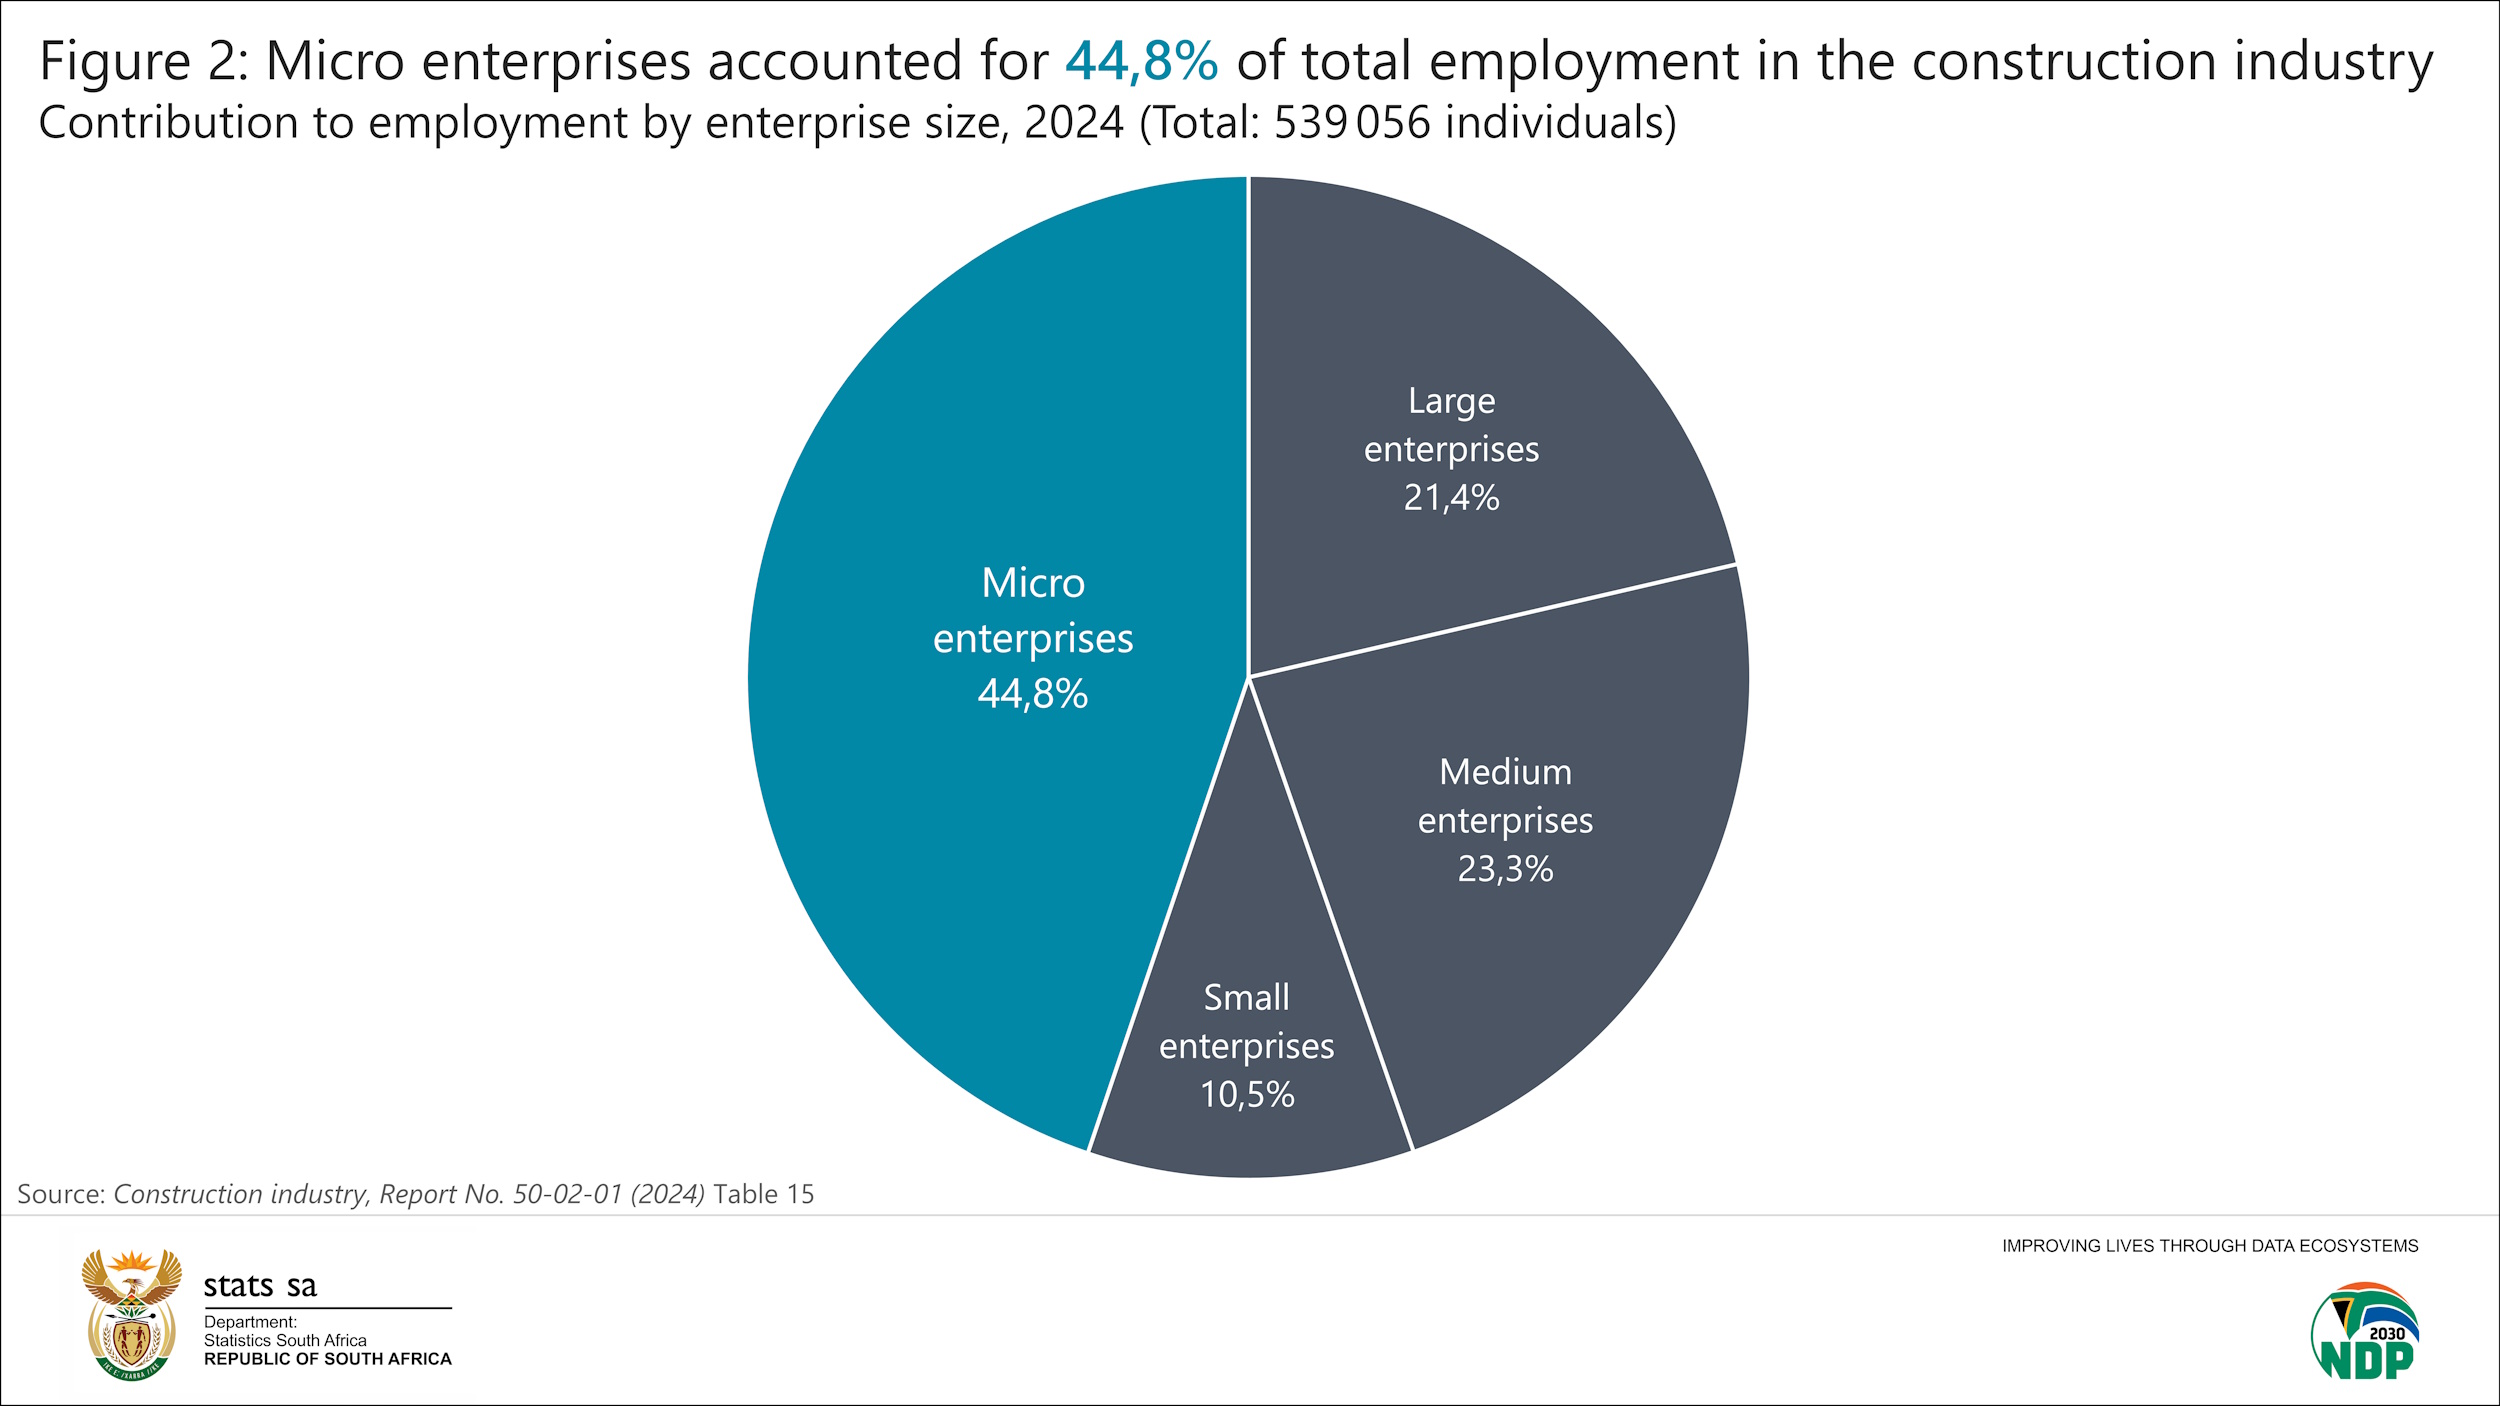
Smaller firms have also made inroads in the job market. Together, small and micro enterprises accounted for 55,3% of construction jobs in 2024, up from 40,6% in 2014.3 Micro enterprises in particular have the largest influence, contributing 44,8% to total employment in 2024 (see Figure 2 below).
2. Employment: No clear long-term trend
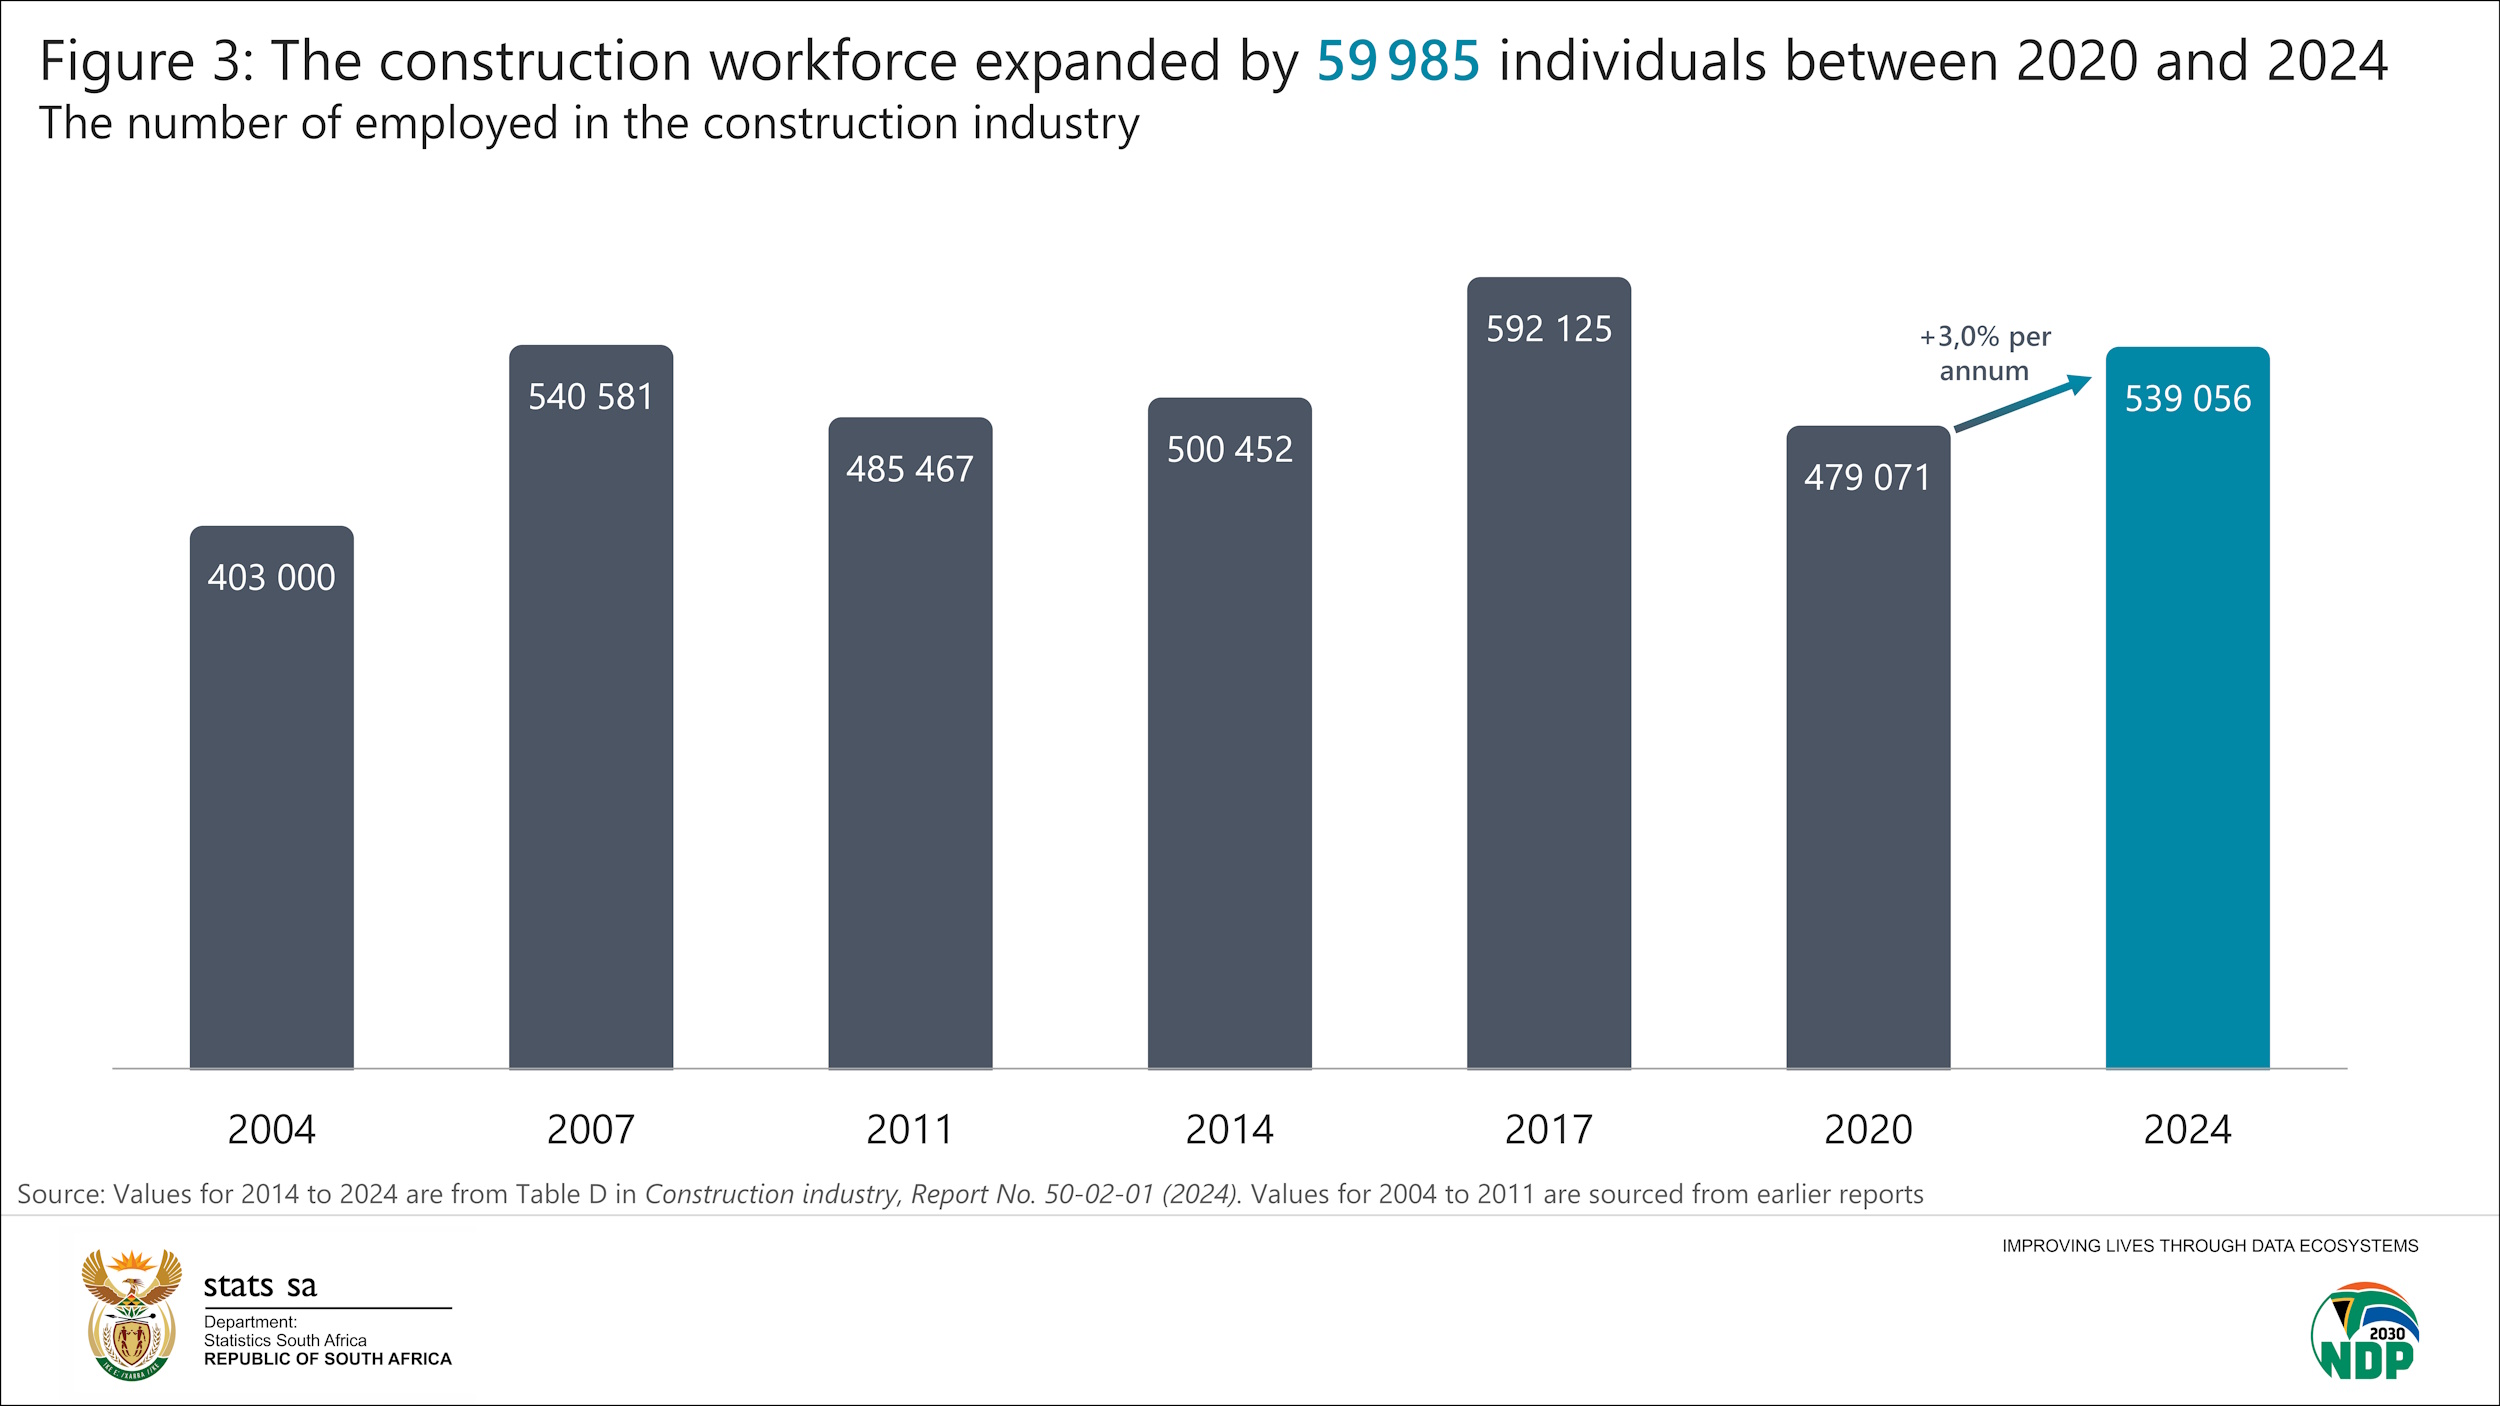
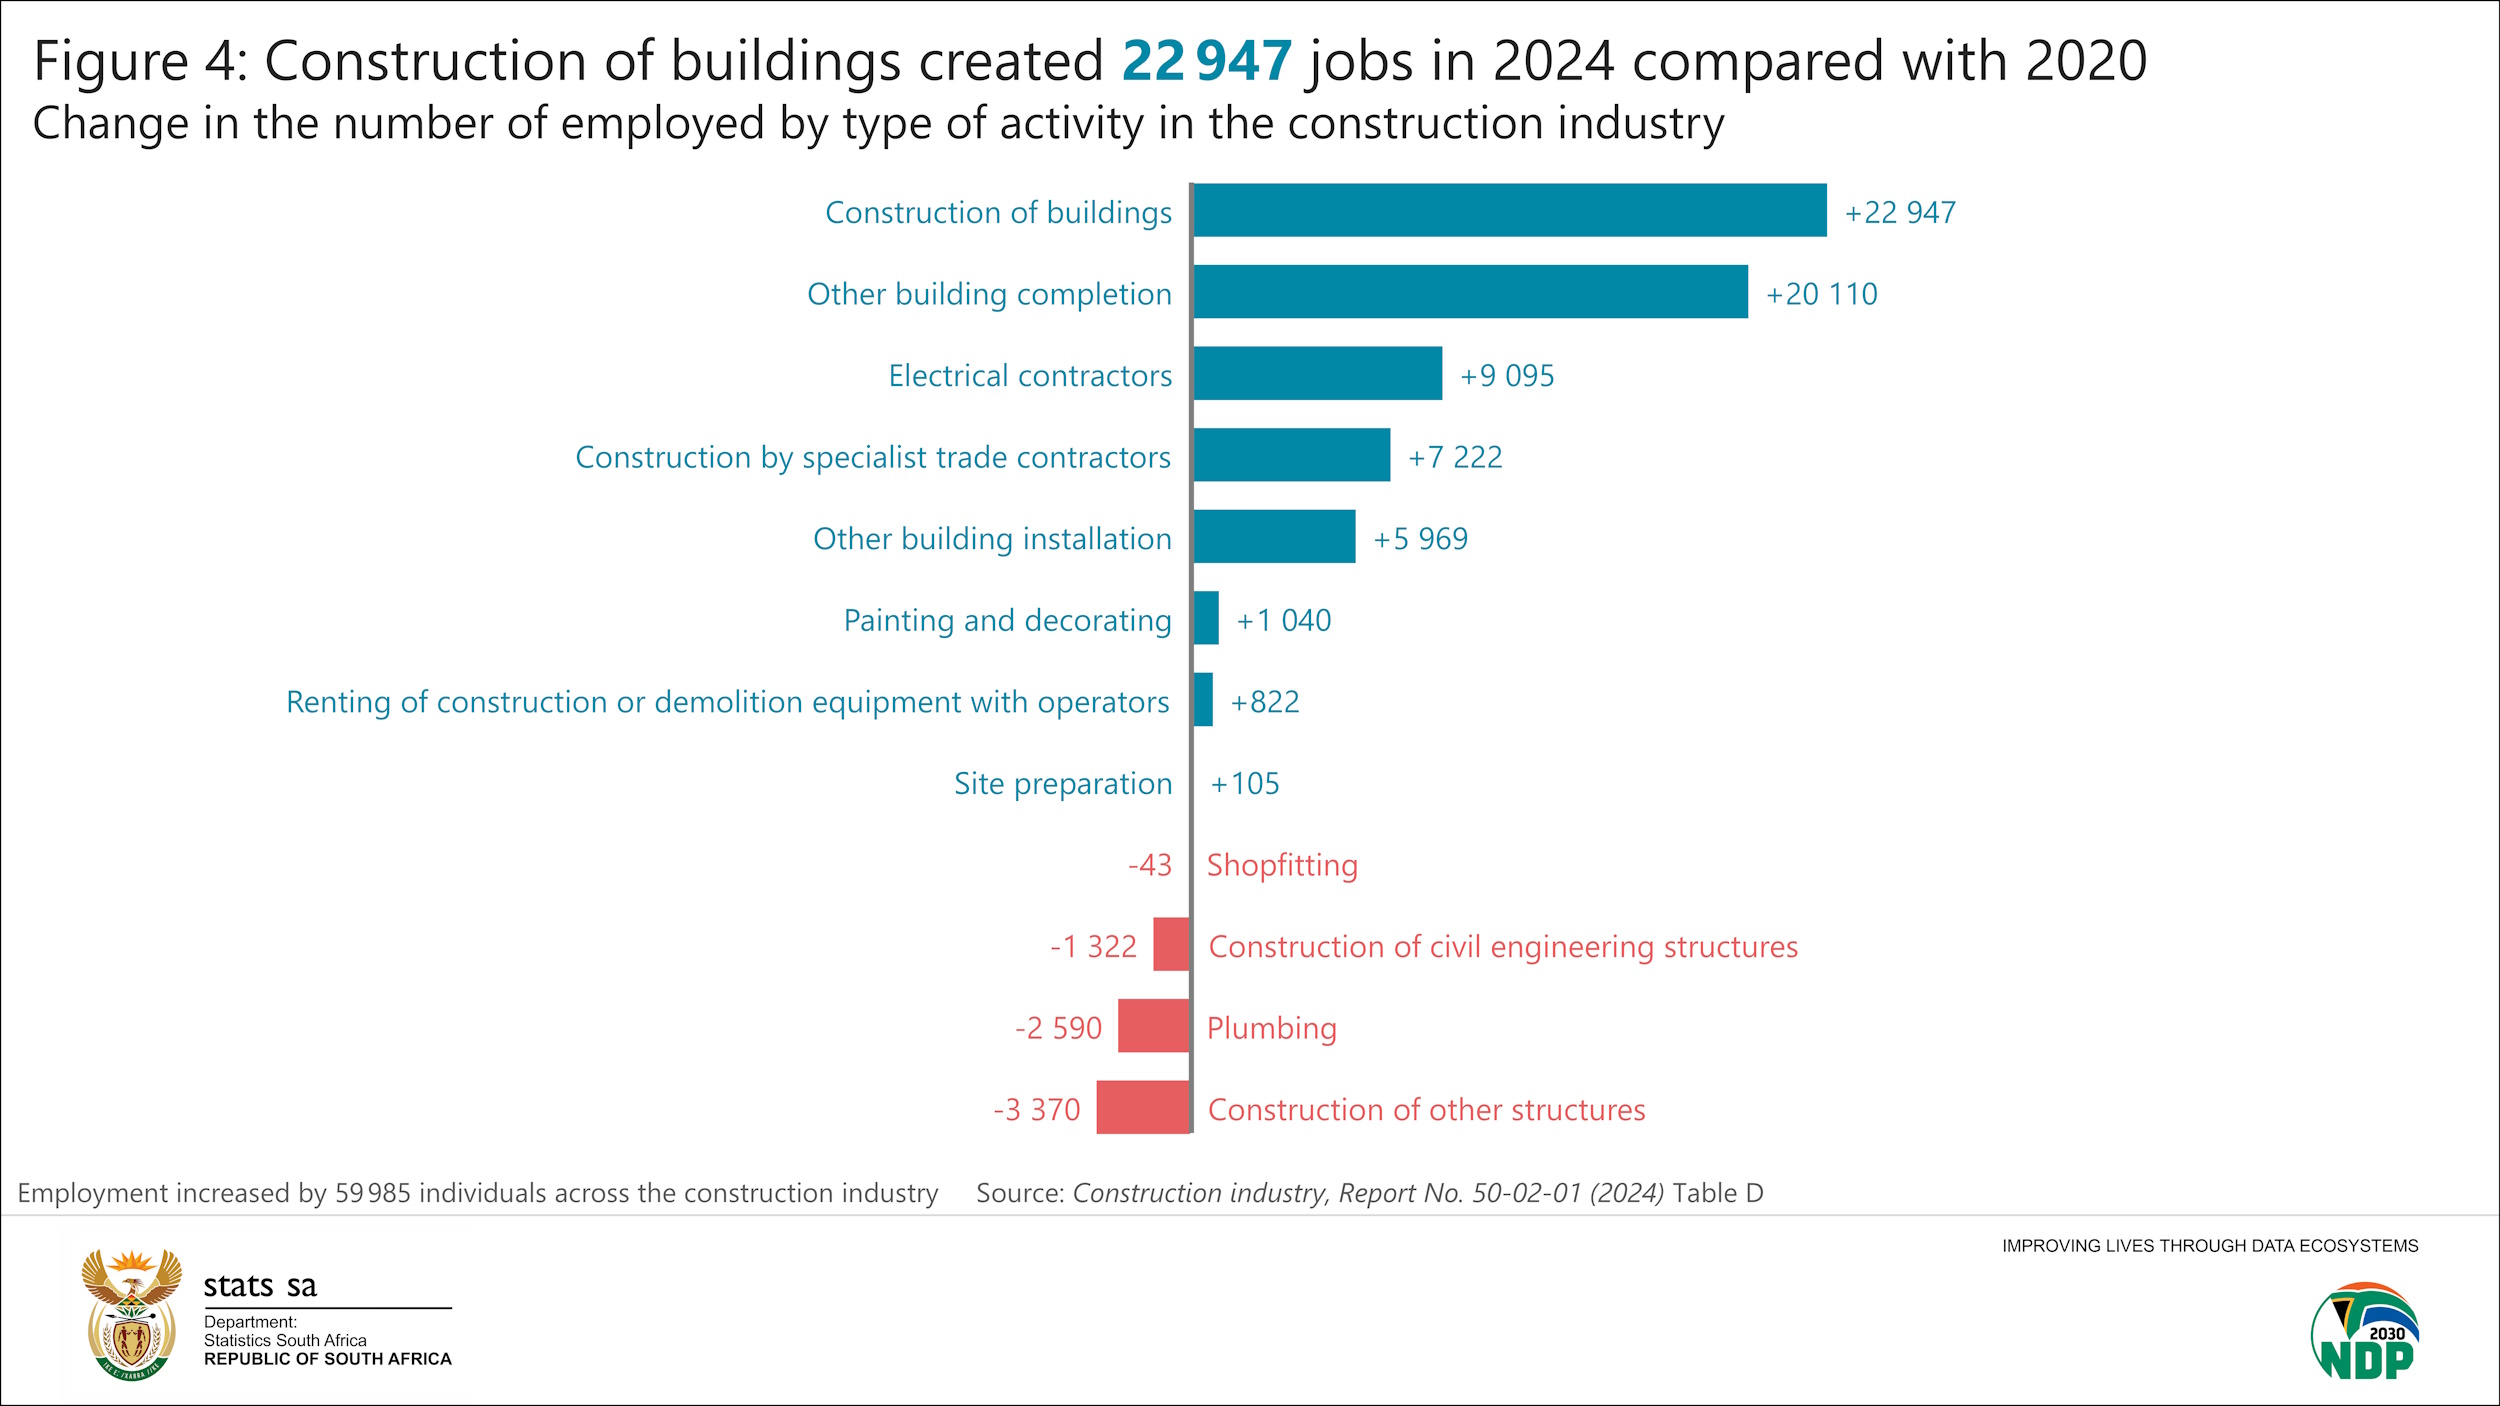
Total employment in the construction industry has fluctuated over the years, but without a clear long-term trend (see Figure 3 below). The industry created 59 985 jobs in 2024 compared with 479 071 jobs in 2020, representing a rise of 3,0% per annum. Despite this increase, the workforce in 2024 was still smaller than in 2017. The decline in jobs in 2020 must be seen in the context of the response to the COVID-19 pandemic.
The increase in the number of employees in 2024 was driven by 8 of 12 construction activities listed in Figure 4. The construction of buildings was the most significant positive contributor, creating 22 947 jobs. On the downside, shopfitting, construction of civil engineering structures, plumbing and construction of other structures recorded declines.
3. Gauteng dominates, but it has lost ground
Stats SA’s latest provincial GDP estimates show that South African construction is mainly concentrated in Gauteng, Western Cape and KwaZulu-Natal.4
The Construction Industry 2024 statistical report supports this finding. Provincial data on income from services rendered, salaries and wages and employment are shown in Figure 5 below. Together, Gauteng, Western Cape and KwaZulu-Natal dominate all three variables, with Gauteng in the lead.
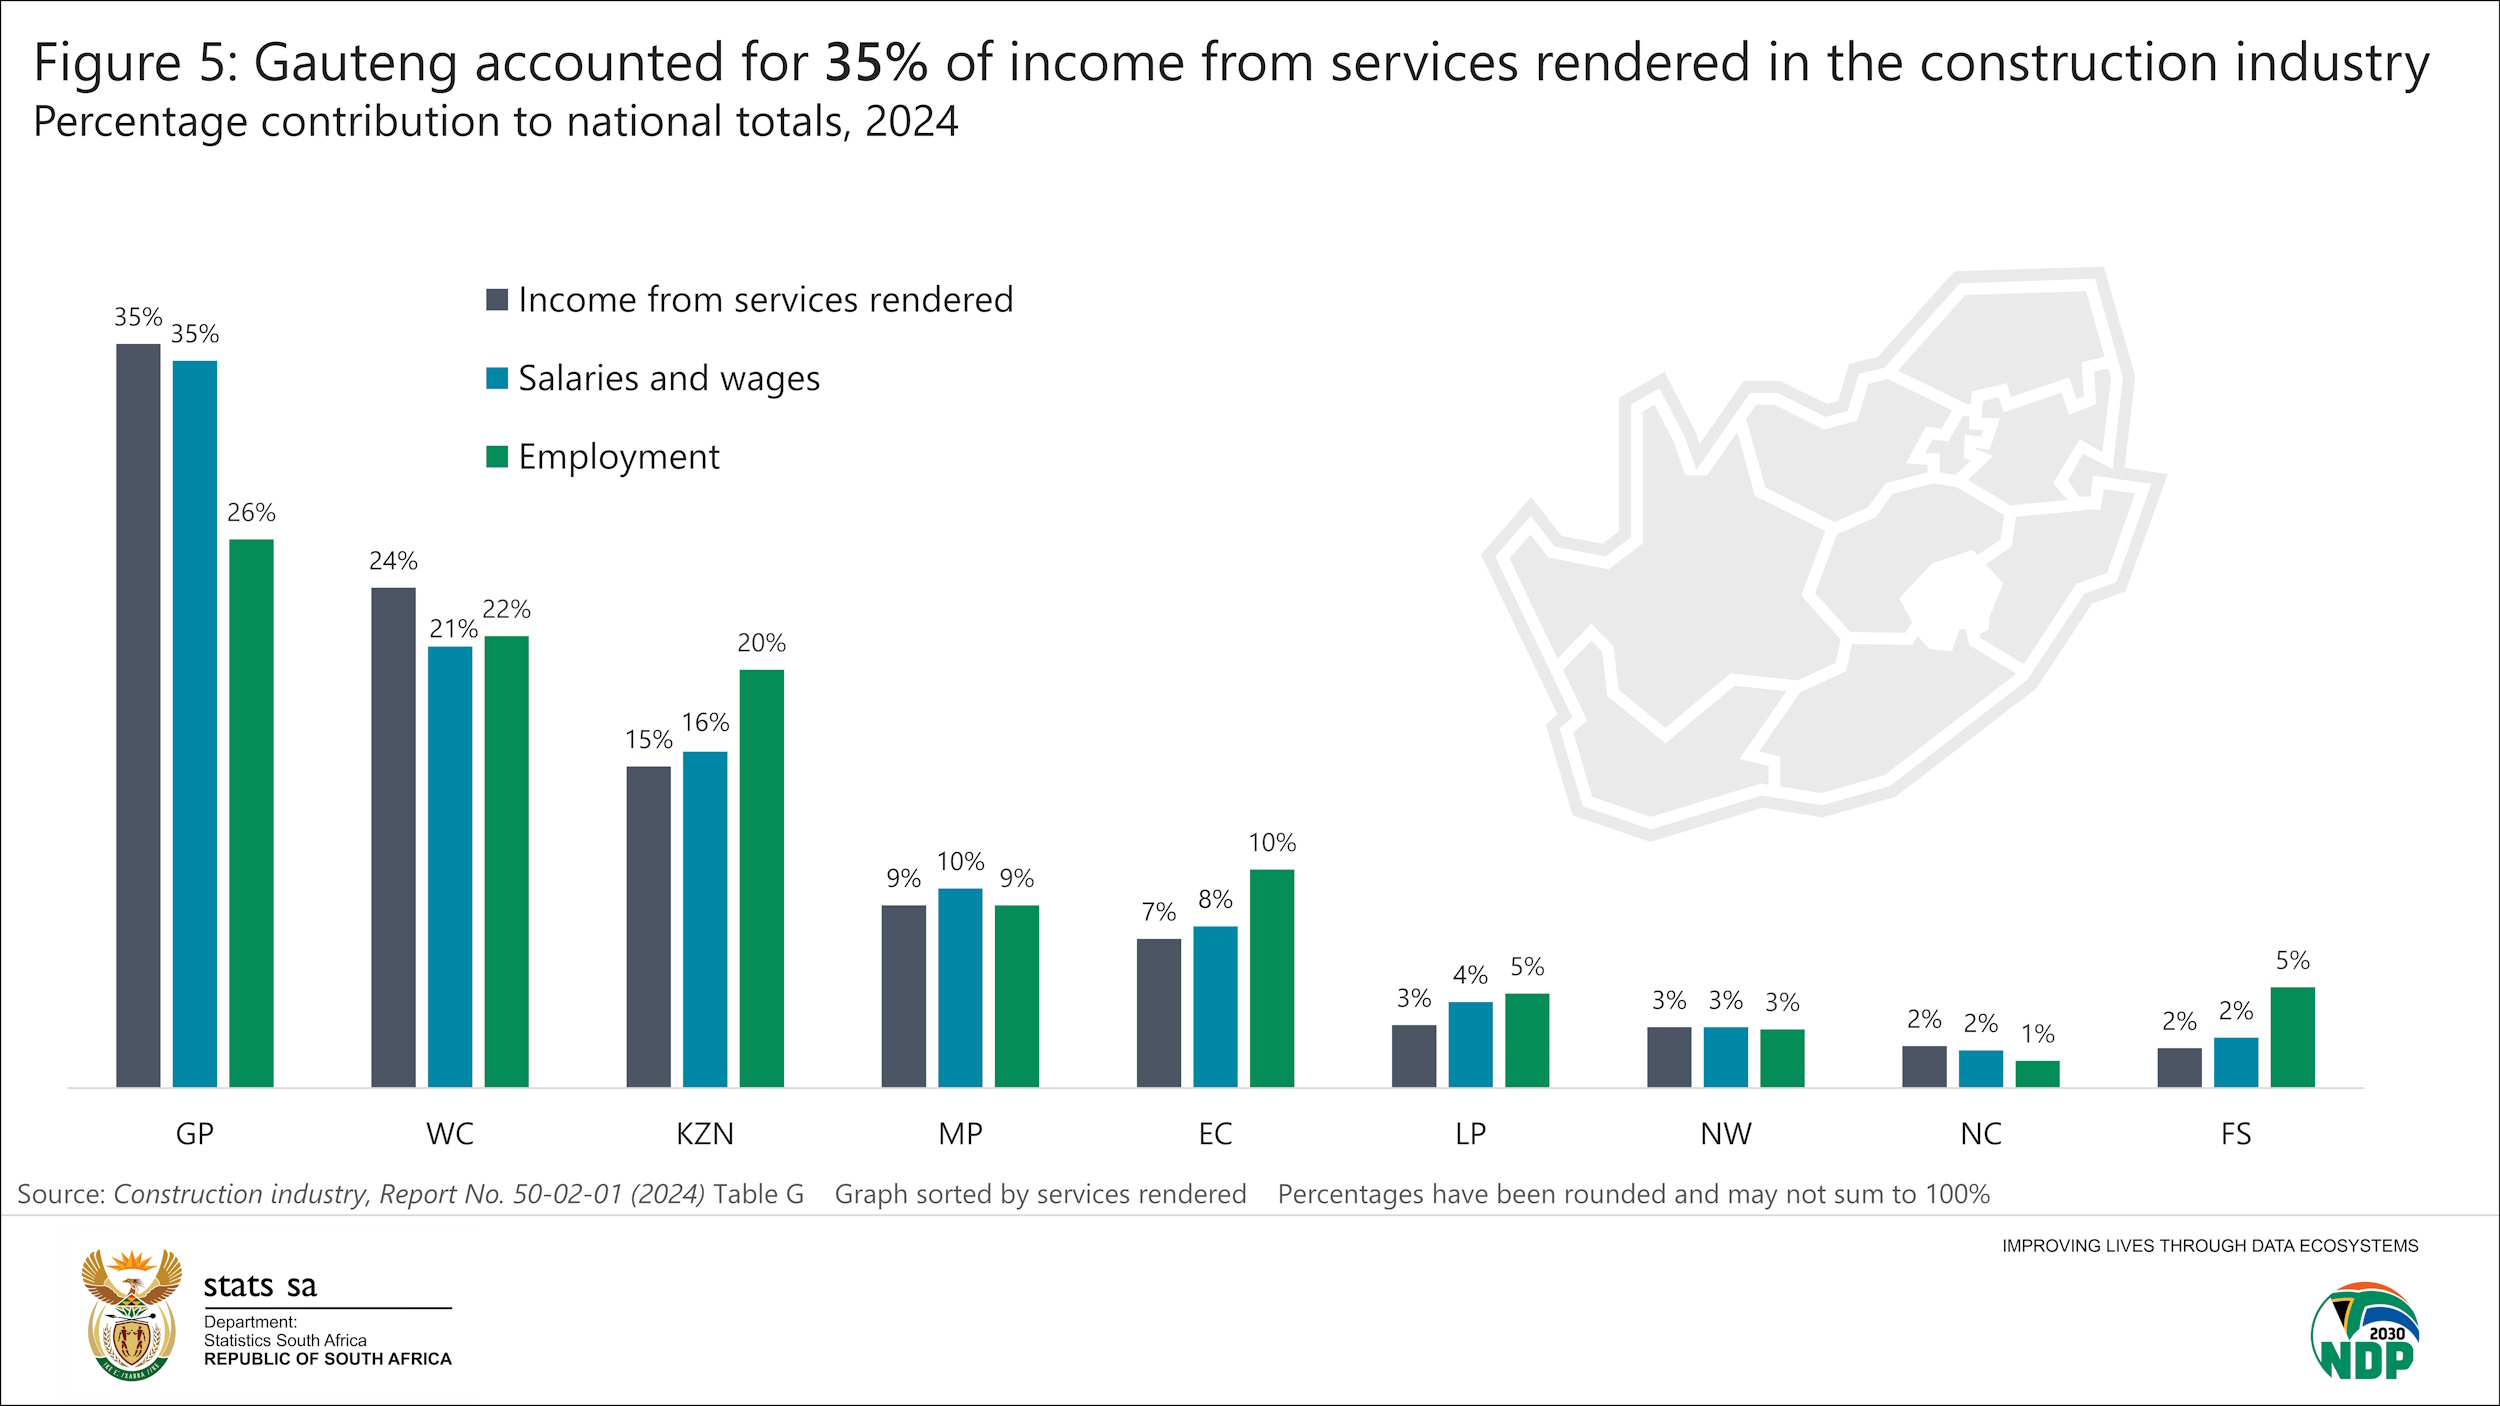
Despite Gauteng’s dominance, the province experienced a decline in percentage share across the three variables. For example, the province accounted for 39% of income from services rendered in 2020, declining to 35% in 2024. Western Cape and KwaZulu-Natal, on the other hand, expanded their shares across all three variables. For example, the Western Cape accounted for 18% of income from services rendered in 2020, rising to 24% in 2024.
To conclude, the results above show key changes in the construction industry. First, the decline of larger firms elevated the prominence of small and micro enterprises. Second, construction employment over the last decade has lacked a clear long-term trend. Third, although Gauteng dominates the industry, its influence has weakened since 2020.
For more information, download the Construction Industry 2024 statistical report, associated Excel files and media presentation here.
1 Infrastructure South Africa. Construction book, 2024/25. Pages 16 and 18 (download here).
2 Stats SA. Gross domestic product (GDP), quarter ended March 2026. ‘GDP P0441- Q1 2026’ Excel file (available for download here).
3 Stats SA. Construction industry, 2014. Figure 2 (download here).
4 Stats SA. Provincial gross domestic product, 2024. Figure 4 (download here).
Similar articles are available on the Stats SA website and can be accessed here.
For a monthly overview of economic indicators and infographics, catch the latest edition of the Stats Biz newsletter here.