
A 20-year snapshot of municipal finances
The recent voter registration drive was a reminder of the upcoming local government elections on 4 November 2026. A two-decade review of five financial indicators shows how municipalities fared at the time of previous elections.
The beauty of Stats SA’s annual Financial census of municipalities statistical release is that it provides a time series of financial data from 2006. Local government elections in this period were held in 2006, 2011, 2016 and 2021.
The ebb and flow of municipal finances is traced from the data. Several indicators are explored below, including revenue and operational expenditure; employee-related costs; the extent of financial dependence on central government; and debt.
The municipal purse
Both revenue and operational expenditure have risen consistently over the years. As a collective, municipalities generated or received R620 billion in revenue in 2025, up from R109 billion in 2006. On the spending side, operational expenditure amounted to R608 billion in 2025, up from R103 billion in 2006 (see Figure 1 below).
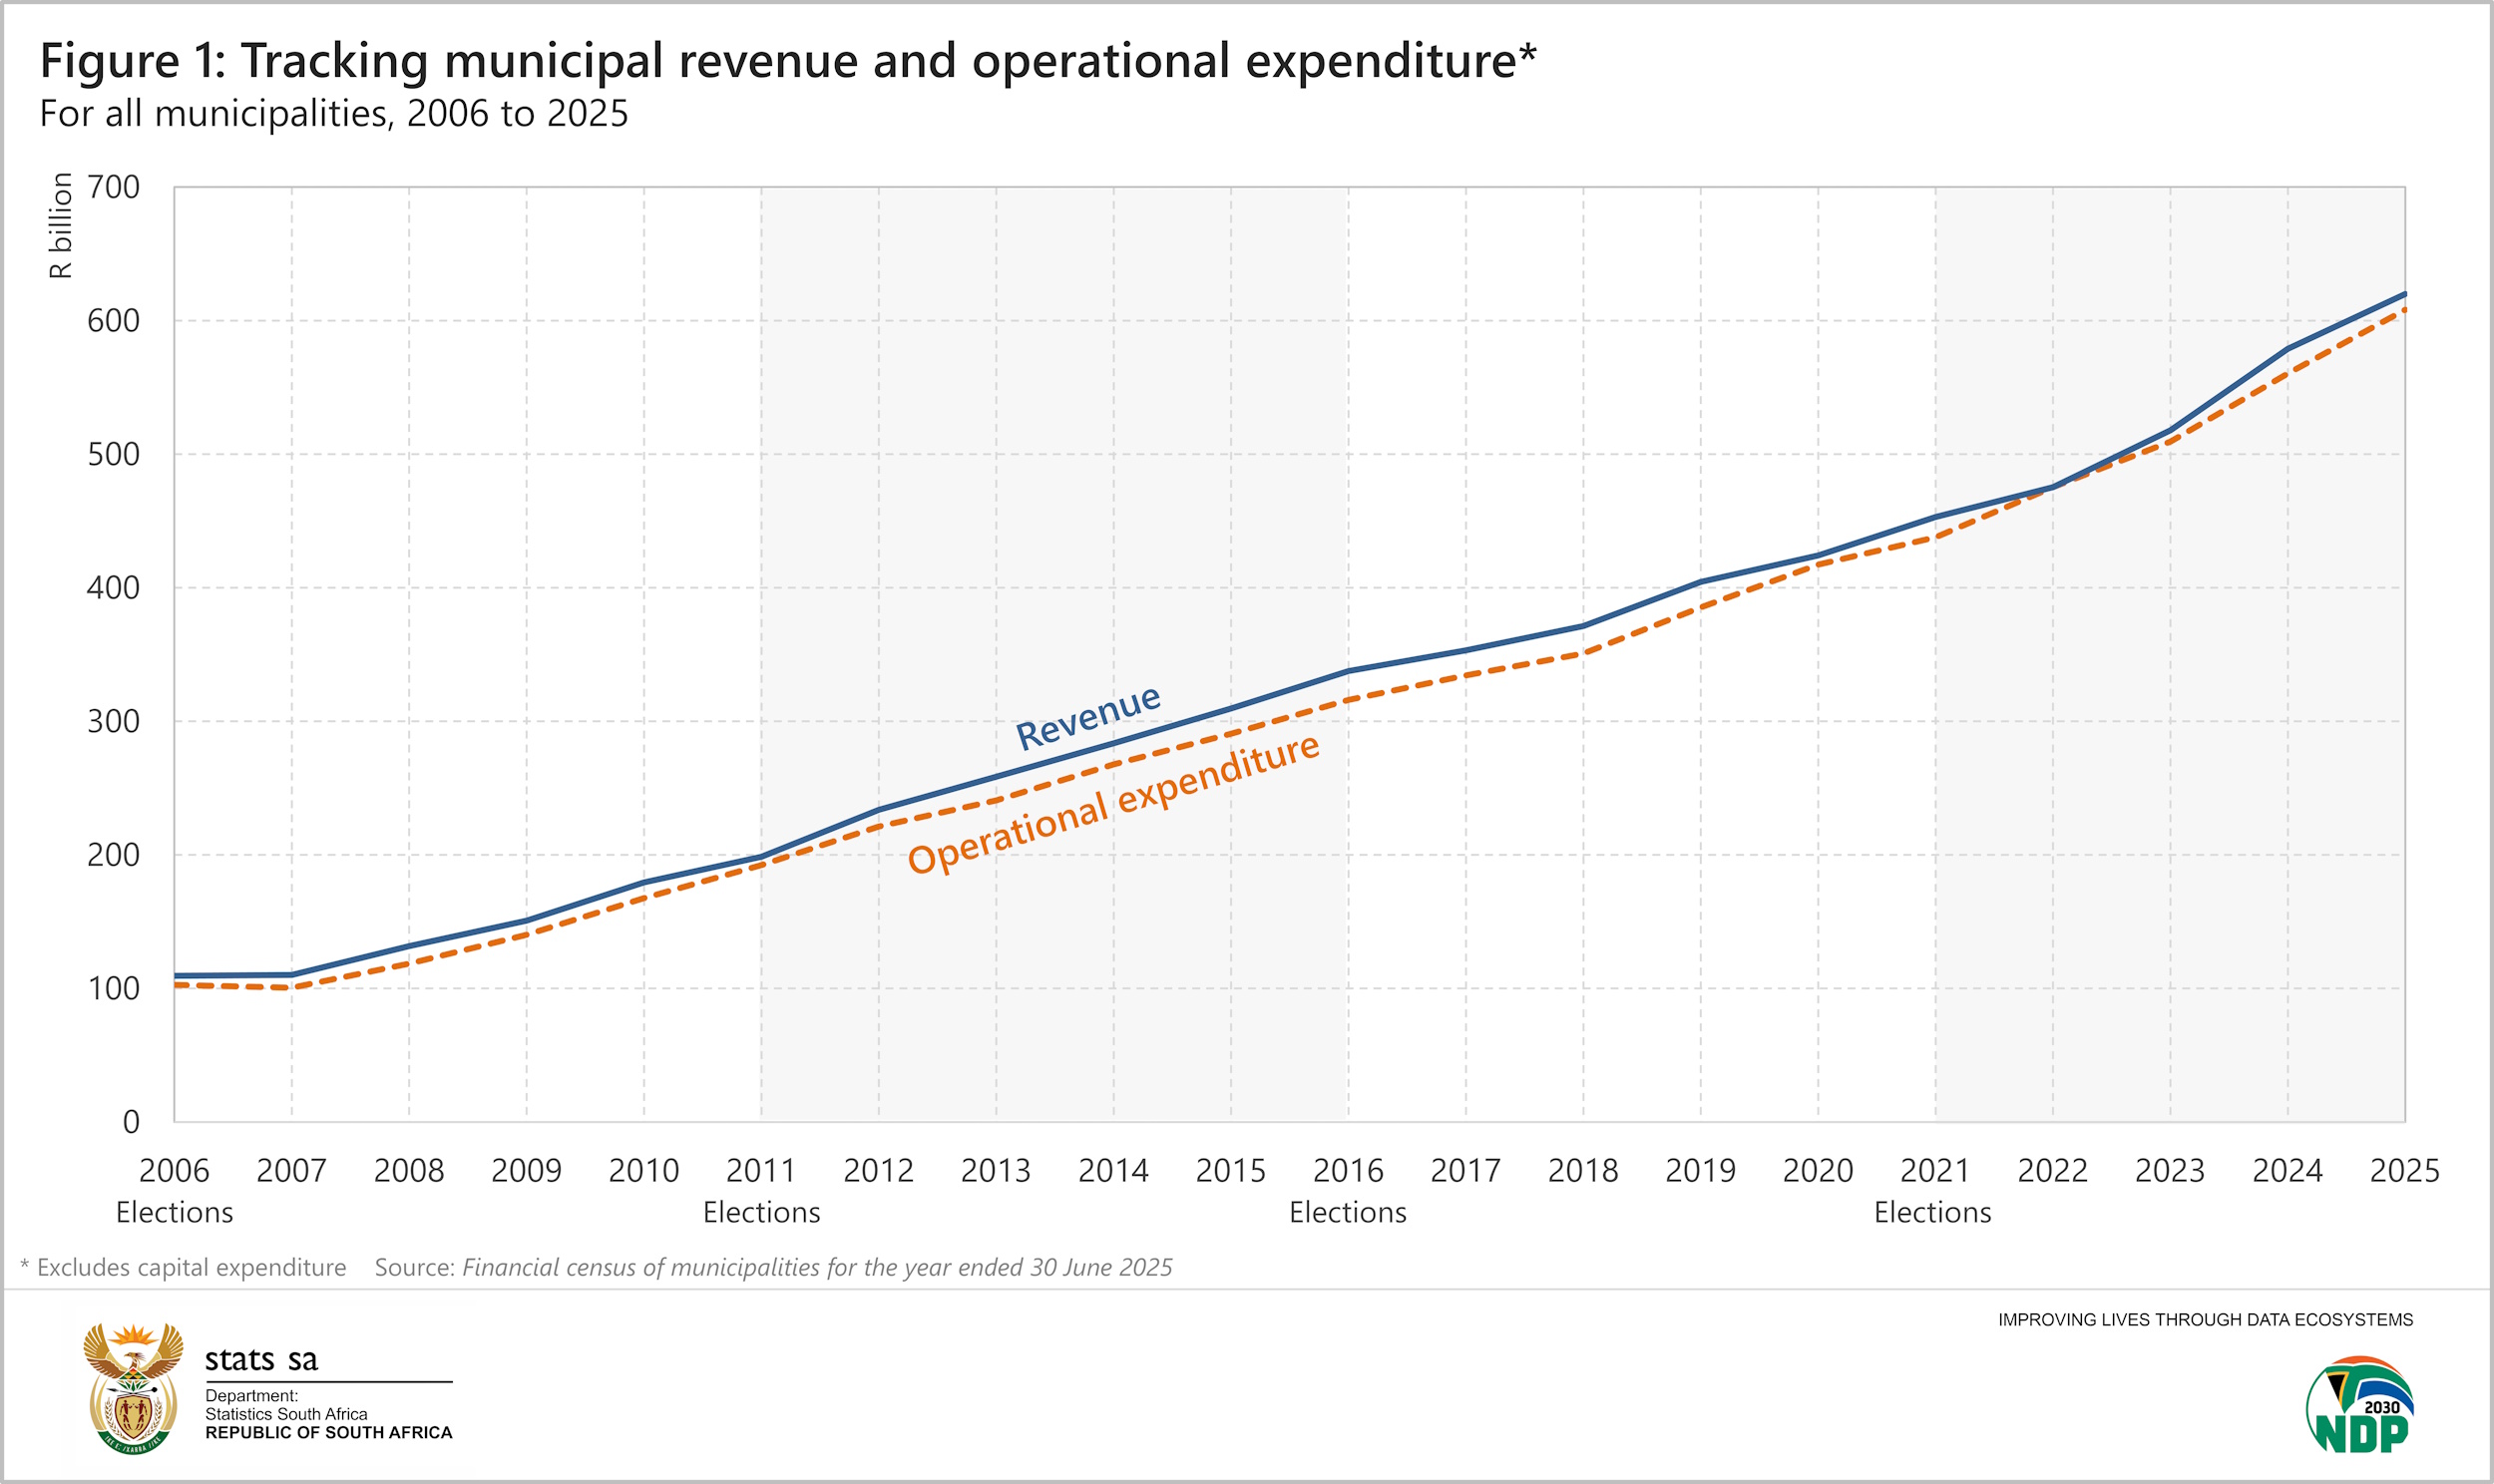
Three municipalities accounted for one-third of total spending in 2025. These were the City of Johannesburg (R79 billion), eThekwini Metropolitan Municipality (R60 billion) and the City of Cape Town (R59 billion). Xhariep District Municipality in Free State spent the least (R75,8 million).
Paying the municipal workforce
South Africa’s 257 municipalities employed 289 796 individuals in 2023, according to the latest data from Stats SA.1 The payment of salaries and wages accounts for a sizable portion of operational expenditure. National Treasury states that municipal spending on employee-related costs should lie within a range of 25% to 40% of total operational expenditure.2
This has mostly been adhered to, according to Figure 2 below. Employee-related costs accounted for 24,8% of total operational expenditure in 2006. After flatlining between the 2011 and 2016 elections, it rose to reach 28,9% in 2021. Since the 2021 elections, the contribution has declined, reaching the lower end of the National Treasury norm at 25,2% in 2025.
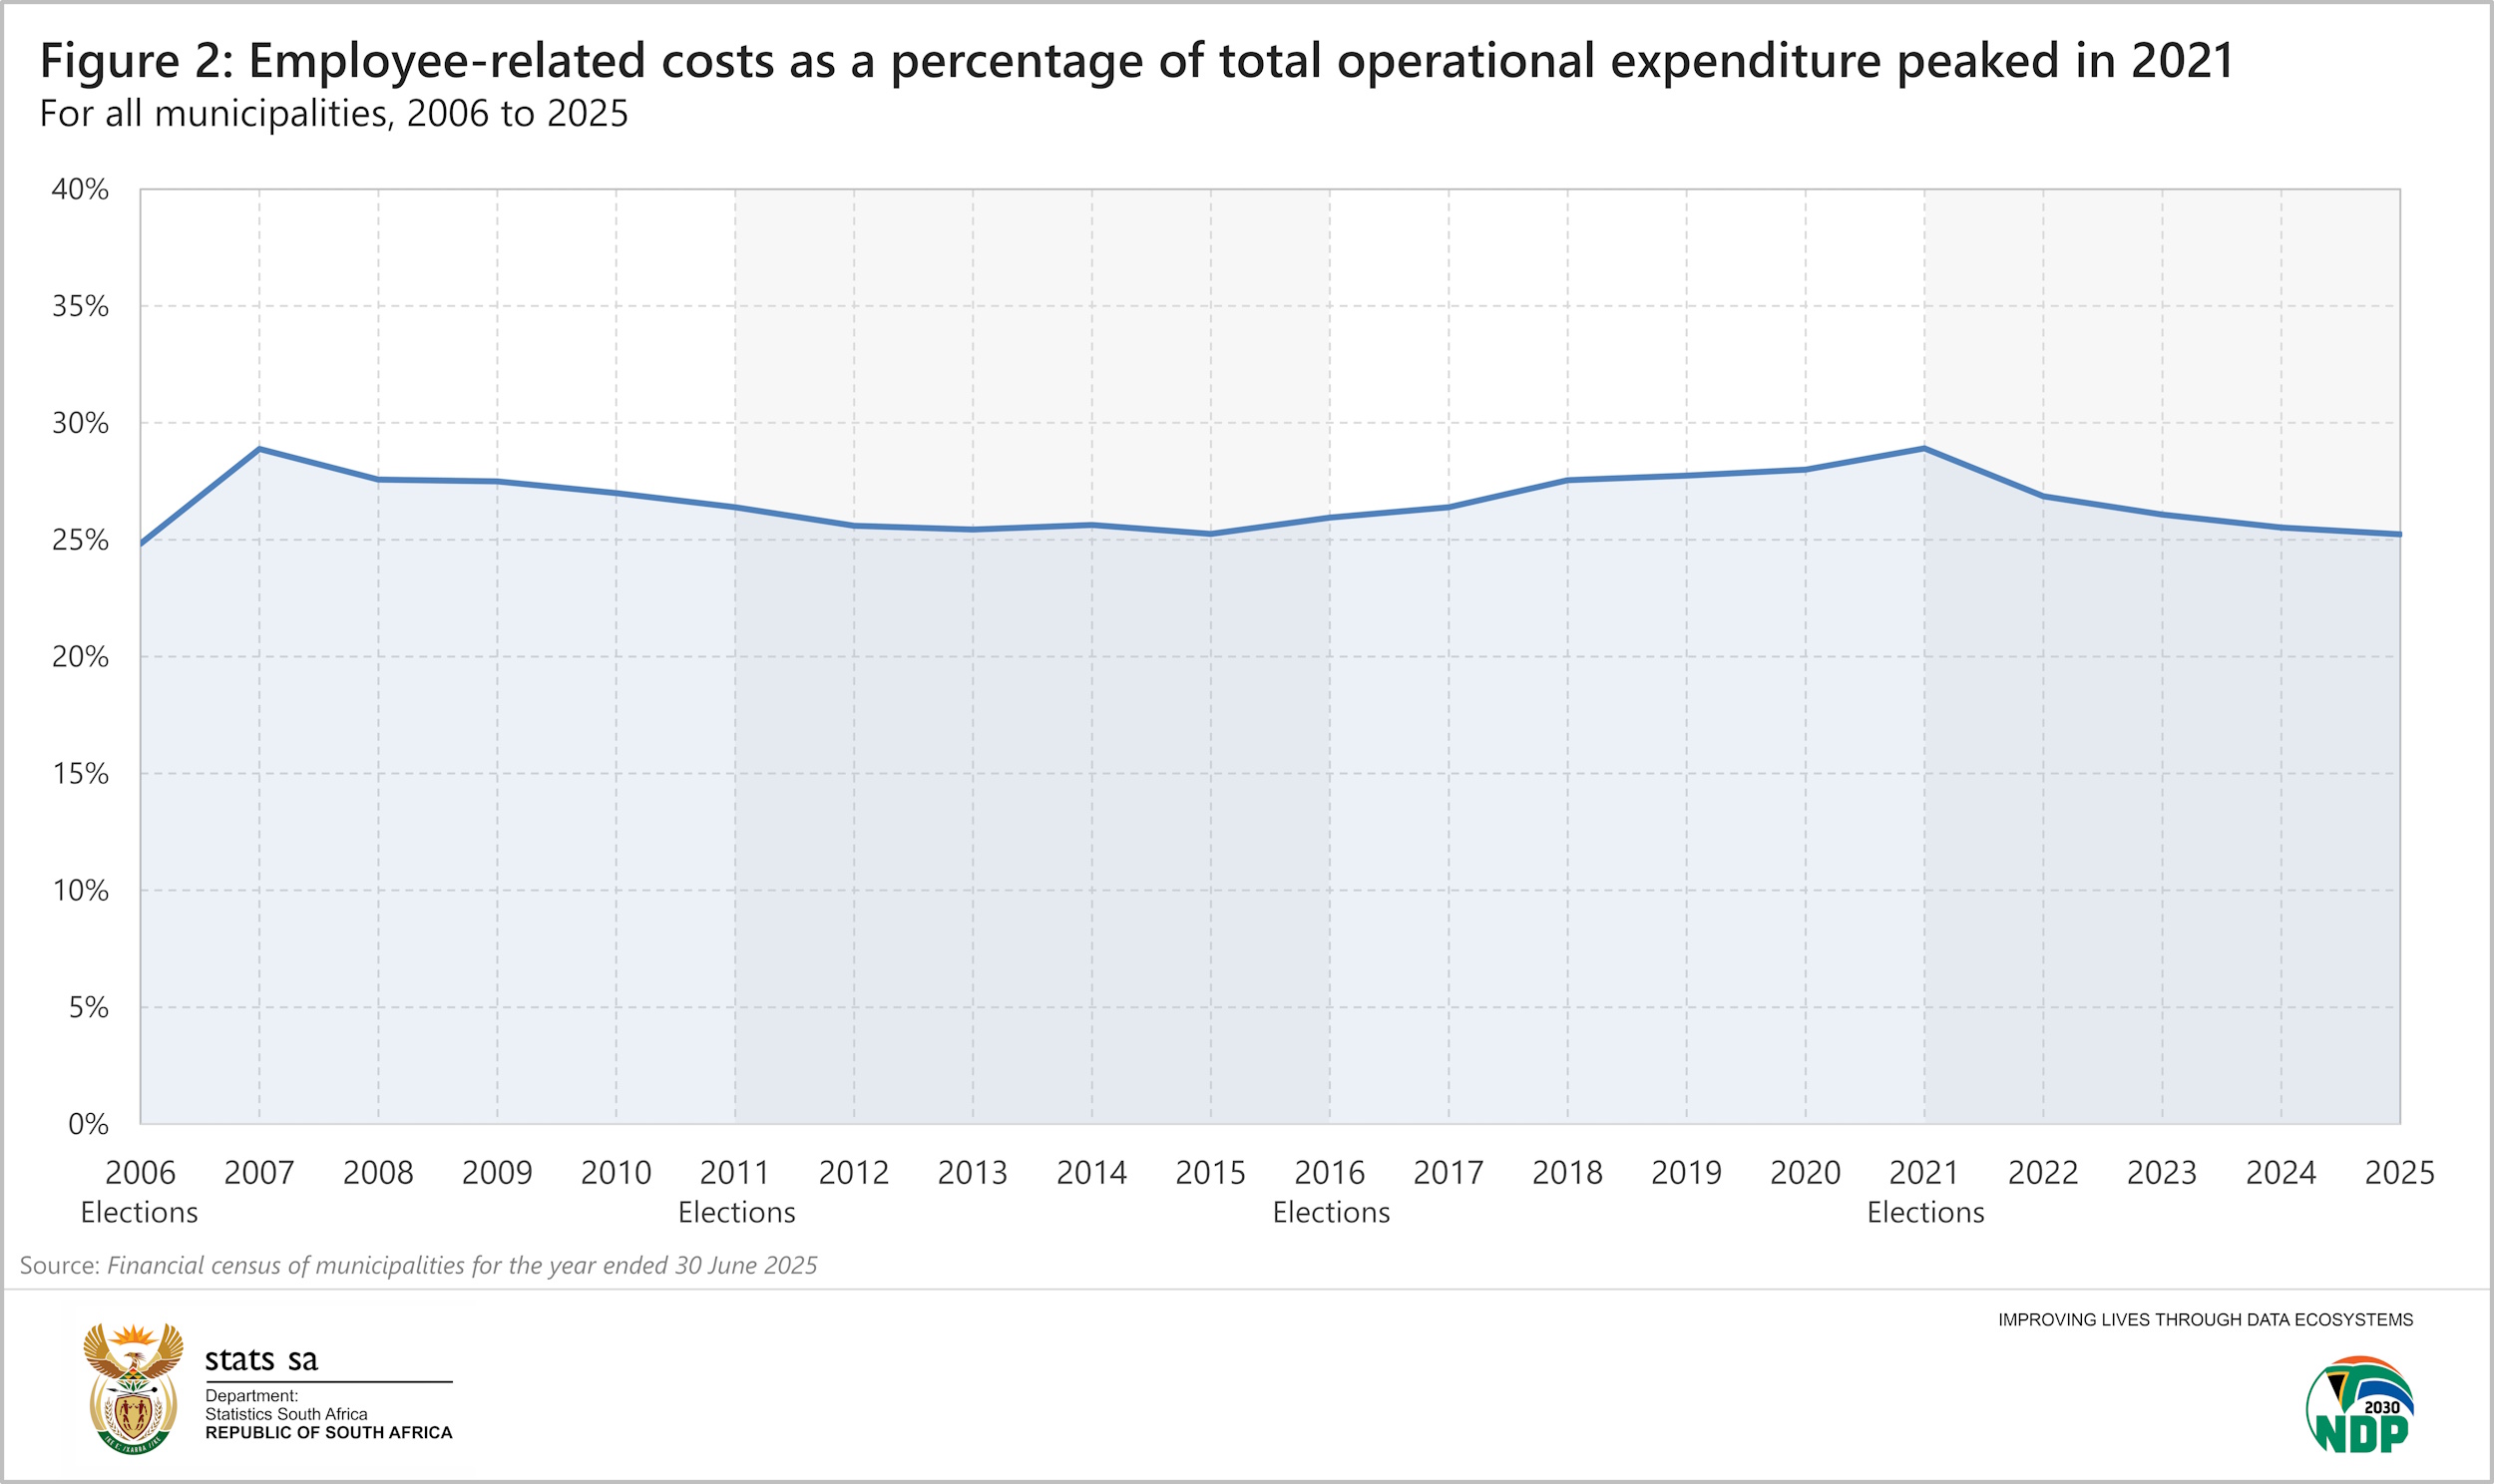
In 2025, 136 municipalities fell snugly between 25% and 40%. This left 37 municipalities above and 84 municipalities below the range.
Most district municipalities tend to report higher percentages as they do not spend money on electricity and water. C1 district municipalities, for example, are not Water Services Authorities (WSAs) as they focus primarily on governance, coordination and overarching district planning. They do not have a direct responsibility for supplying bulk water or sanitation services to households. C2 district municipalities, on the other hand, are WSAs. These have substantial service delivery obligations, including managing and supplying bulk water, wastewater systems, and at times sanitation infrastructure across their jurisdictions.
Without the two big-ticket items of water and electricity driving up total expenditure, employee-related costs often take up more of the spending pie for C1 district municipalities. Sedibeng District Municipality in Gauteng registered the highest percentage in 2025, with employee-related costs accounting for 76% of total operating expenditure. Emfuleni Local Municipality, which falls within the Sedibeng District Municipality and includes Vereeniging, Sebokeng and Vanderbijlpark, recorded the lowest percentage at 12%.
A measure of financial independence
Municipal revenue comes from two main sources. The first is self-generated revenue that flows from service charges (money received from customers for water, electricity and sanitation), property rates and fines. The second is revenue from external sources, the bulk of which comes from central government in the form of transfers & subsidies.
Figure 3 below shows that 26,2% of total municipal revenue was received from central government in 2025. This is down from a peak of 33,3% in 2009, but still up from the low of 15,1% in 2006. In other words, money from central government has contributed less to total revenue since 2009.
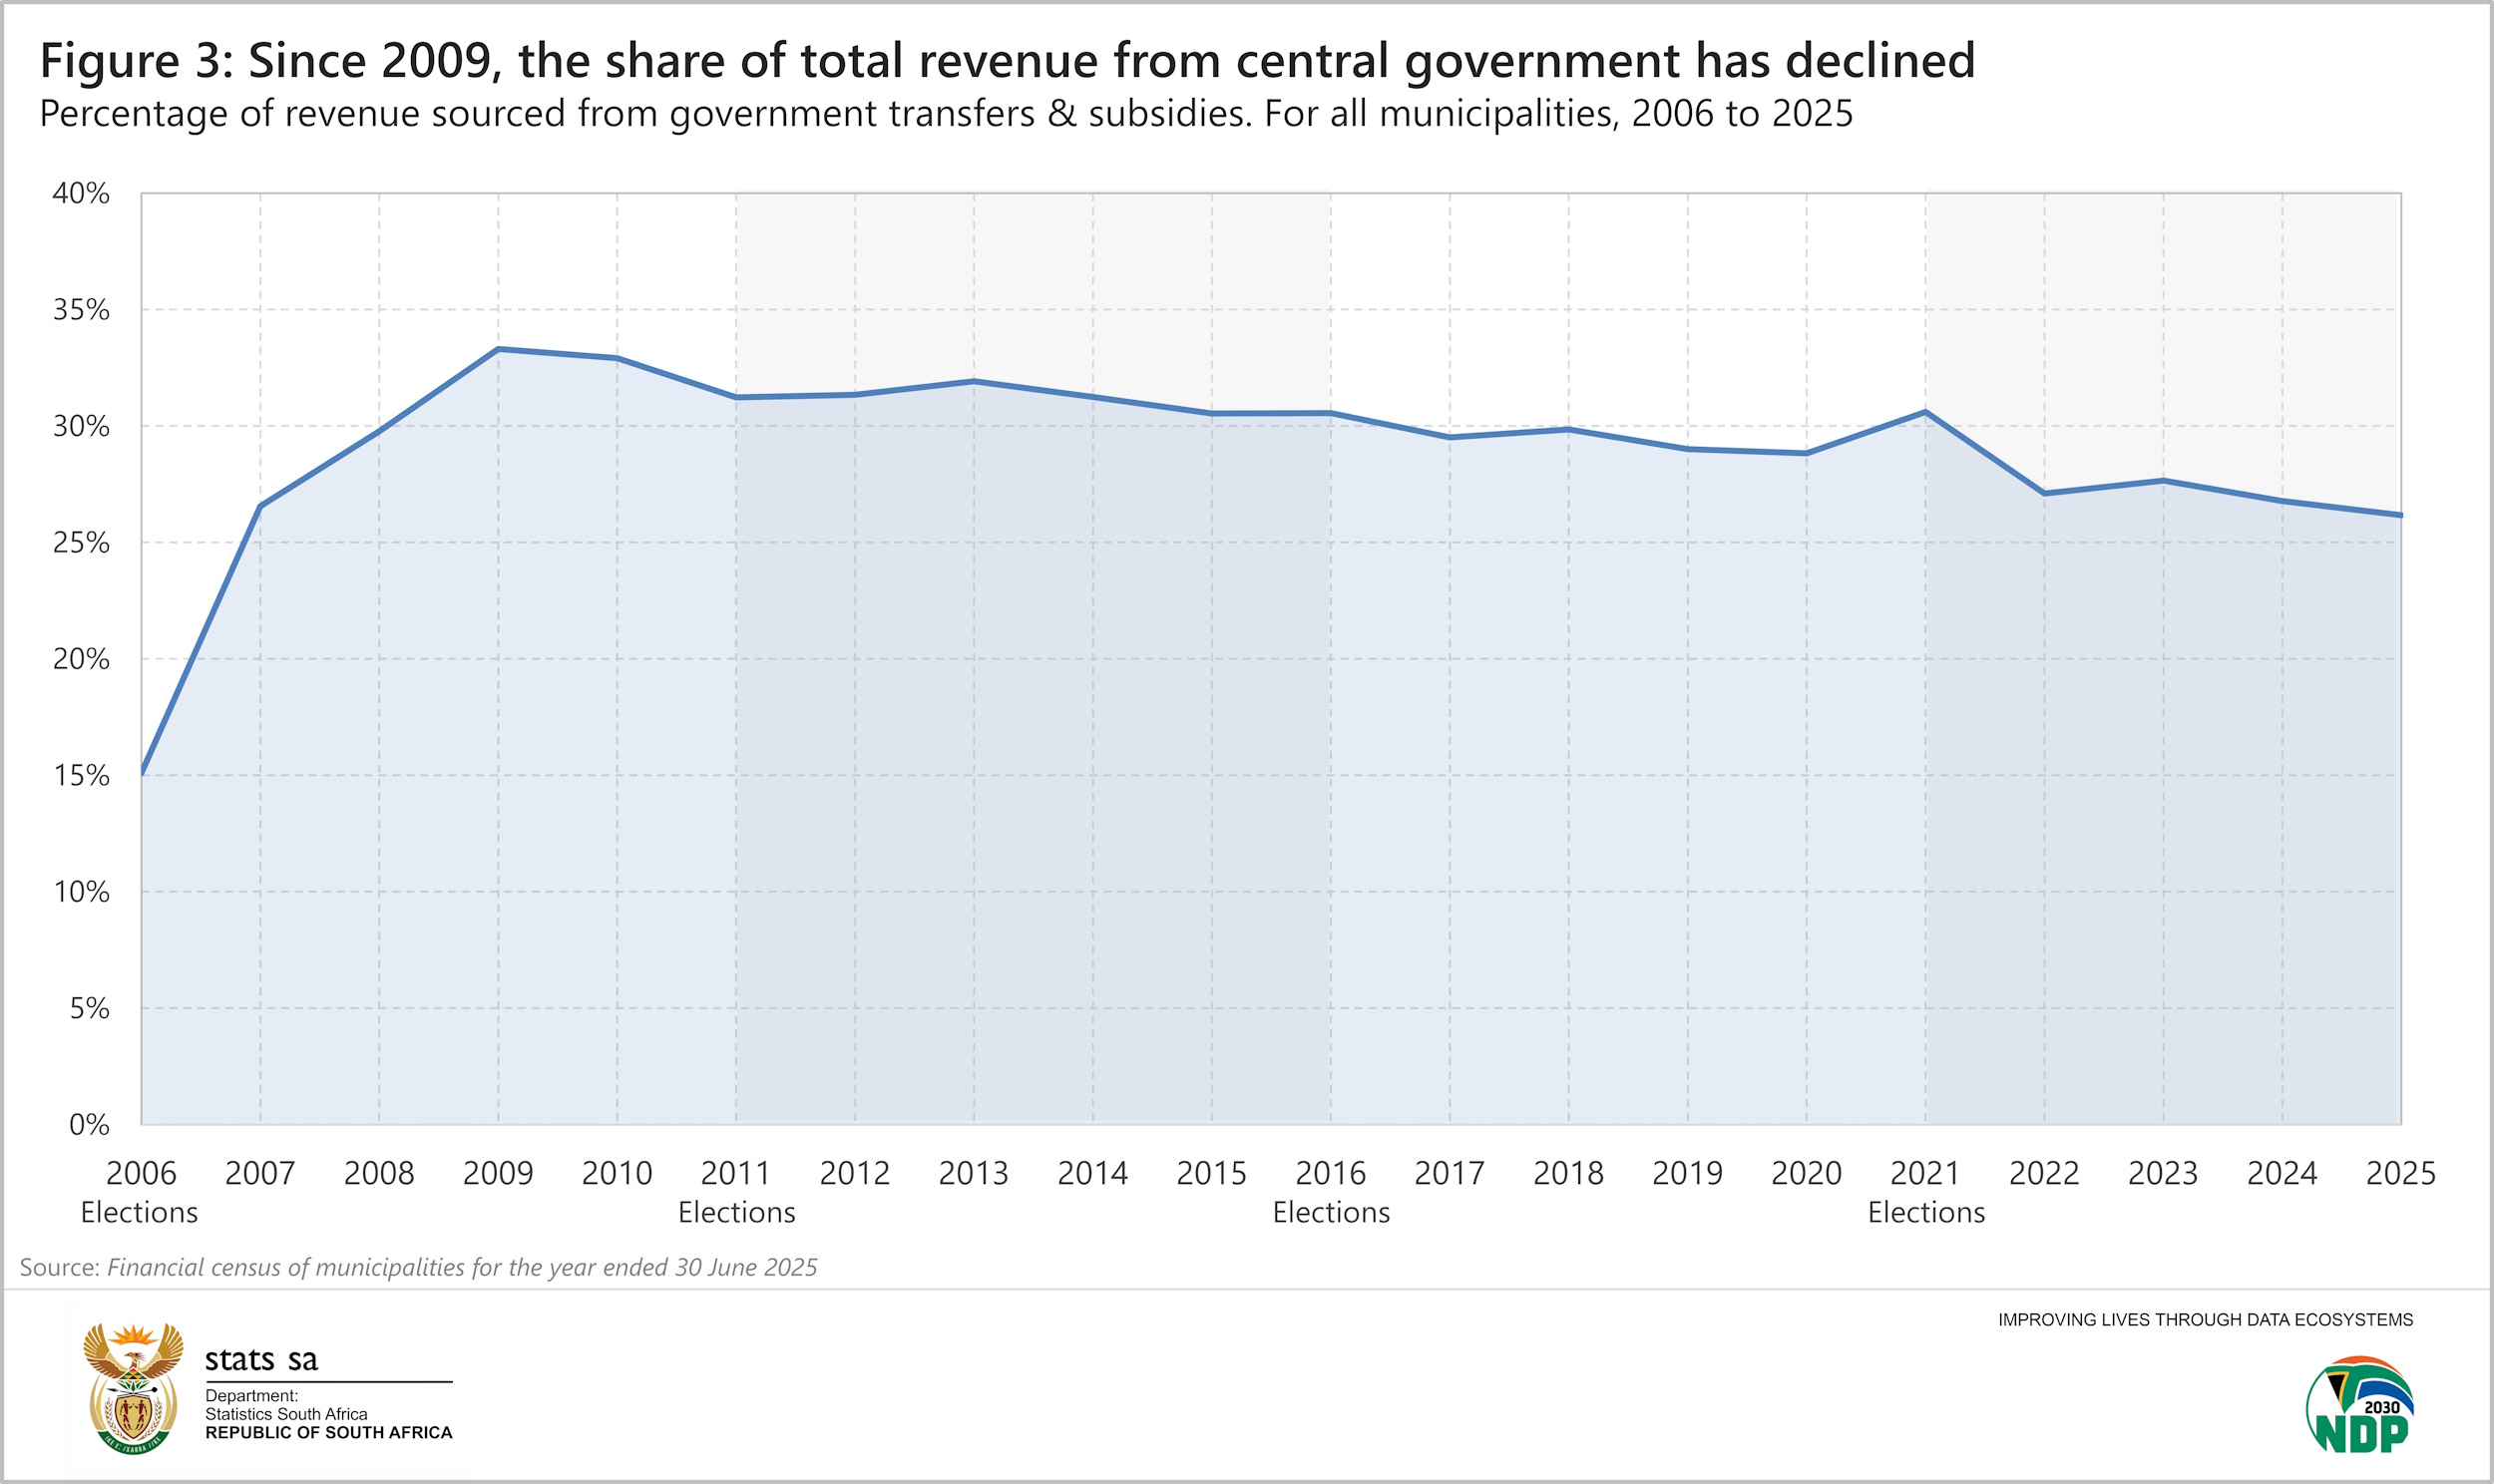
Government transfers & subsidies come in two forms: capital grants and operating grants. These differ primarily in their intended use. Capital grants fund long-term physical assets or infrastructure (such as buildings, land and heavy equipment), whereas operating grants cover routine daily expenses (such as staff salaries, rent and utilities). In 2025, the bulk (71%) of government transfers & subsidies were operational, while 29% were capital.
As noted in a Stats SA article published in 2021, the revenue mix varies substantially across different municipalities. Rural municipalities and some district municipalities depend more on central government, while the eight metropolitan municipalities are in a position to generate a larger share of revenue themselves.3
Fifteen municipalities received over 90% of their revenue from government transfers & subsidies in 2025, with ZF Mgcawu District Municipality in Northern Cape recording the highest percentage (97%). All of the grants received by ZF Mgcawu District Municipality in 2025 were operational. No capital grants were received by the municipality.
Nama Khoi Local Municipality in the same province recorded the lowest percentage at 7%. If we break this percentage down further, 6% was in the form of operational grants while the remaining 1% were capital grants.
The rise in debt
The Financial census of municipalities statistical release provides four financial ratios that cover debt. Figure 4 below shows one of these, referred to as the debt ratio. This ratio indicates the proportion of debt relative to assets. The higher the ratio, the more municipalities rely on debt to finance the assets they hold.
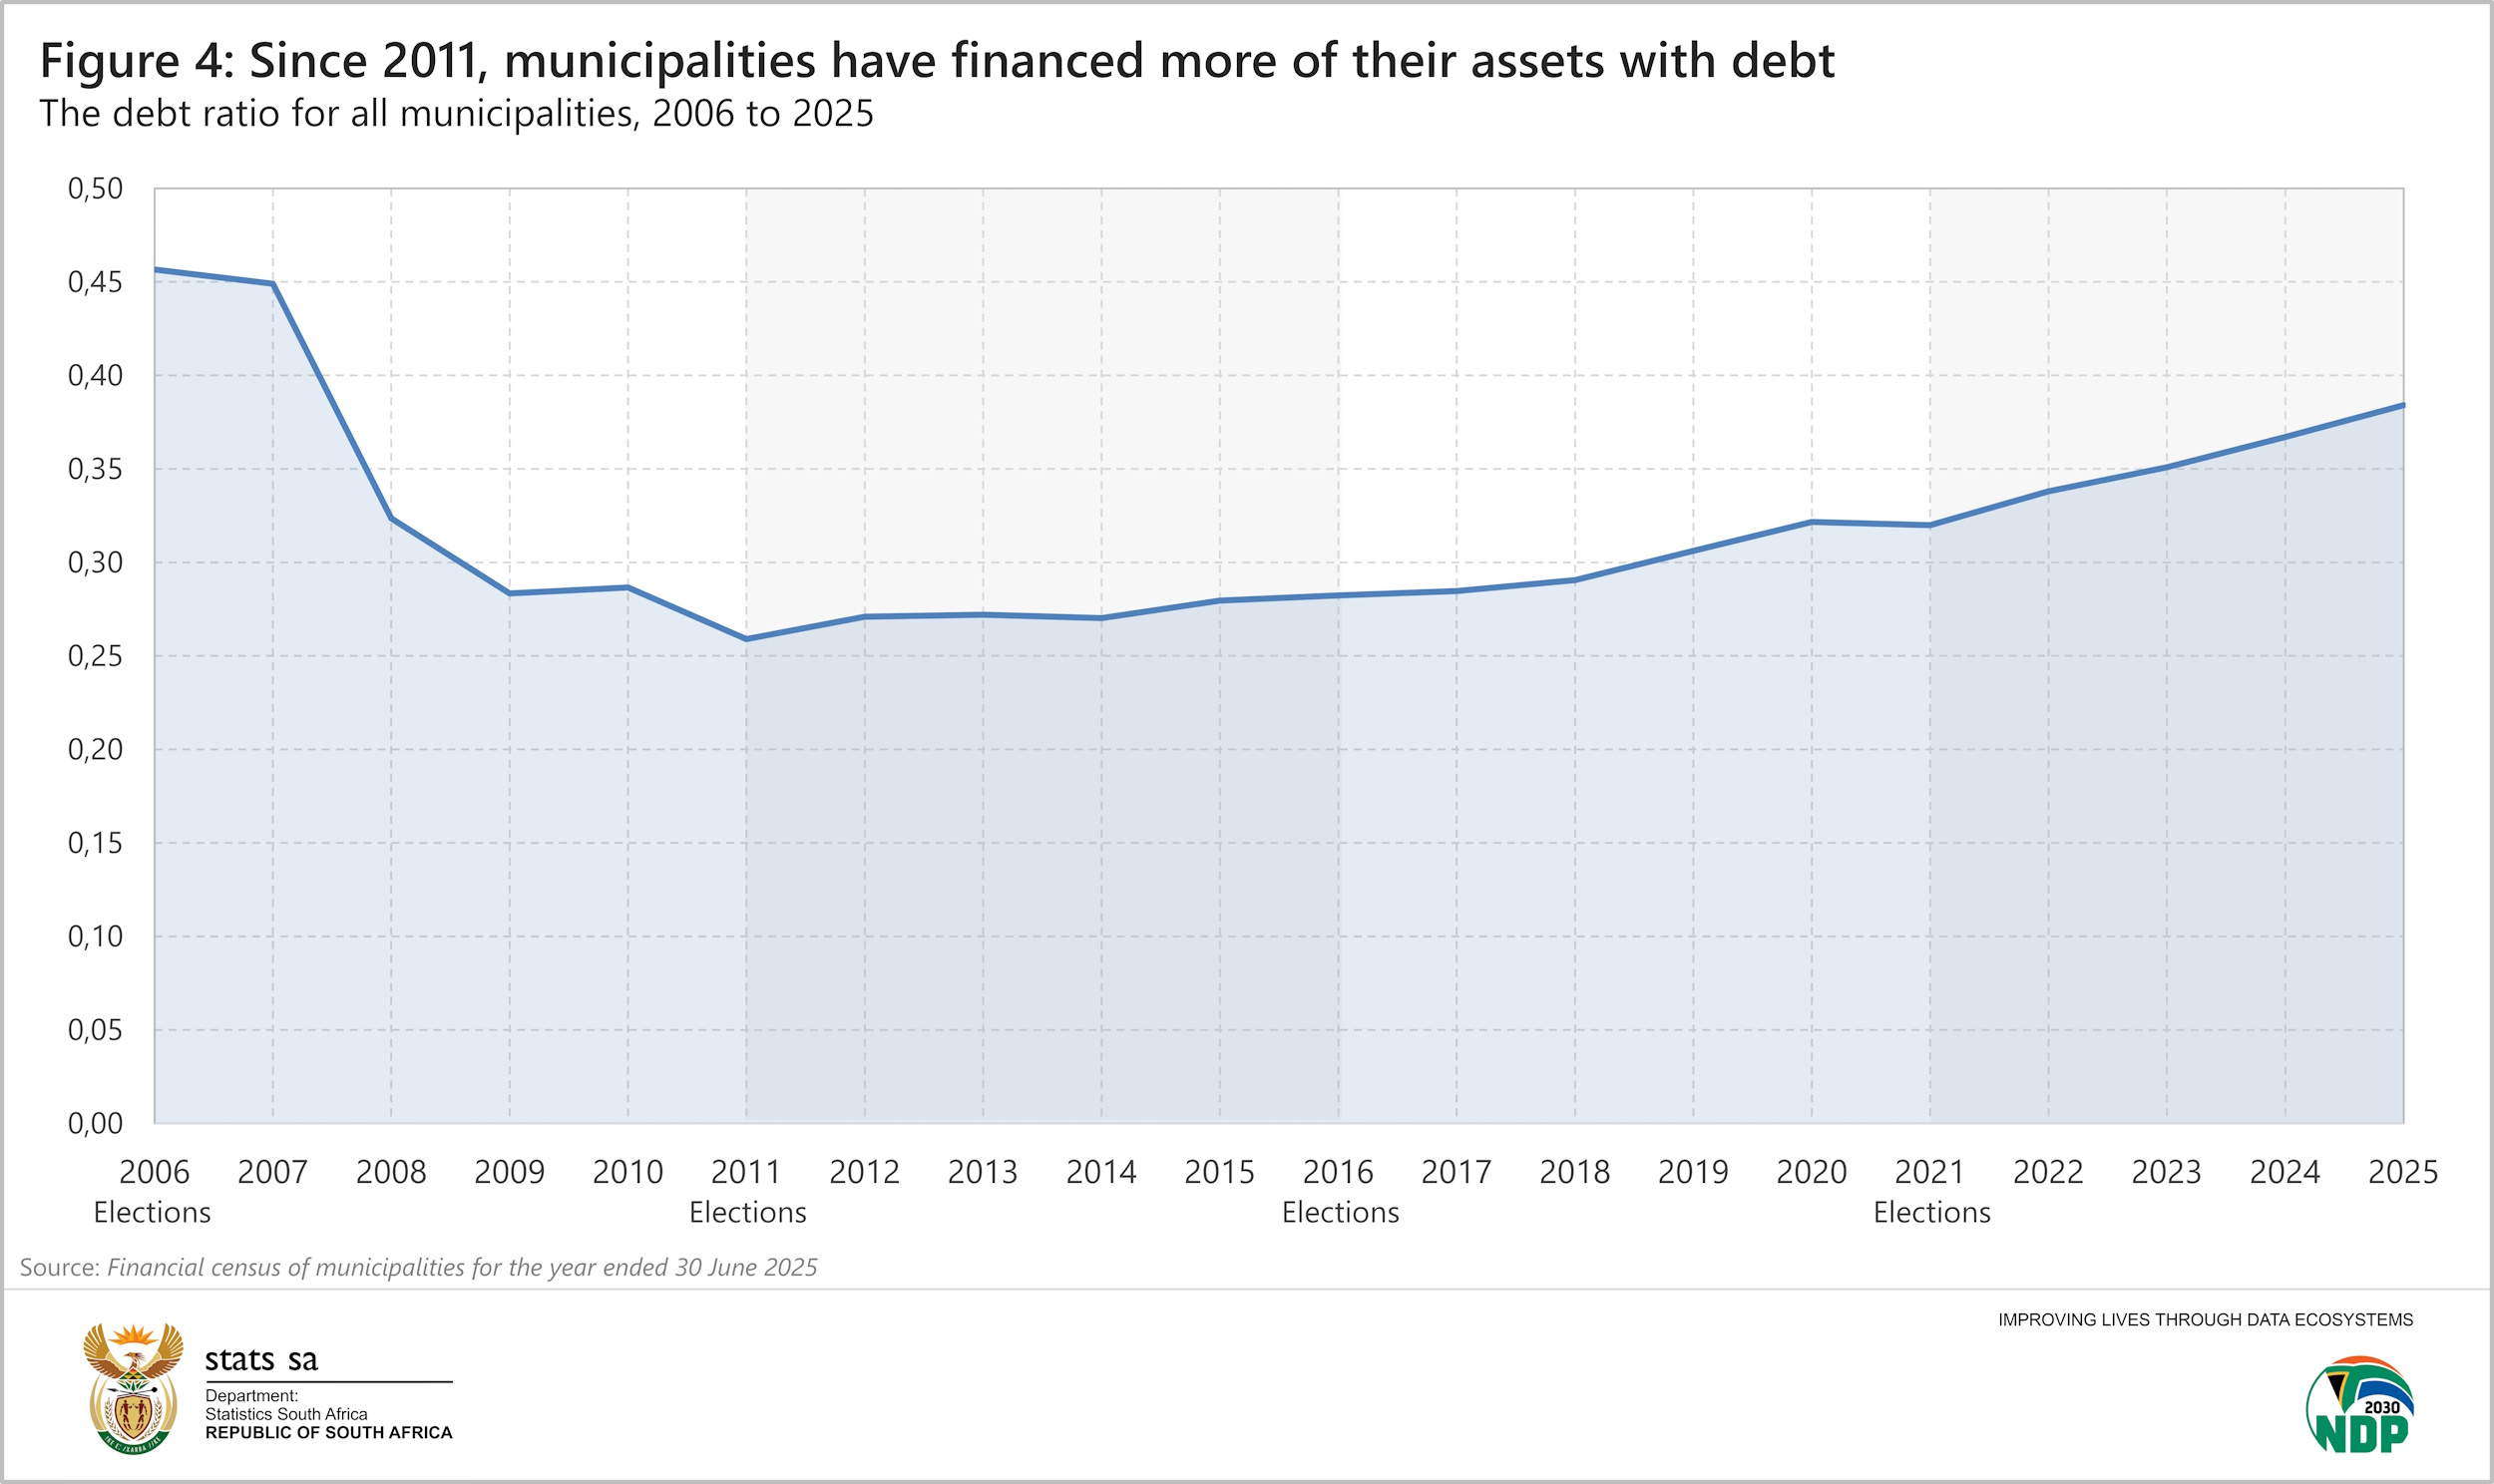
After falling to 0,26 in 2011, the debt ratio has slowly risen over the years to reach 0,38 in 2025. The municipalities with the highest debt ratios in 2025 include Maluti-a-Phofung Local Municipality (2,70) and West Rand District Municipality (2,32). Mnquma Local Municipality in Eastern Cape recorded the lowest (0,03).
For more information, download the Financial census of municipalities, for the year ended June 2025 statistical release and associated Excel files here.
1 Stats SA, Non-financial census of municipalities for the year ended 30 June 2023. Table 1.5 (download here).
2 National Treasury, MFMA Circular No. 71, Uniform Financial Ratios and Norms, page 17 (download here).
3 Stats SA, Municipal dependence on national government financing [29 July 2021] (read here).
Similar articles are available on the Stats SA website and can be accessed here.
For a monthly overview of economic indicators and infographics, catch the latest edition of the Stats Biz newsletter here.