
Report Highlights Complex Nature of Multidimensional Child Poverty in South Africa between 2015 and 2023
Multidimensional child poverty refers to children experiencing multiple and overlapping deprivations simultaneously across key aspects of well‑being, not only income. These deprivations affect their development, survival and future opportunities. A recent report by Stats SA and UNICEF, Child Poverty in South Africa: Assessing Changes in Multidimensional Poverty using the MODA Approach (2015–2023), examines trends in multidimensional child poverty based on data from the 2014/15 Living Conditions Survey (LCS) and the 2022/23 Income and Expenditure Survey (IES). Using UNICEF’s MODA framework, the report assesses deprivation among children aged 0–17 years, and further analyses poverty separately for children aged 0–4, 5–12 and 13–17 years. Deprivation is assessed across seven dimensions of well-being – Nutrition; Health; Protection; Child development; Education; Housing; and Water, Sanitation and Hygiene (WASH). Children are considered multidimensionally deprived when lacking in three or more dimensions simultaneously.
Multidimensional child poverty in South Africa between 2015 and 2023
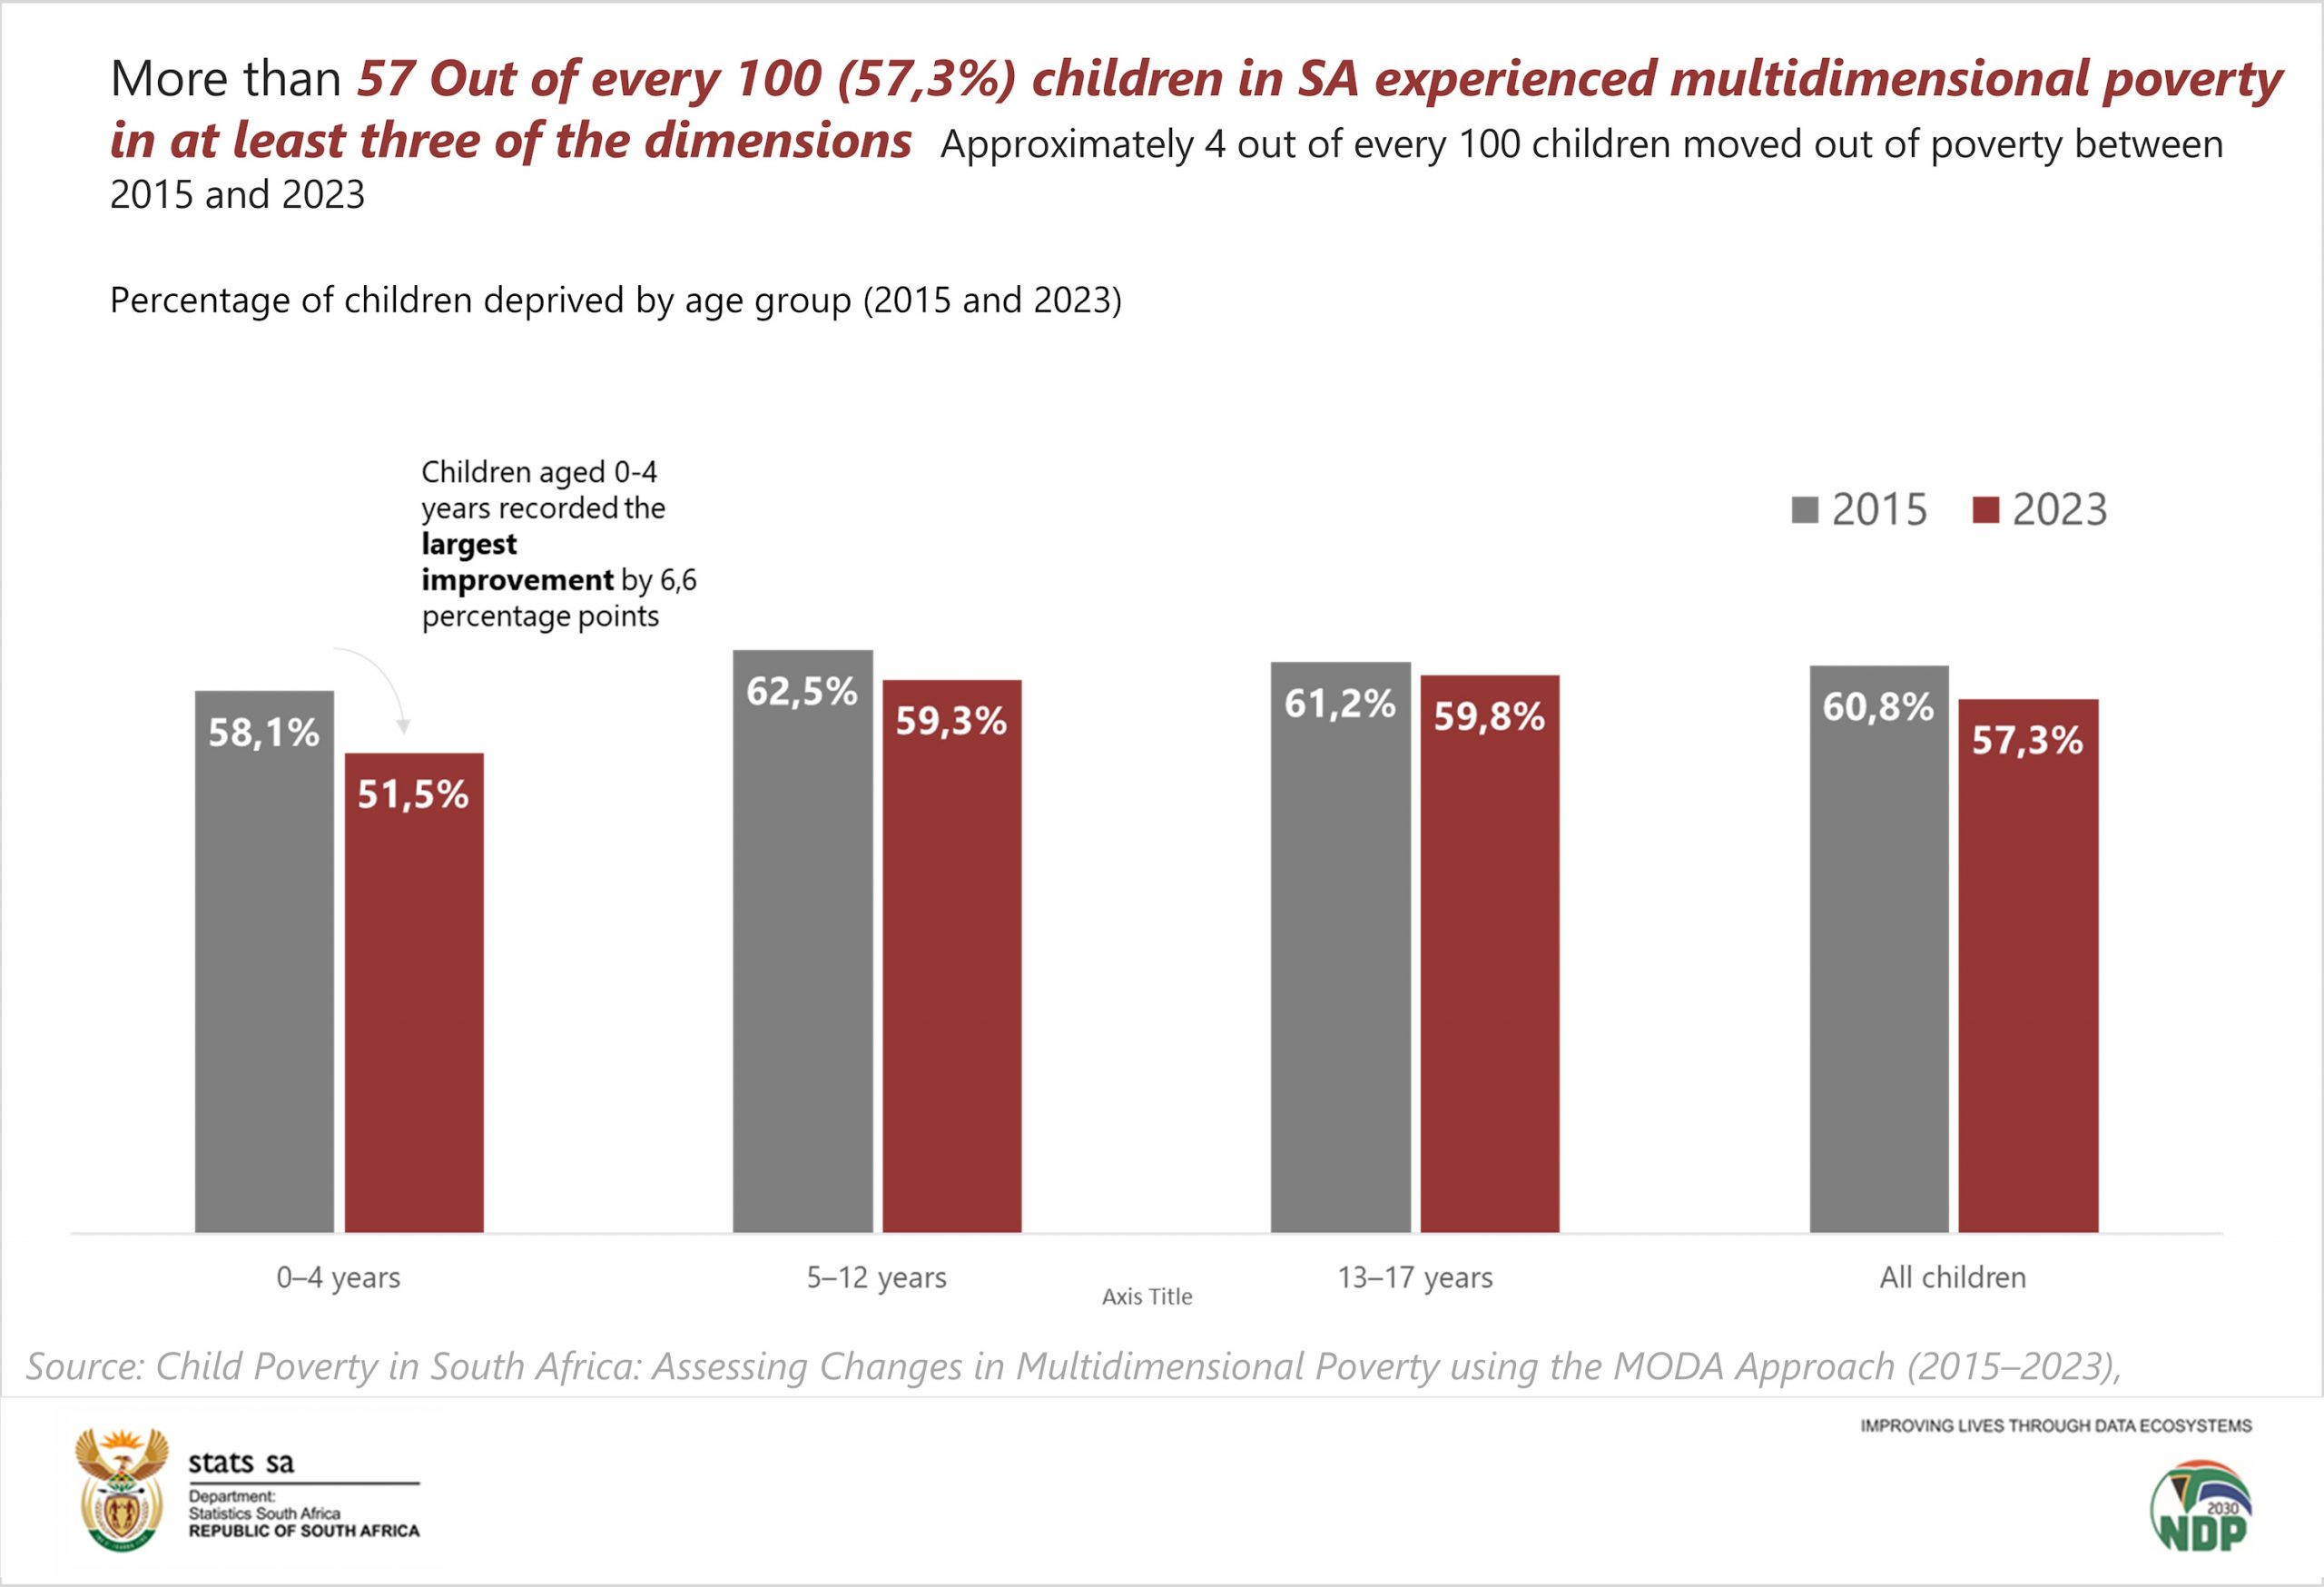
South Africa’s latest Multidimensional child poverty figures present both encouraging developments and areas where improvement has been sluggish. Nationally, multidimensional child poverty declined slightly from 60,8% in 2015 to 57,3% in 2023, indicating little progress, as more than half of children remained deprived. Deprivation decreased across all age groups, with the largest improvement among younger children aged 0-4 years (from 58,1% in 2015 to 51,5% in 2023). Among primary school‑aged children (5-12 years) poverty declined by 3,2 percentage points (from 62,5% to 59,3%), while for adolescents (13-17 years) a decline of 1,4 percentage points were observed (from 61,2% to 59,8%).
Multidimensional child poverty by money-metric poverty status
The data also shows a persistent gap between children living in monetary-poor households and those in non‑poor households. In 2015, 78,9% of children in poor households were multidimensionally deprived, facing on average more than 4 out of 7 possible deprivations. By 2023, the proportion declined slightly to 78,2%, with an average intensity of 57,4%, indicating deprivation in 4 out of seven dimensions. Among children in non‑poor households, 35,2% were multidimensionally poor in 2015, experiencing on average nearly 4 out of 7 deprivations (51,1%). By 2023, deprivation increased slightly to 37,1%, with the average intensity rising somewhat to 52,4%, equivalent to almost 4 out of 7 indicators.
Geographic location of deprived children
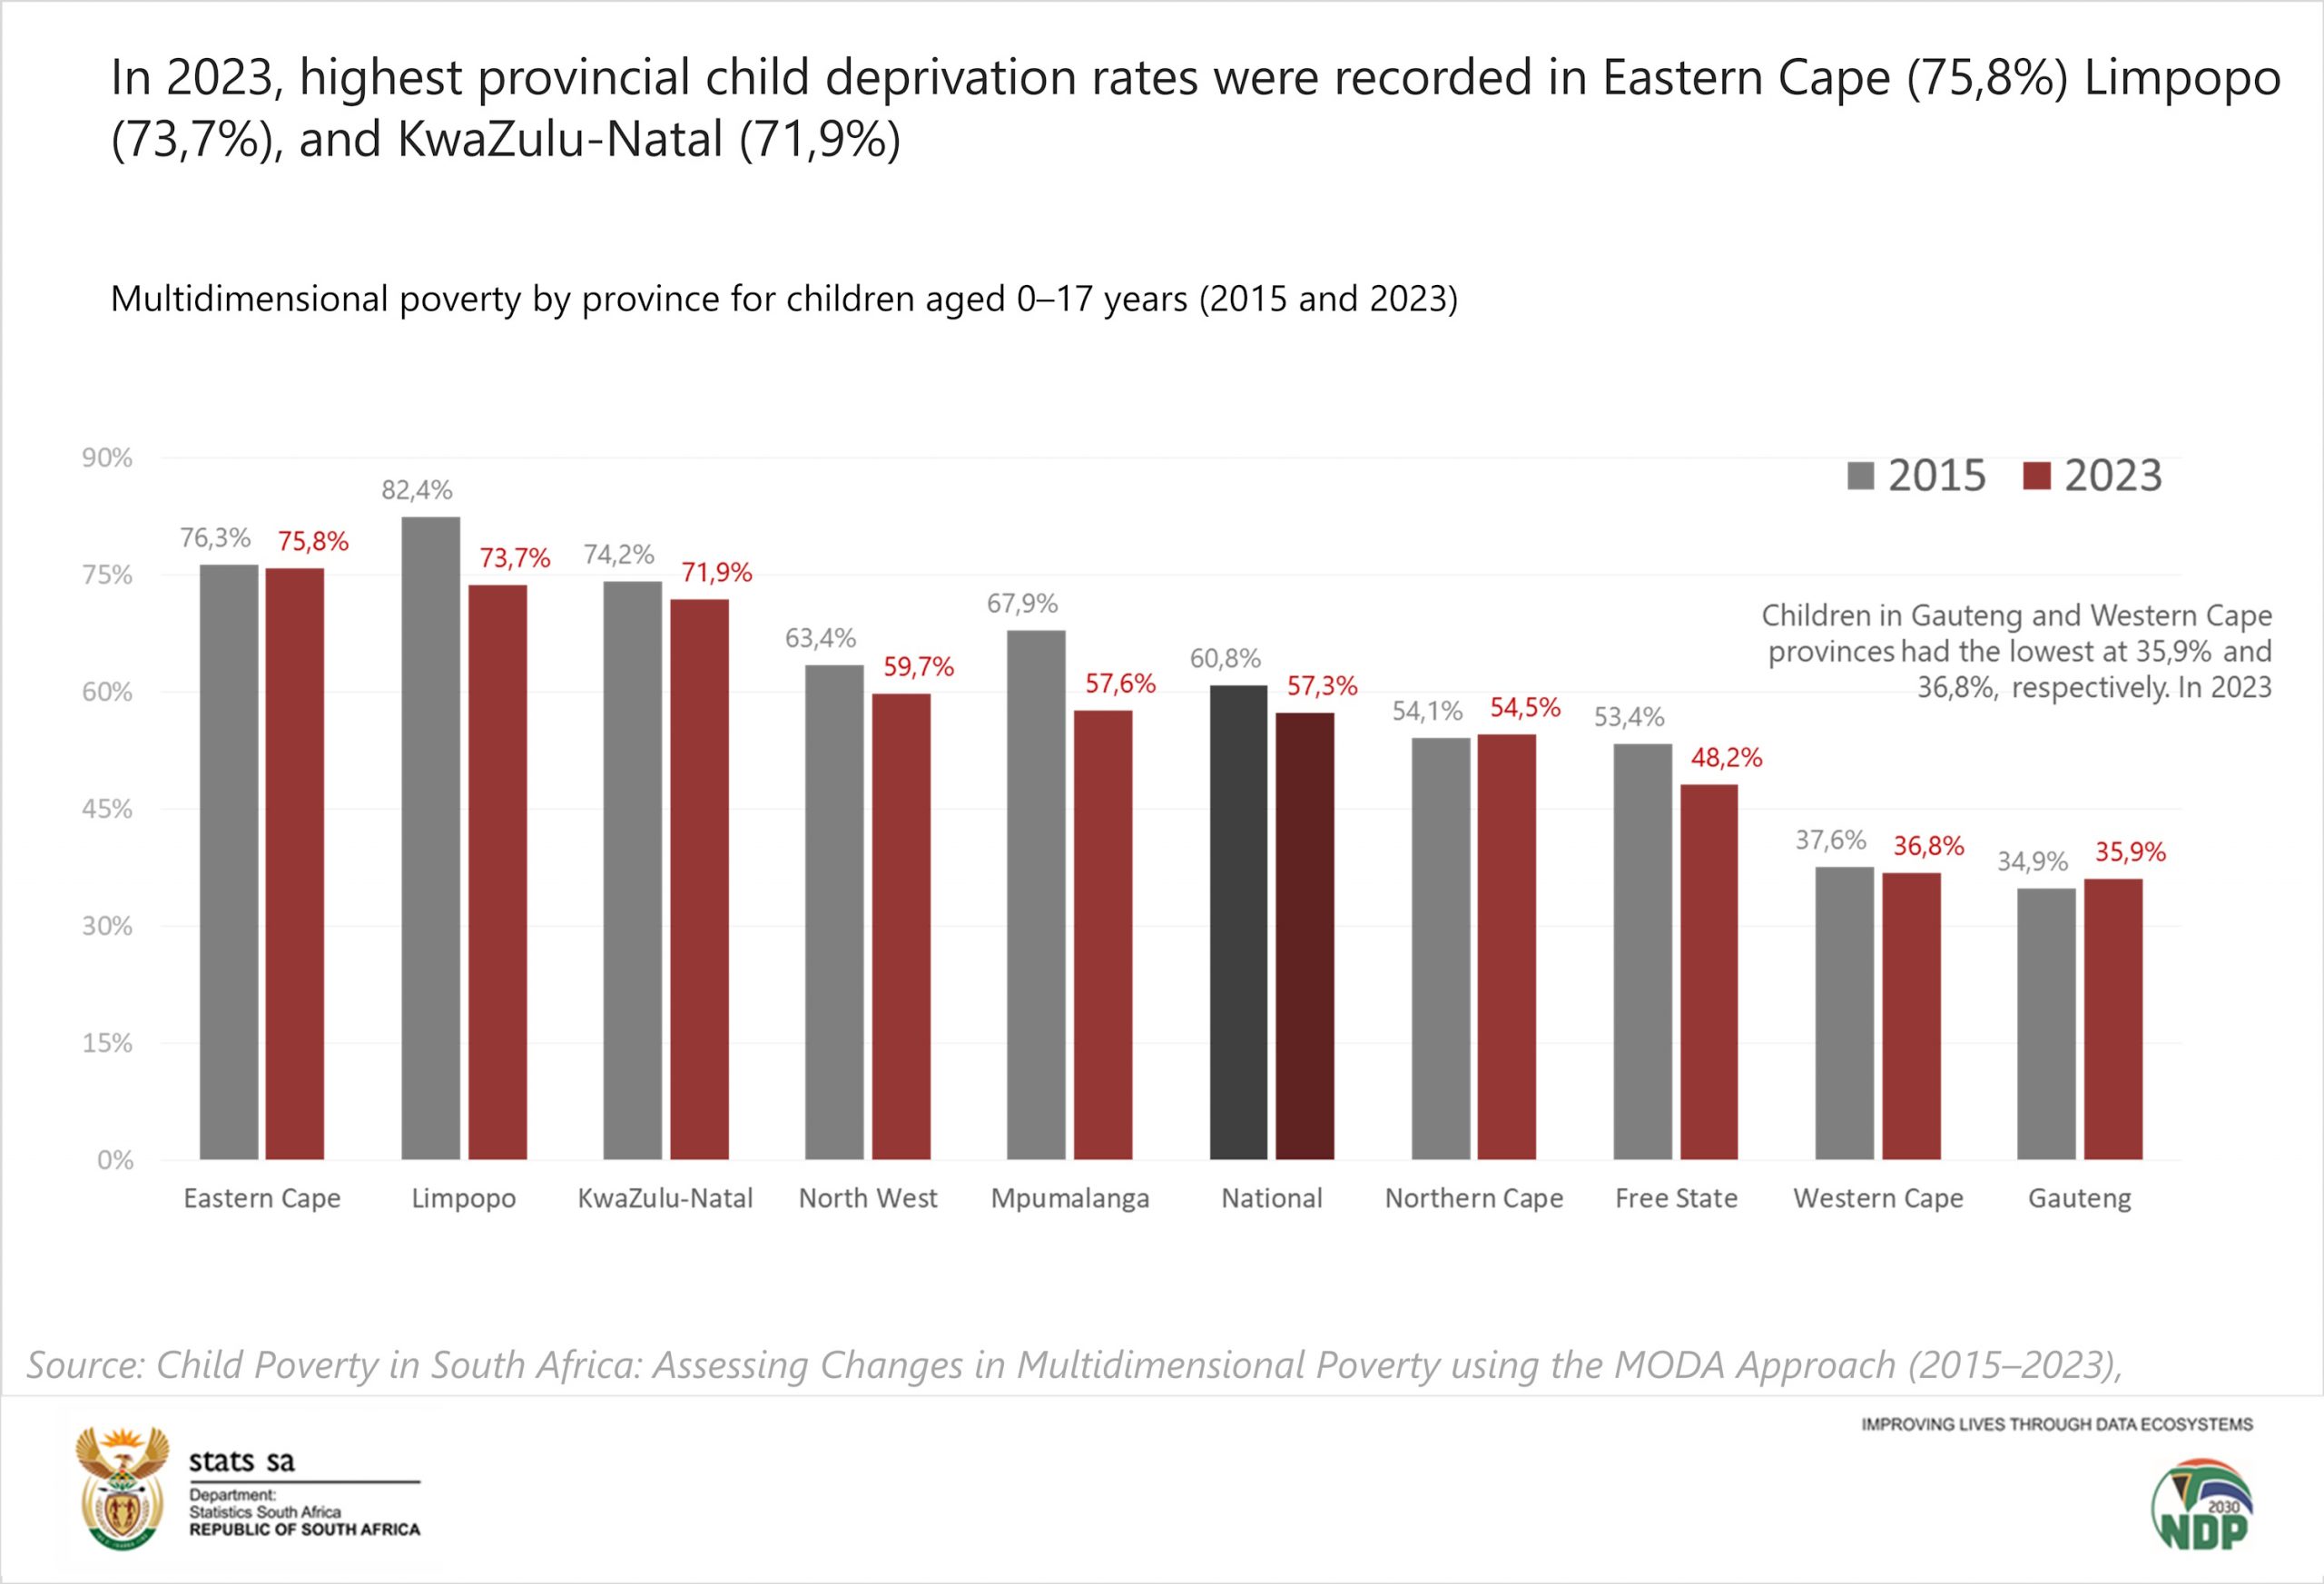
Clear geographic disparities in multidimensional child poverty were evident across the country. Provinces such as Limpopo, Eastern Cape and KwaZulu-Natal recorded the highest deprivation levels, despite some improvements observed over time. Notable progress was made in Limpopo, with deprivation declining from 82,4% in 2015 to 73,7% in 2023, while KwaZulu-Natal moved from 74,2% to 71,9%. The Eastern Cape showed a marginal shift from 76,3% to 75,8%. In contrast, Gauteng saw a minor increase from 34,9% to 35,9%, while the Western Cape recorded a negligible decline from 37,6% to 36,8%.
Variations in child deprivation were observed when comparing metropolitan and non‑metropolitan areas. In metropolitan areas, deprivation levels remained largely unchanged, dropping marginally from 40,0% in 2015 to 39,8% in 2023. In non-metropolitan areas, a more noticeable decline was recorded, with deprivation rates reducing slightly from over 72% in 2015 to just above 67%. These levels remained significantly higher than those in metropolitan areas. Children in non‑urban areas were also more likely to face multiple overlapping deprivations, compared to children in urban areas.
Socio-economic conditions of multidimensionally poor children
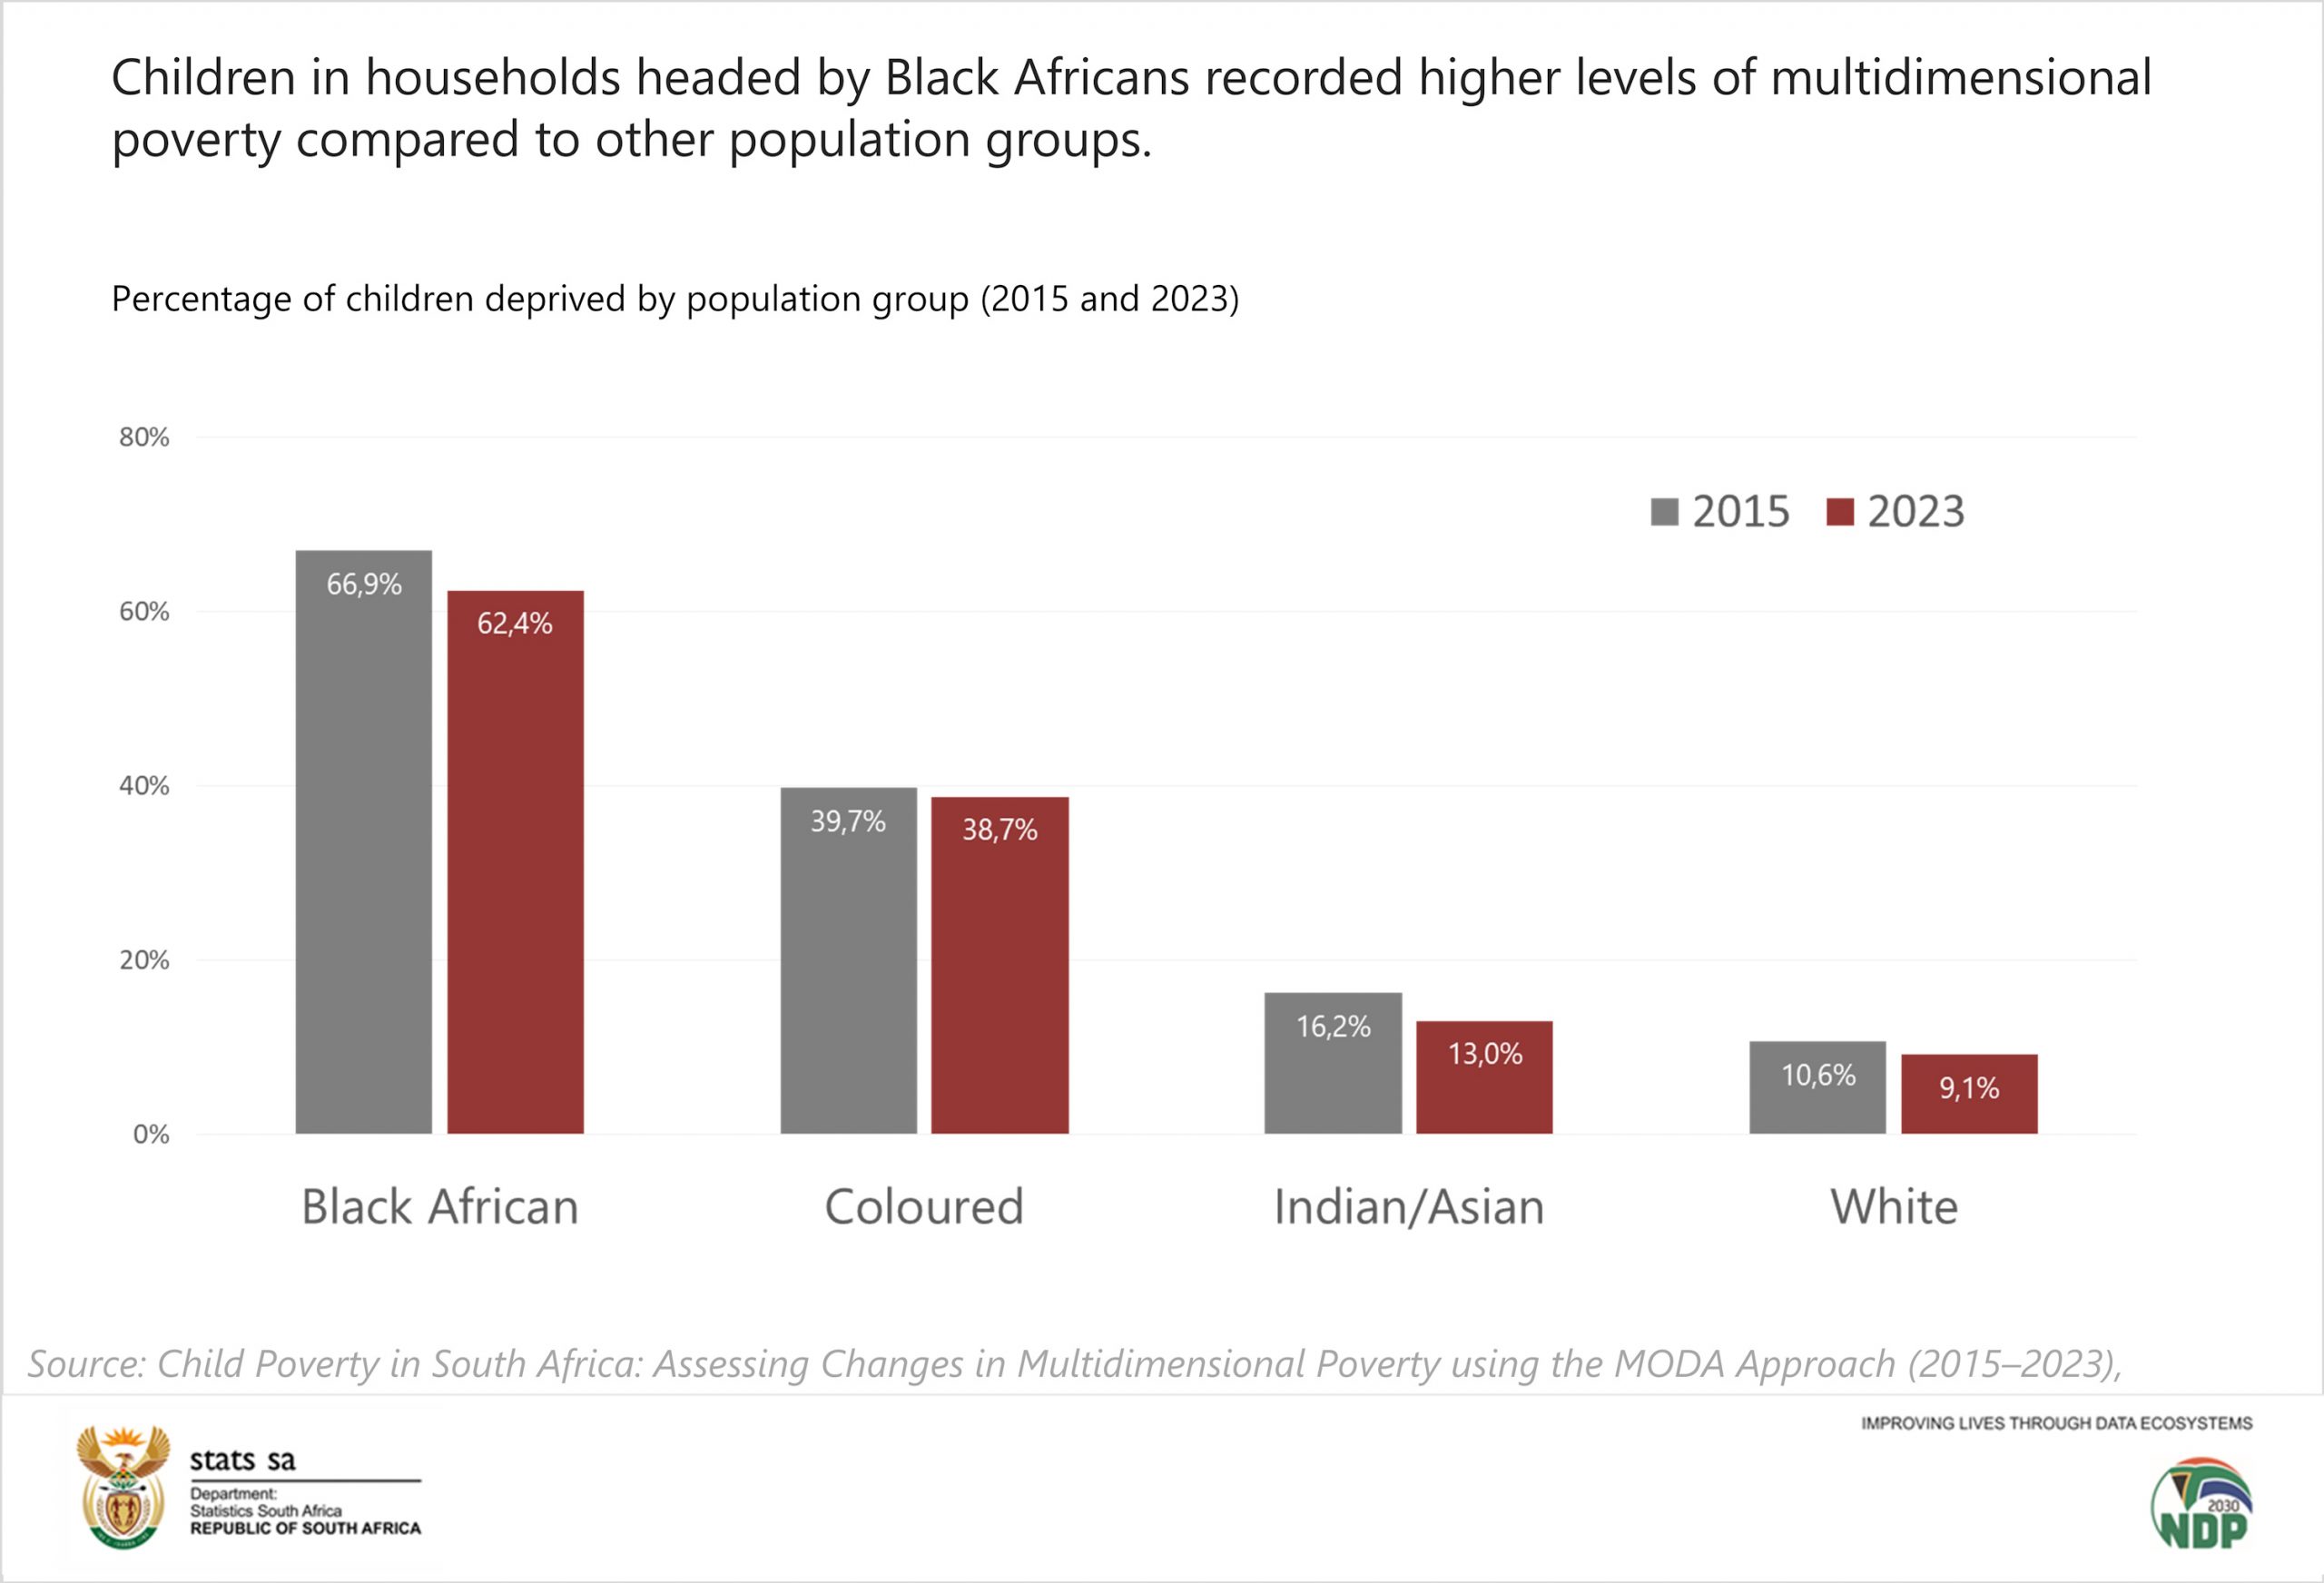
Socio‑economic circumstances also influenced children’s deprivation experiences. Highest deprivations were observed among children living in households where the head had little or no education, where no adult was employed and where household size was large. Persistent disparities across population groups also remained evident. Black/African children experienced the highest levels of multidimensional deprivation (from 66,9% in 2015 to 62,4% in 2023), although their rates improved over time. Coloured children followed, with a slight decline from 39,6% to 38,1%, while Indian/Asian children saw a more notable reduction from 16,7% to 12,9%. White children recorded the lowest levels of deprivation, decreasing from 10,7% to 9,0%.
Overlap between multidimensional and money-metric child poverty
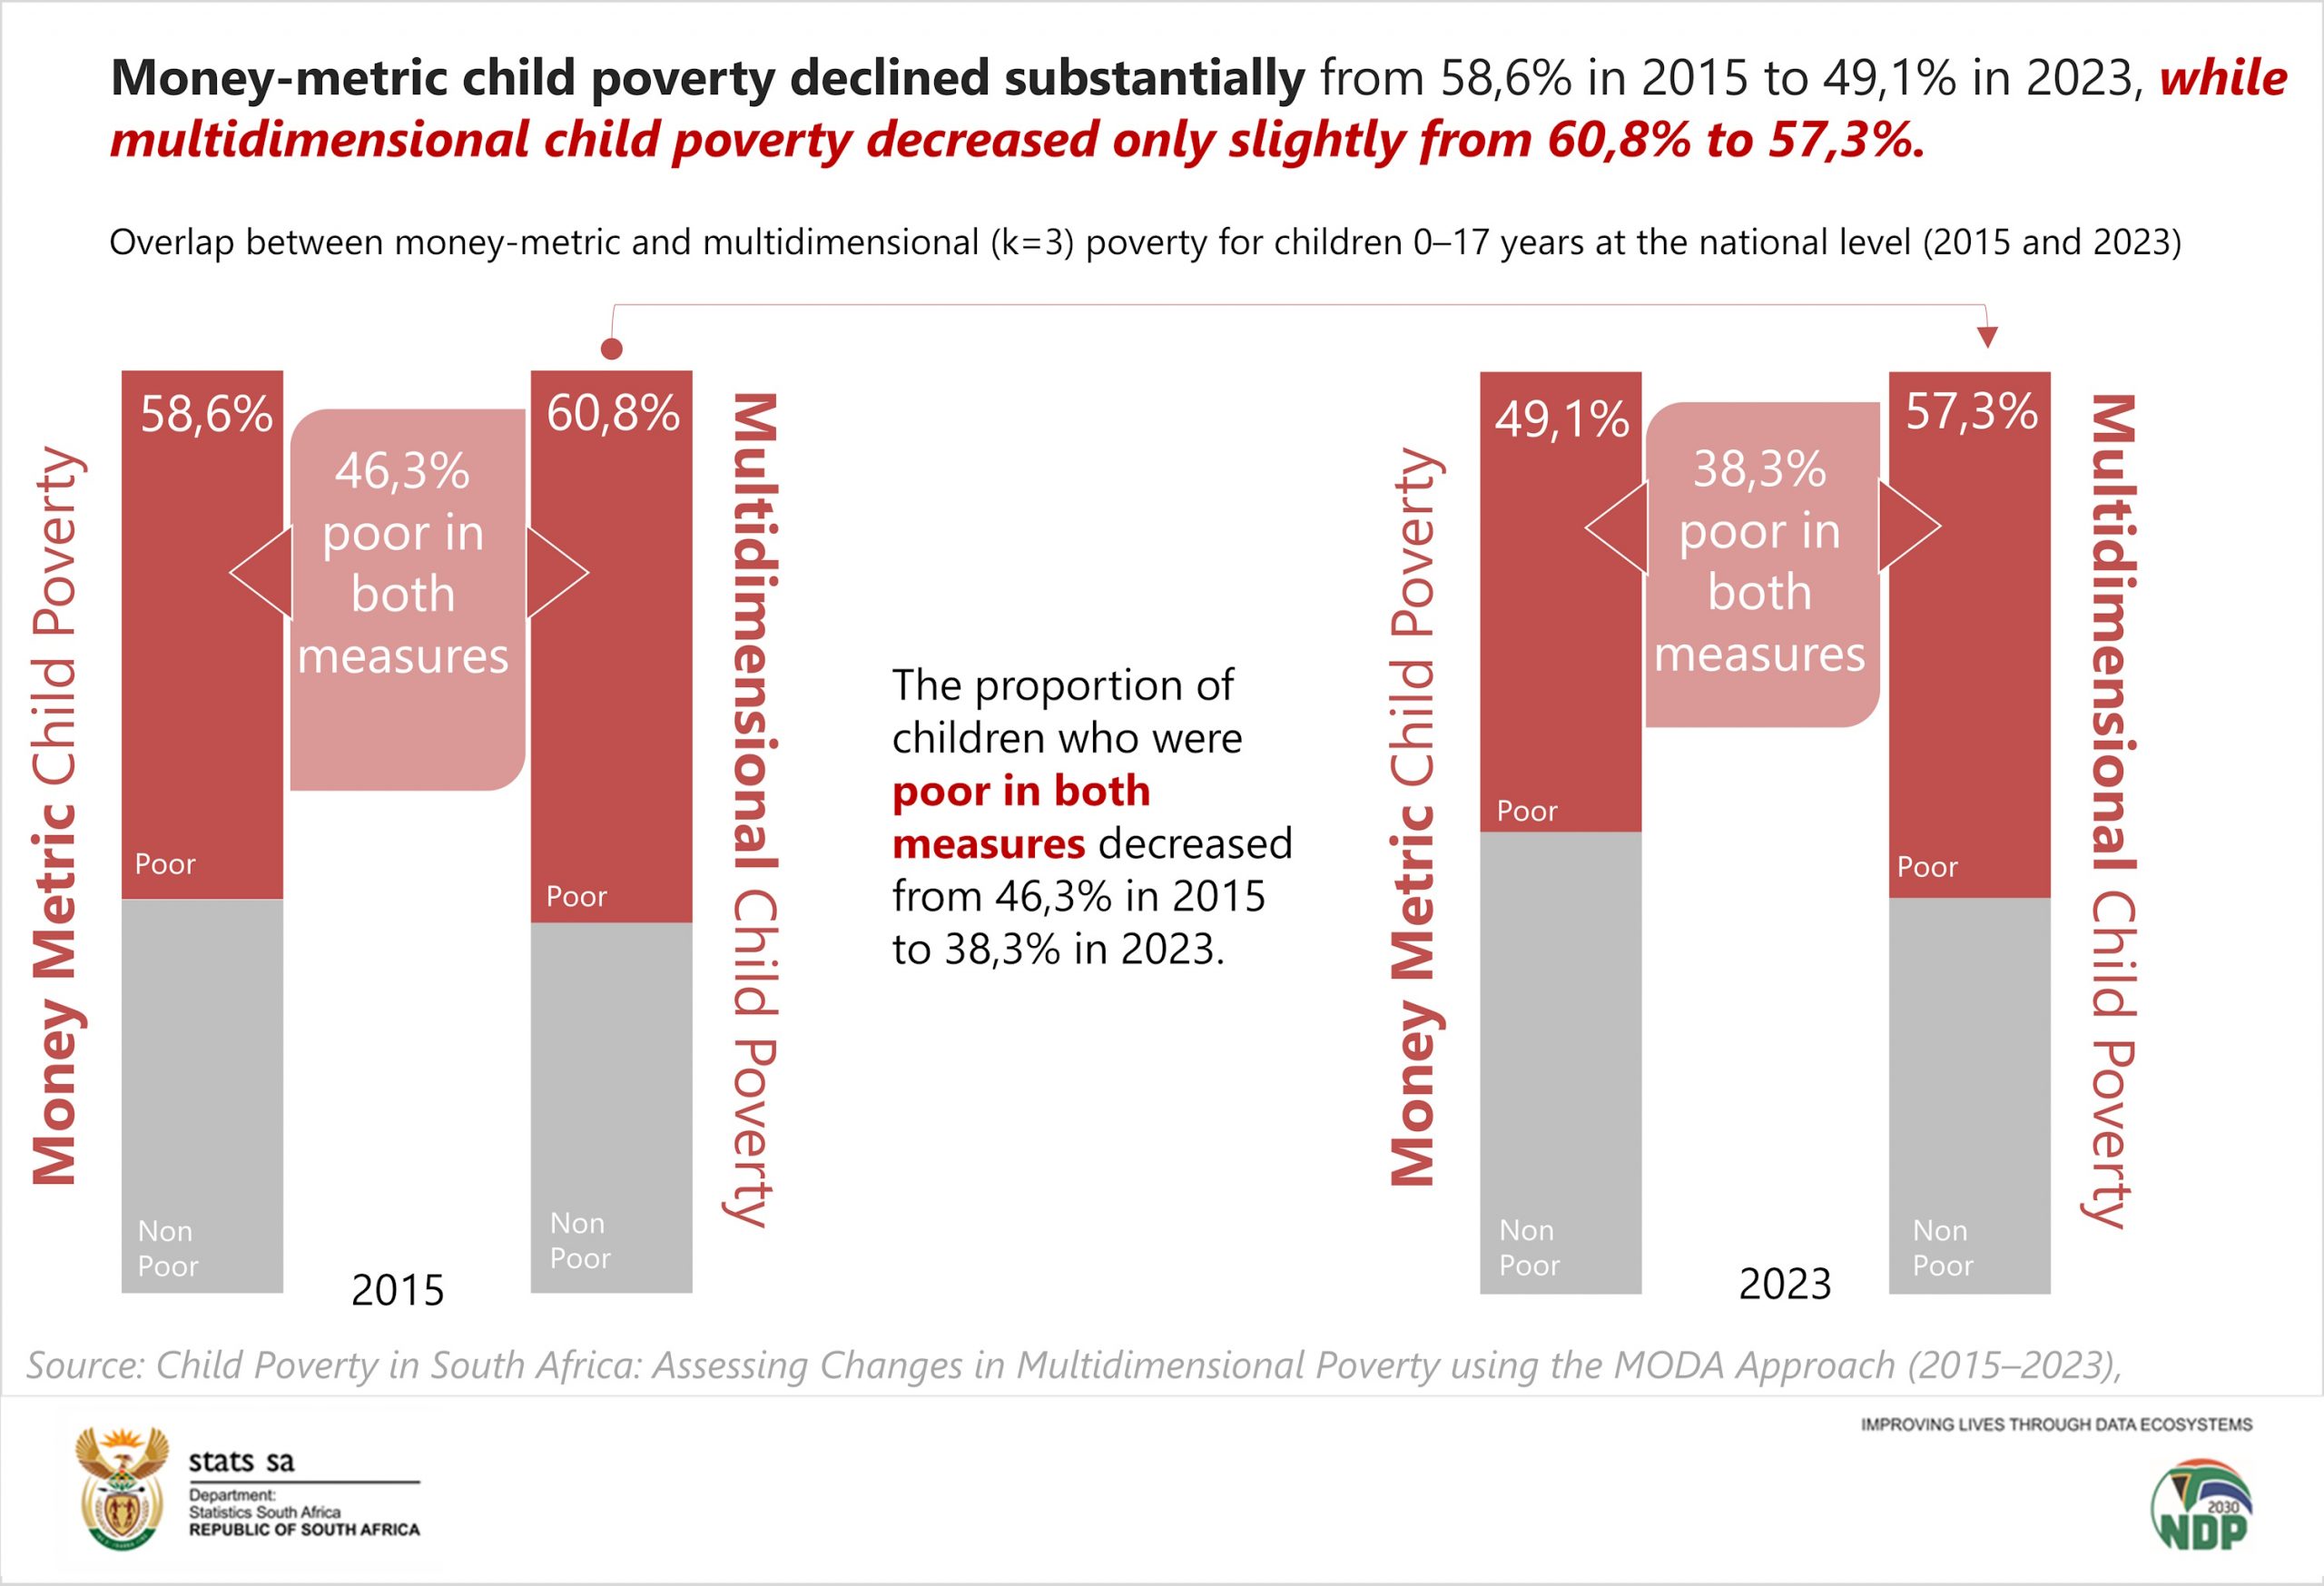
The report also draws a clear distinction between monetary and multidimensional child poverty. Money-metric child poverty declined substantially from 58,6% in 2015 to 49,1% in 2023, while multidimensional child poverty decreased only slightly from 60,8% to 57,3%. The proportion of children who were poor in both measures decreased from 46,3% in 2015 to 38,3% in 2023. The share of children who were only money-metric poor declined from 12,4% to 10,7%, while rates for those who were only multidimensionally poor increased from 14,6% to 18,9%, indicating that improvements in income did not always translate into better access to essential services and living conditions. Encouragingly, the proportion of children who were non‑poor in both measures rose by 5,2 percentage points.
Overall, while progress is visible in several areas, the findings suggests that multidimensional deprivation remained widespread and deeply embedded in the lives of many children in South Africa.
For more information, download the full report here.
By Elizabeth Mosane and Davyson Chauke