
Provincial Gaps Persist in Access to Private Healthcare Cover
For millions of households, navigating medical costs is a delicate balancing act—one that reveals who can access quality care, who must sacrifice to afford it, and who is left to depend entirely on public services.
While private medical cover remains out of reach for most, households still dig into their pockets to pay for essentials such as medicines, outpatient care, and preventative services. These everyday expenses, even when modest, form a significant share of total health spending. Geographic and socio-economic differences in coverage and expenditure show that income and location are closely associated with health service access and spending patterns.
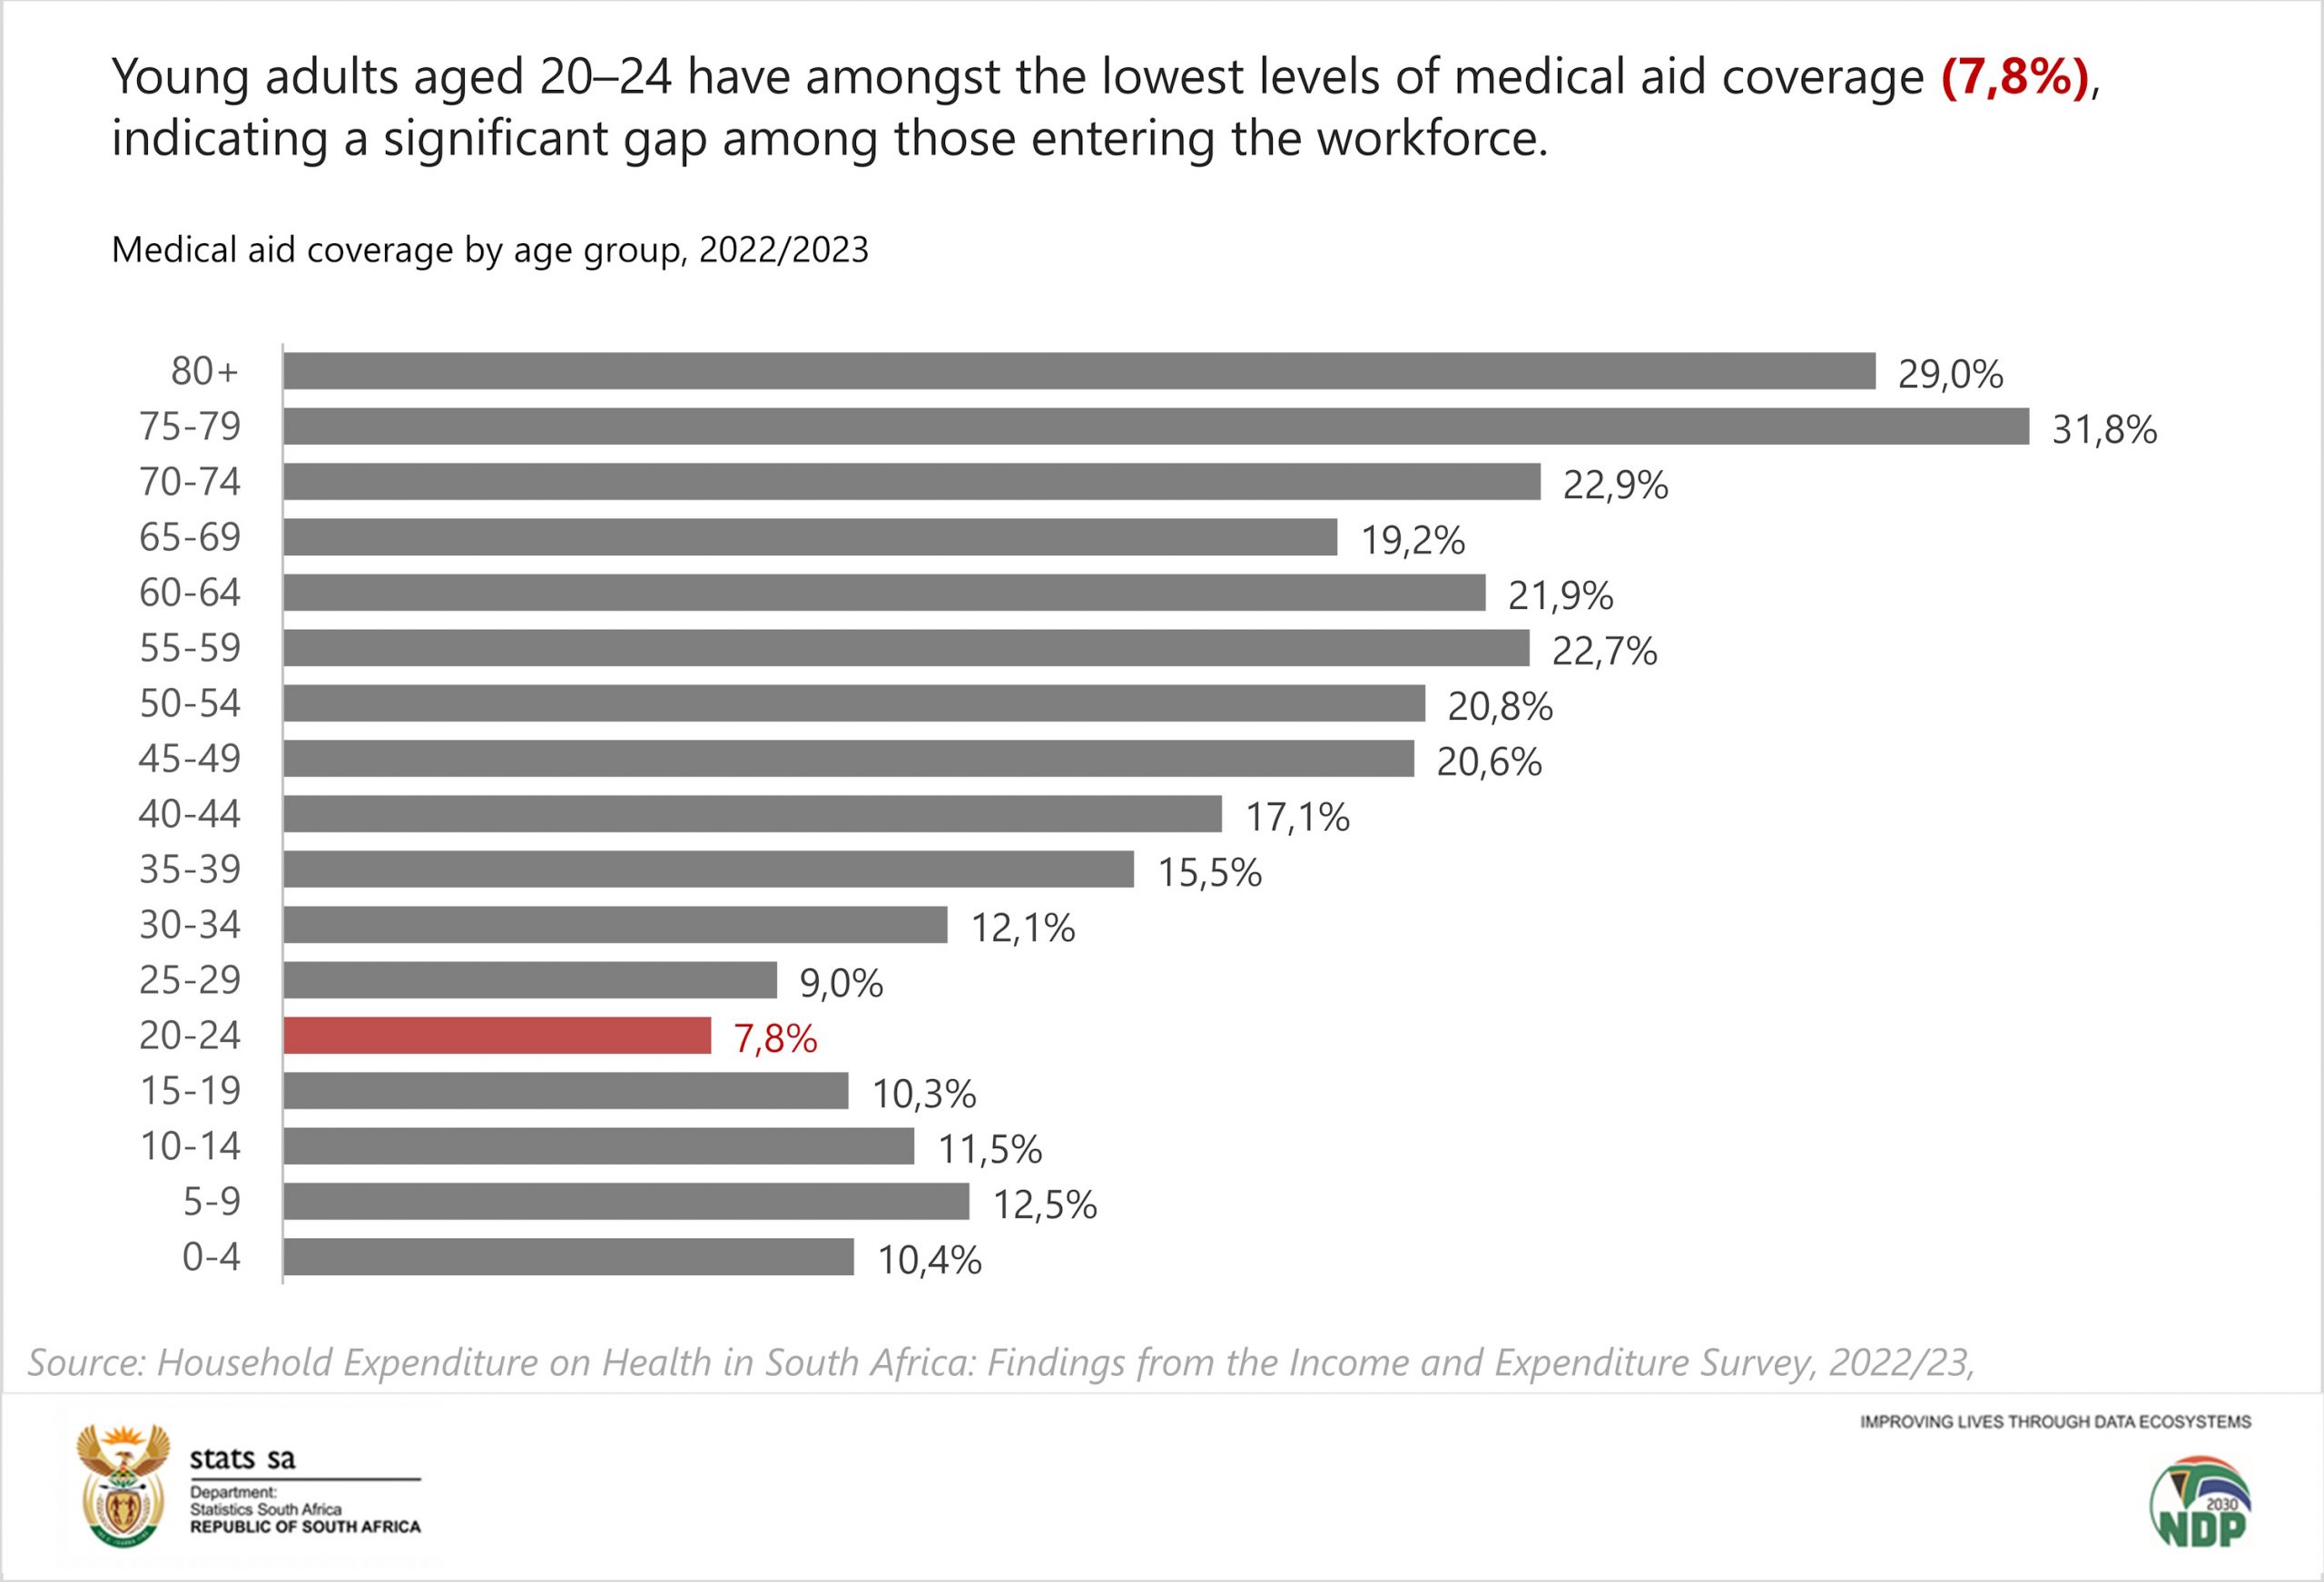
According to the Household Expenditure on Health in South Africa: Findings from the Income and Expenditure Survey, 2022/23 report, 14,1% of the population is covered by medical aid. The report, released by Statistics South Africa, also shows that young adults aged 20–24 have the lowest levels of medical aid coverage across all age groups.
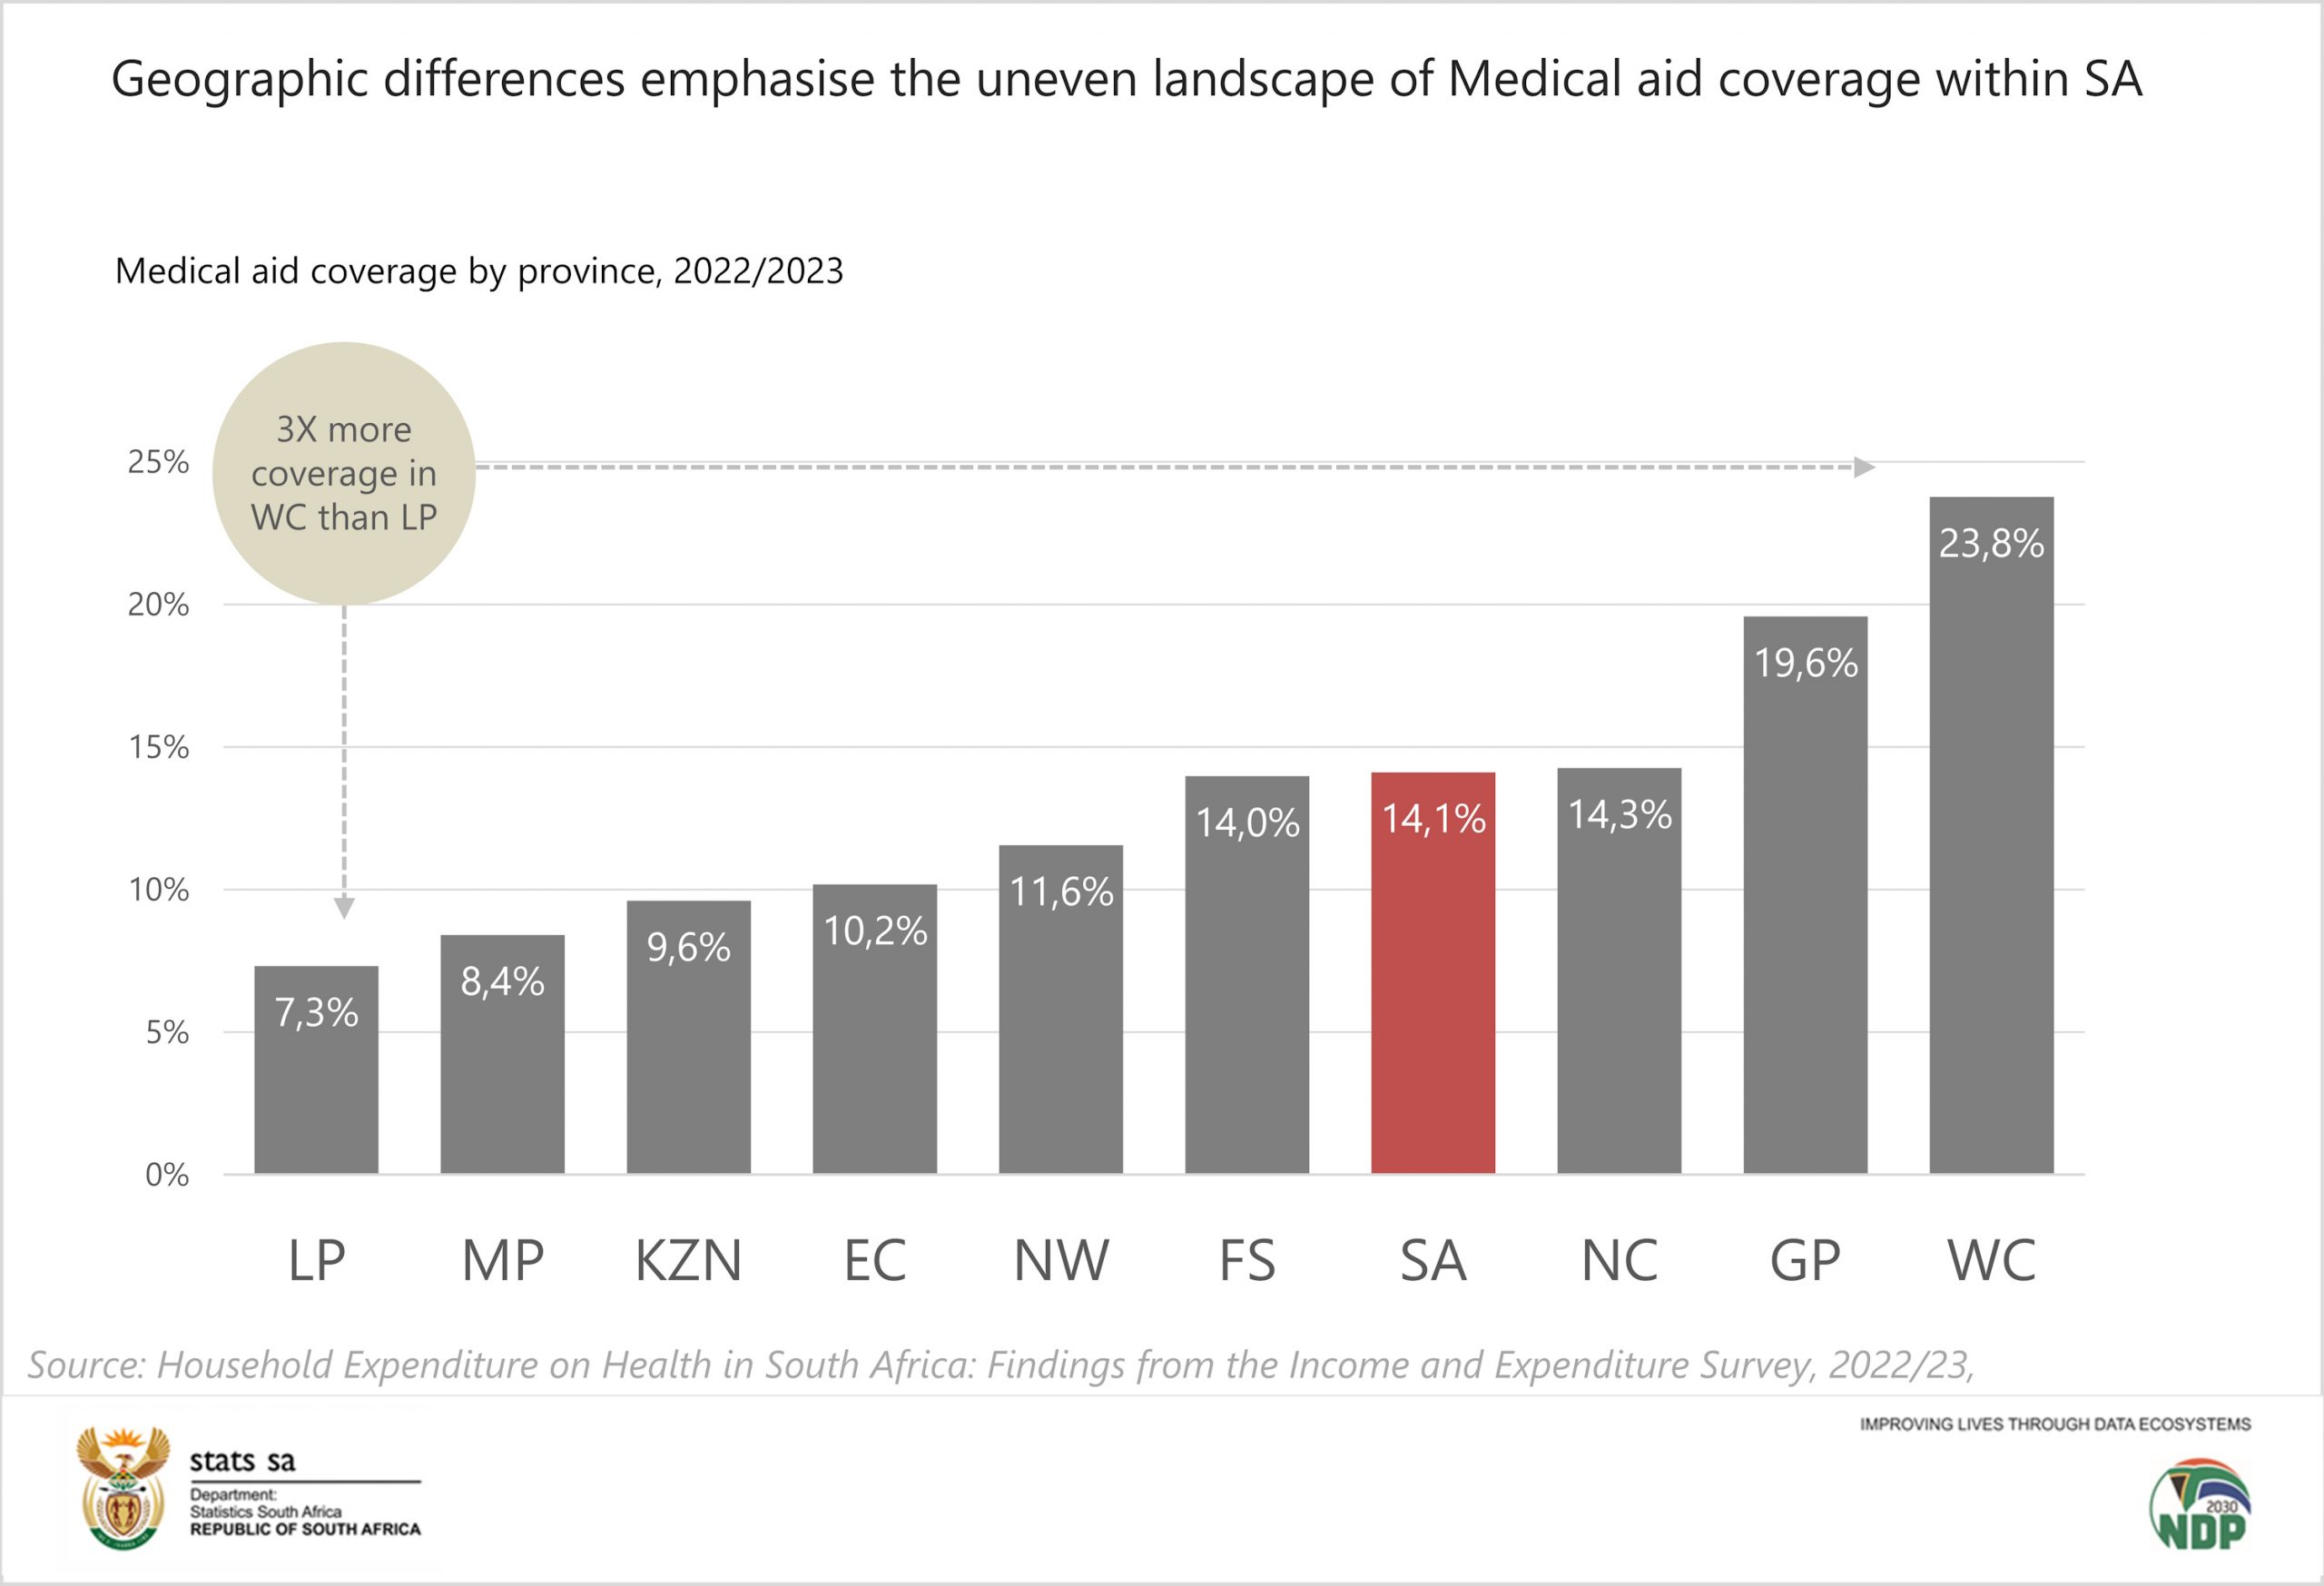
Geographic differences show variation in medical aid coverage across provinces. The Western Cape (23,8%), Gauteng (19,6%), and Northern Cape (14,3%) recorded the highest proportions of residents with medical aid. On the opposite end, Limpopo (7,3%) and Mpumalanga (8,4%) reported the lowest coverage levels.
Information from the report shows notable differences in how South African households contribute to medical aid. Although male‑headed households have lower medical aid coverage, they contribute twice as much as female‑headed households — R71,8 billion compared with R31,7 billion. On average, male‑headed households paid R27 662, while female‑headed households contributed R20 875.
Population group patterns reveal further contrasts. Households in the white population group contributed the most to medical aid at R48,1 billion, followed by black African households at R40,4 billion. Yet, despite contributing the second‑highest total amount, black African households recorded the lowest annual average contribution, at R18 561 per household.
Households in urban settlements contributed more to medical aid than those in other settlement types, but their average annual contribution was lower than that of households in farm settlements. Provincially, Gauteng recorded the highest total contribution at R36,1 billion, while the Northern Cape contributed the least at R1,8 billion. On average, Western Cape households contributed the most, with an annual amount of R36 009 per household, and a slightly lower figure of R35 447 reported as the annual average contribution.
Out‑of‑pocket spending amounted to R31,5 billion, averaging R1 481 per household — the equivalent of 1% of total household expenditure.
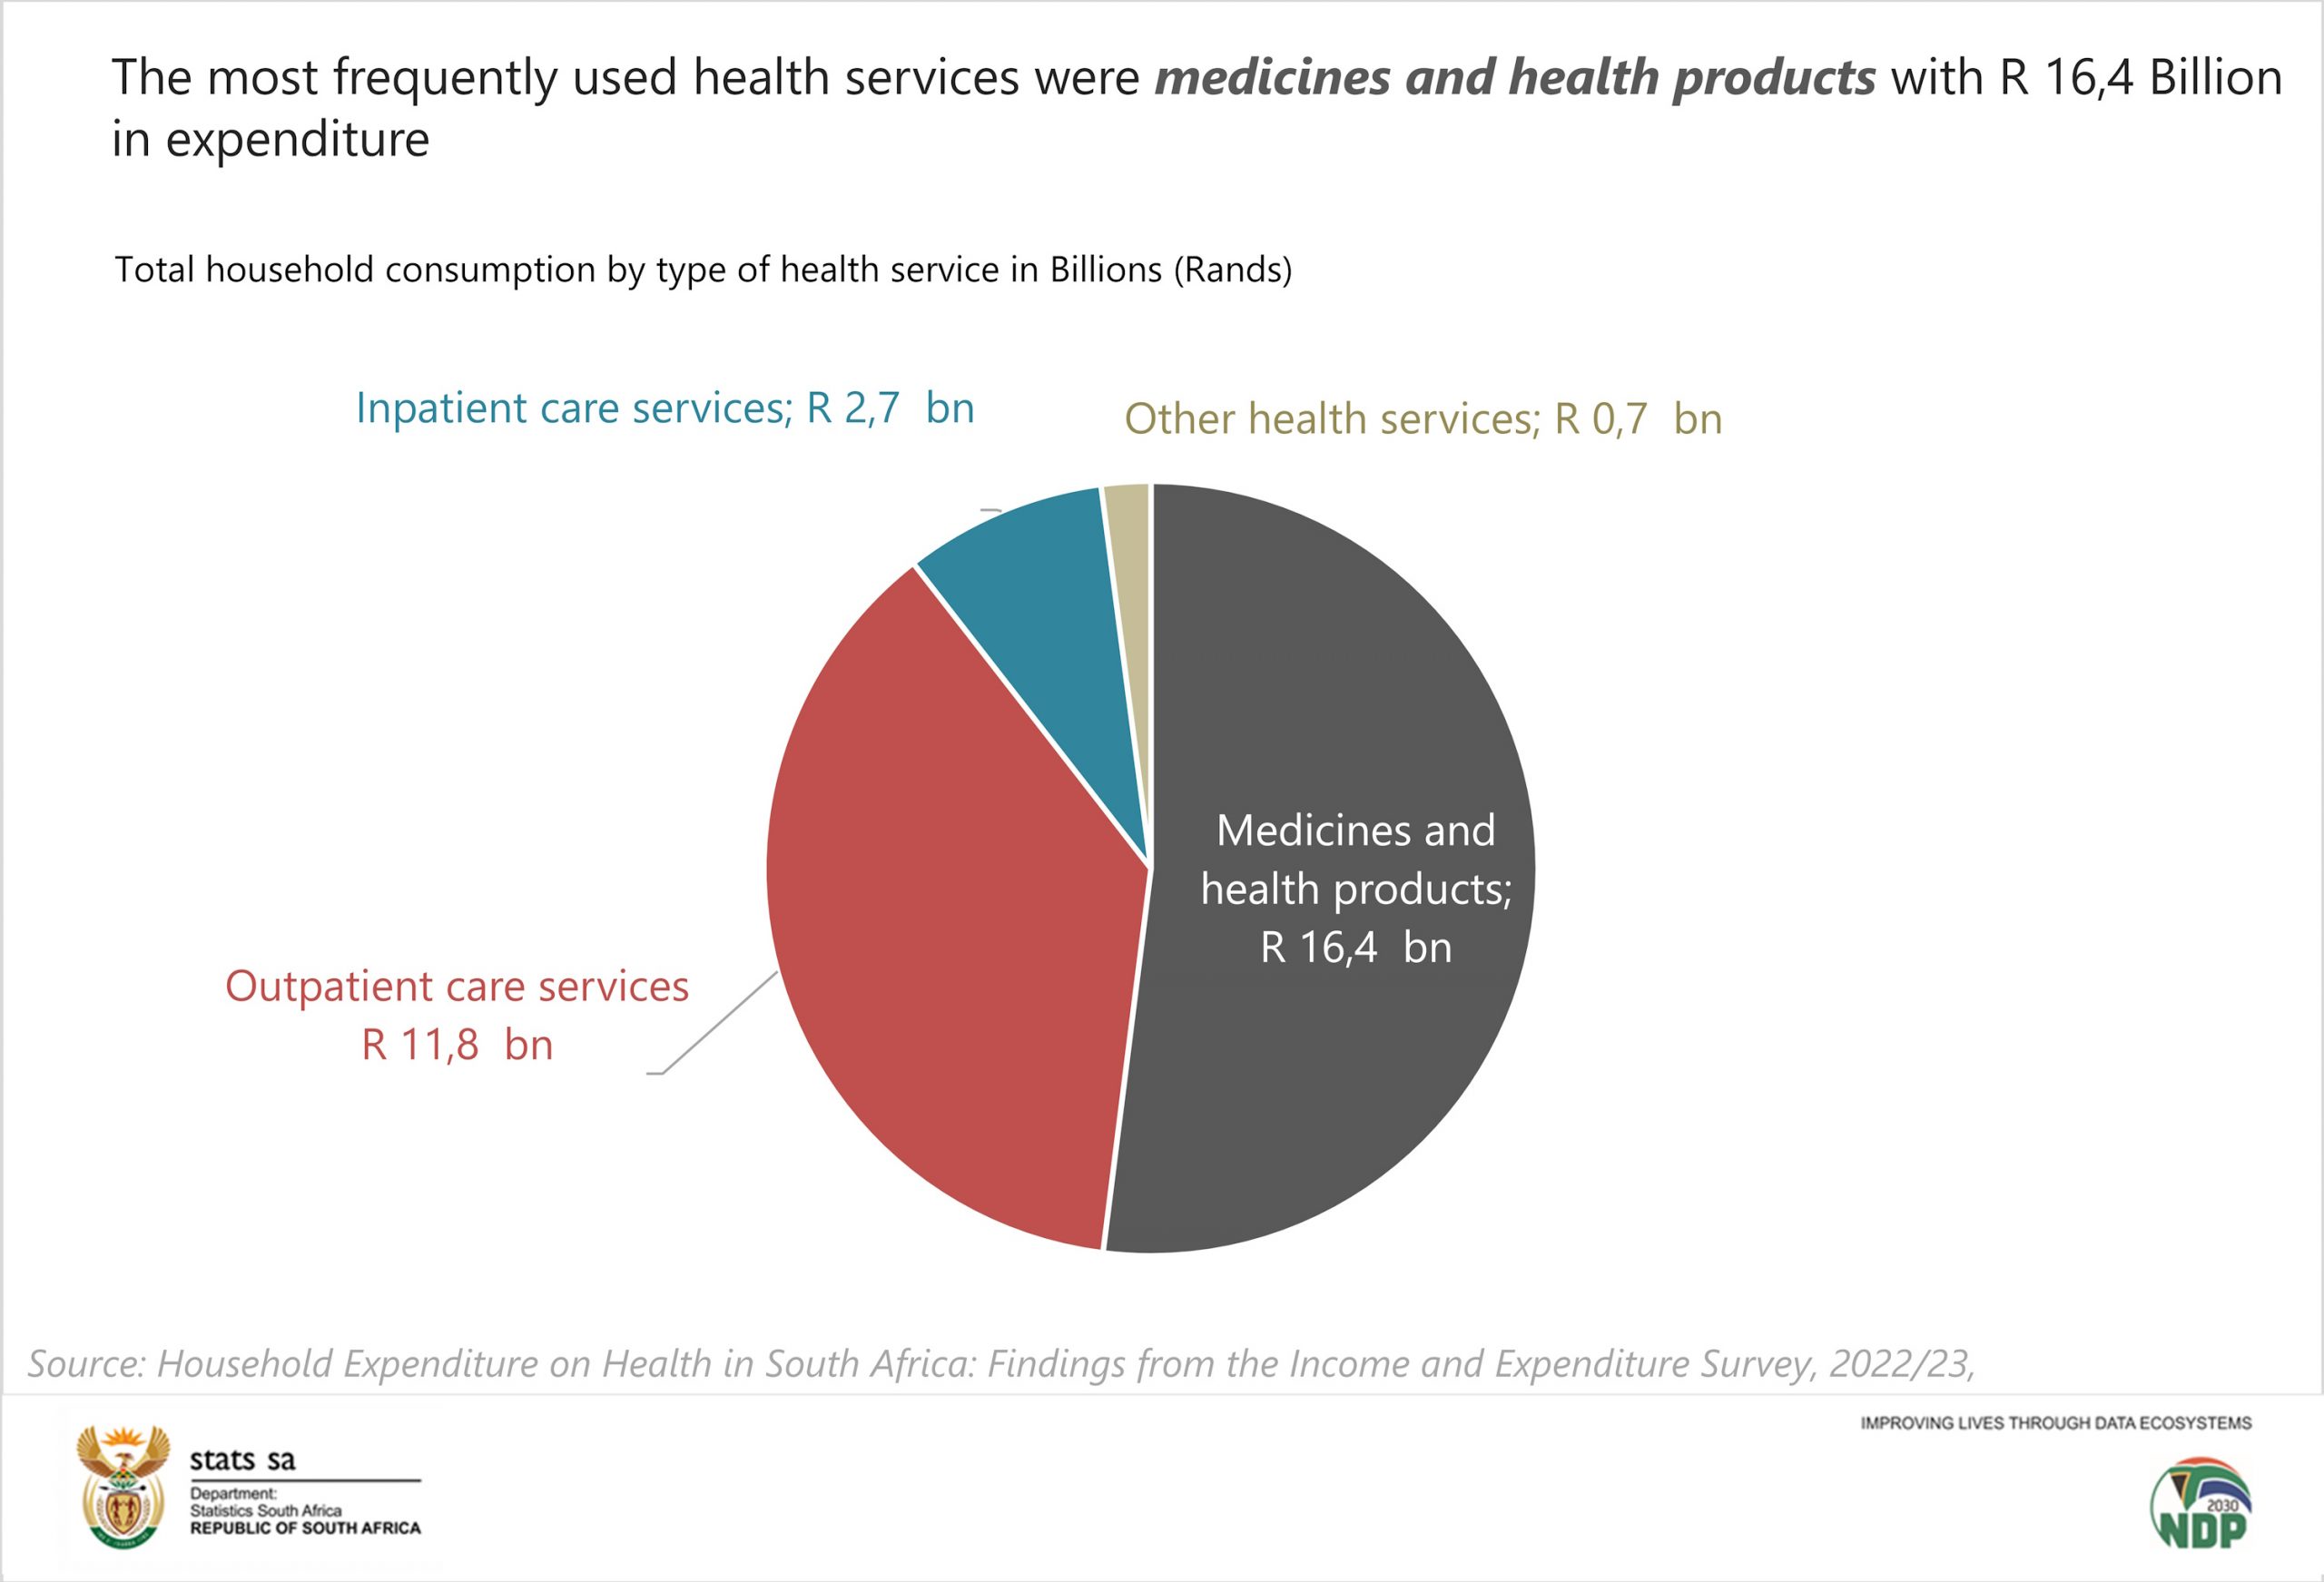
The most frequently used health services were medicines and health products, followed by outpatient care and then inpatient care. Households spent R11,2 billion on medicines — R5,0 billion on prescribed medicines and R4,5 billion on non‑prescription products. Spending on assistive products for vision reached R3,5 billion, while outpatient curative and rehabilitative services accounted for R3,2 billion.
For more information, download the report here.