

The latest set of physical energy flow accounts released by Stats SA provides two new energy indicators which answer the following questions: To what extent does South Africa depend on energy products of other countries to meet its energy needs, and how much energy do South African households use per person?
Physical energy flow accounts track the movement of energy from the environment into the economy, within the economy, and from the economy back into the environment. These accounts provide an overview of where energy comes from (supply) and where it is consumed (use). The data from the physical energy flow accounts are used to calculate several energy indicators, including the energy dependency ratio and household energy use per capita.
Determining our energy sovereignty
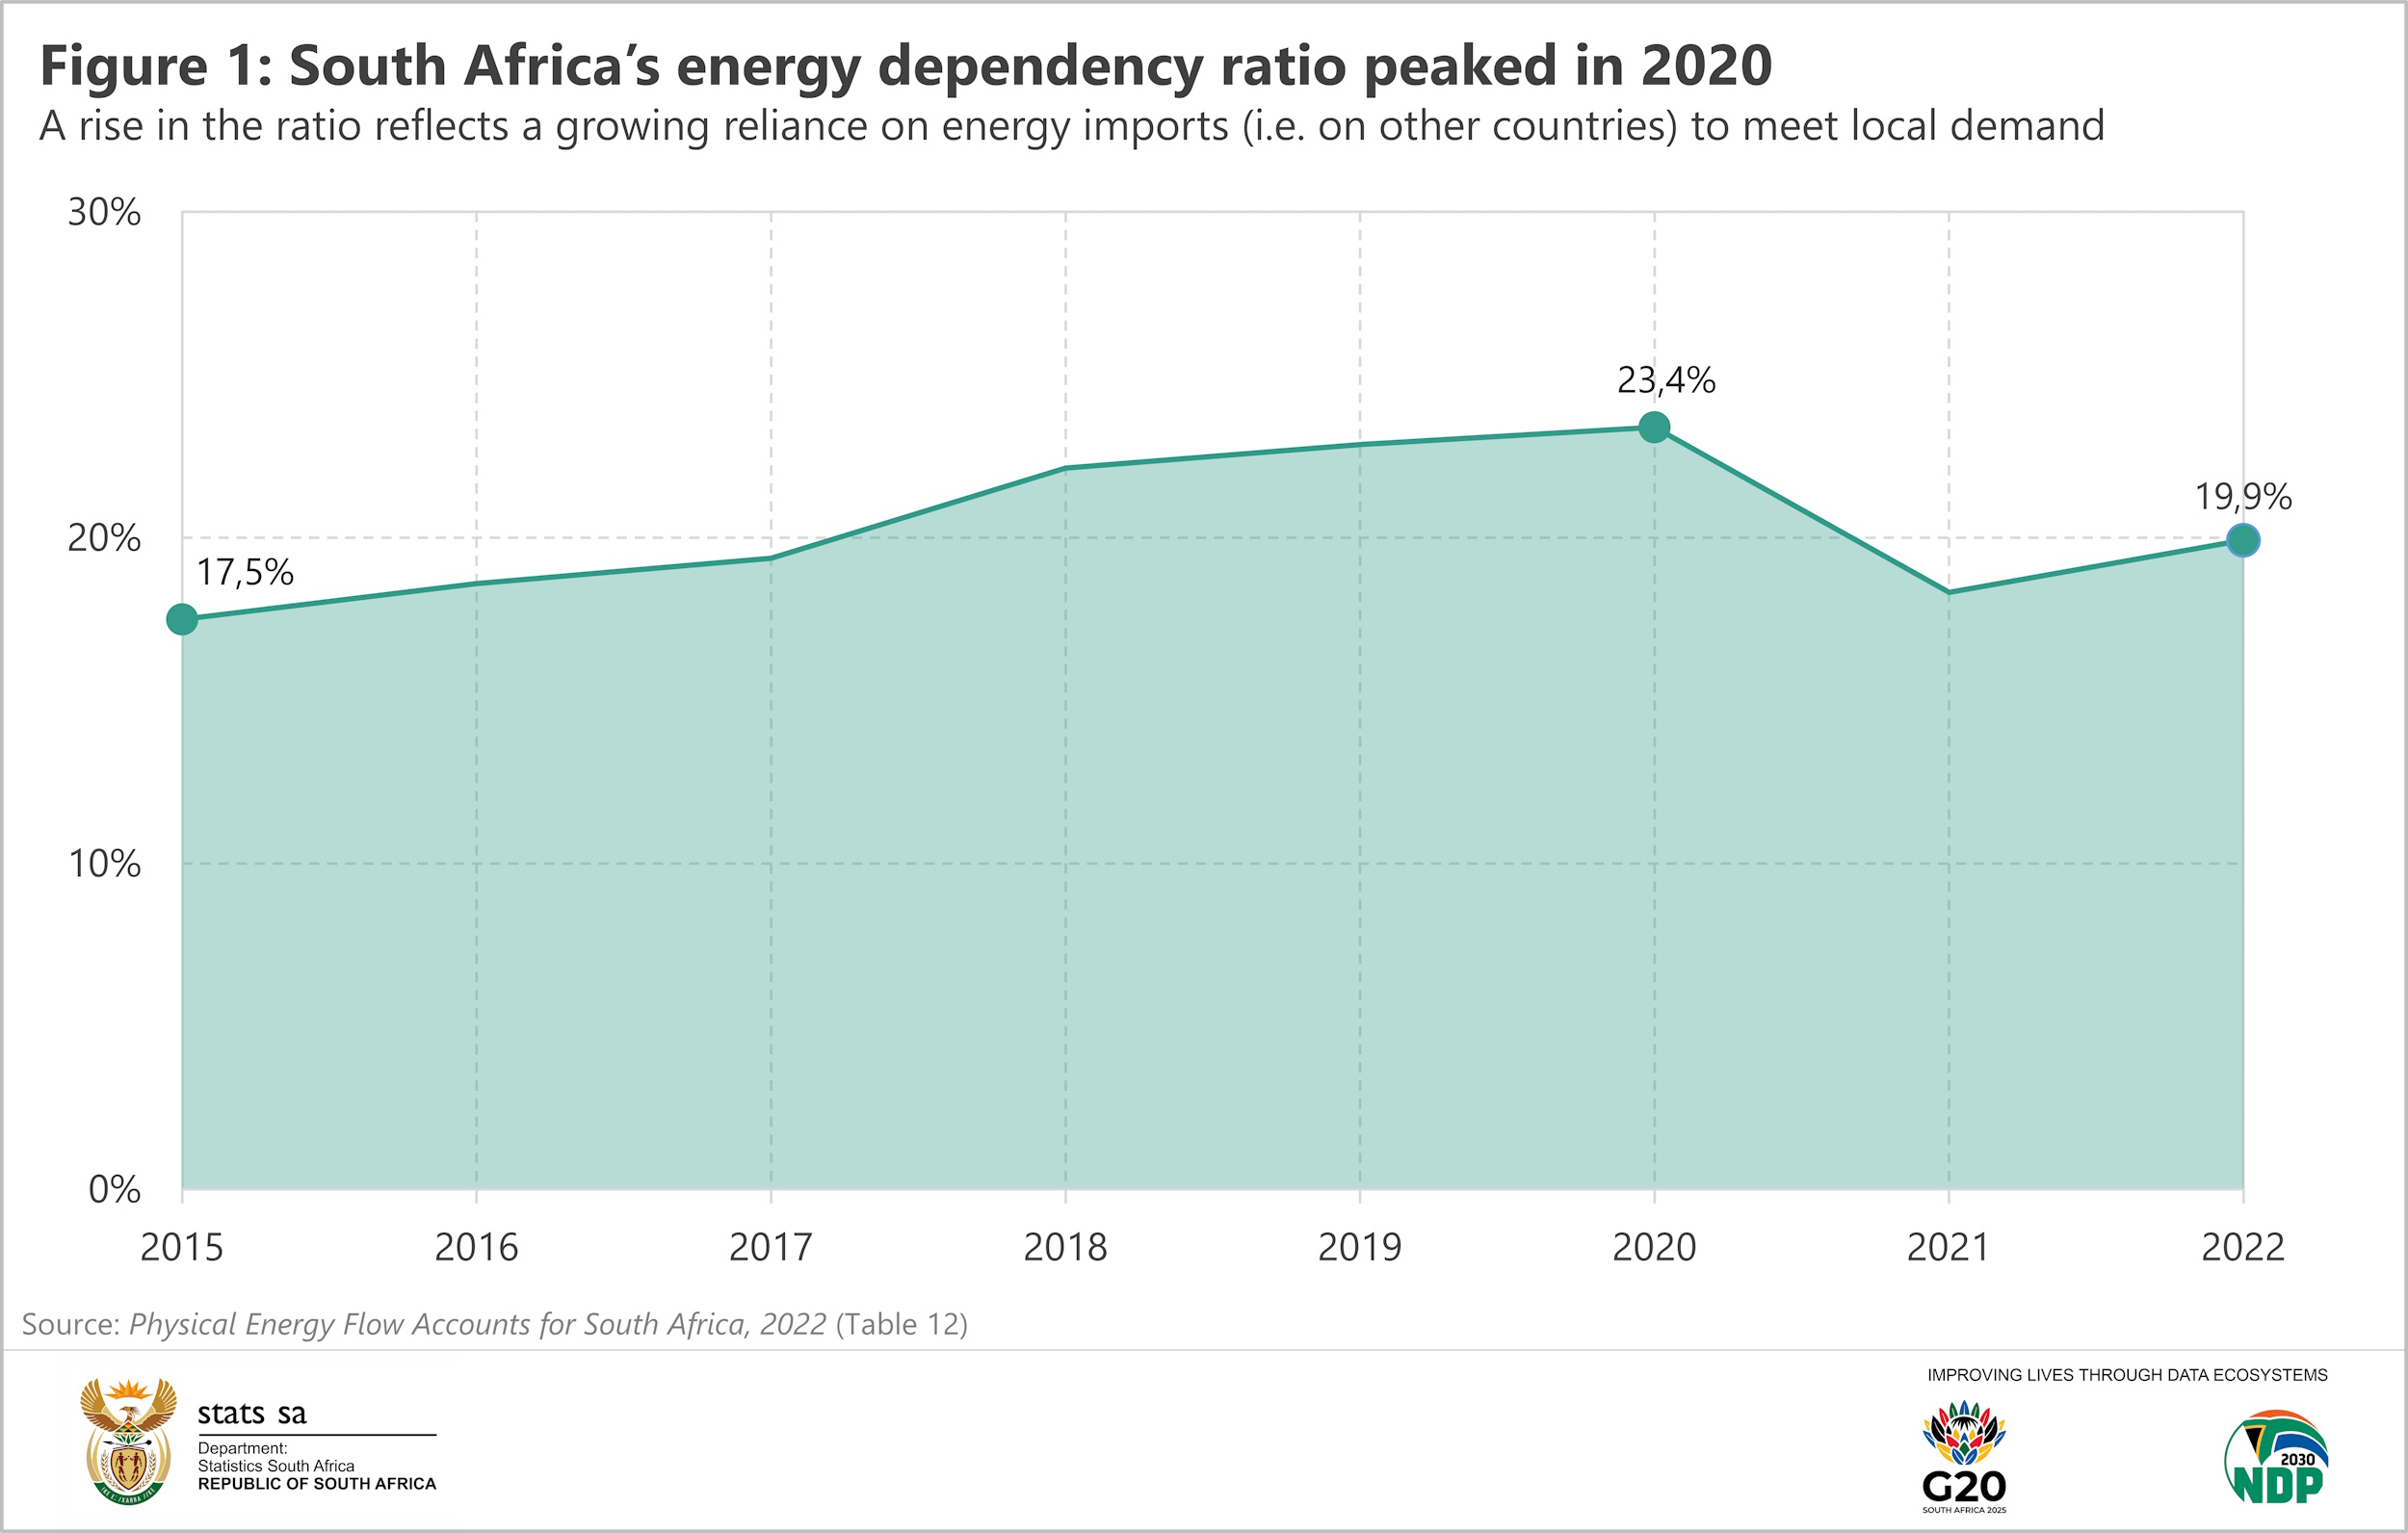
The energy dependency ratio measures how much a country (i.e. an economy) relies on the international community (i.e. other countries) to meet its energy needs. The ratio is calculated by dividing the volume of imported energy products by local (domestic) energy consumption, then expressing the result as a percentage.
A high energy dependency ratio indicates a strong reliance on energy imports to meet local energy demand. A country in this scenario has less control over its energy supply and is more vulnerable to geopolitical and economic risks. On the flipside, a low energy dependency ratio indicates a degree of self-sufficiency or ‘energy sovereignty’.
South Africa’s total energy dependency ratio peaked at 23,4% in 2020. In 2022, the ratio was 19,9% (Figure 1). Despite the lower ratio in 2022 compared with 2020, it is still higher than the ratio recorded in 2015 (17,5%).
The energy dependency ratio is also available for major energy products, providing a more nuanced picture. What is striking about Figure 2 below is the extremely high energy dependency ratios for natural gas and oil & oil products. South Africa’s consumption is dominated by imports, making the country ‘energy dependent’ for these two crucial energy products.
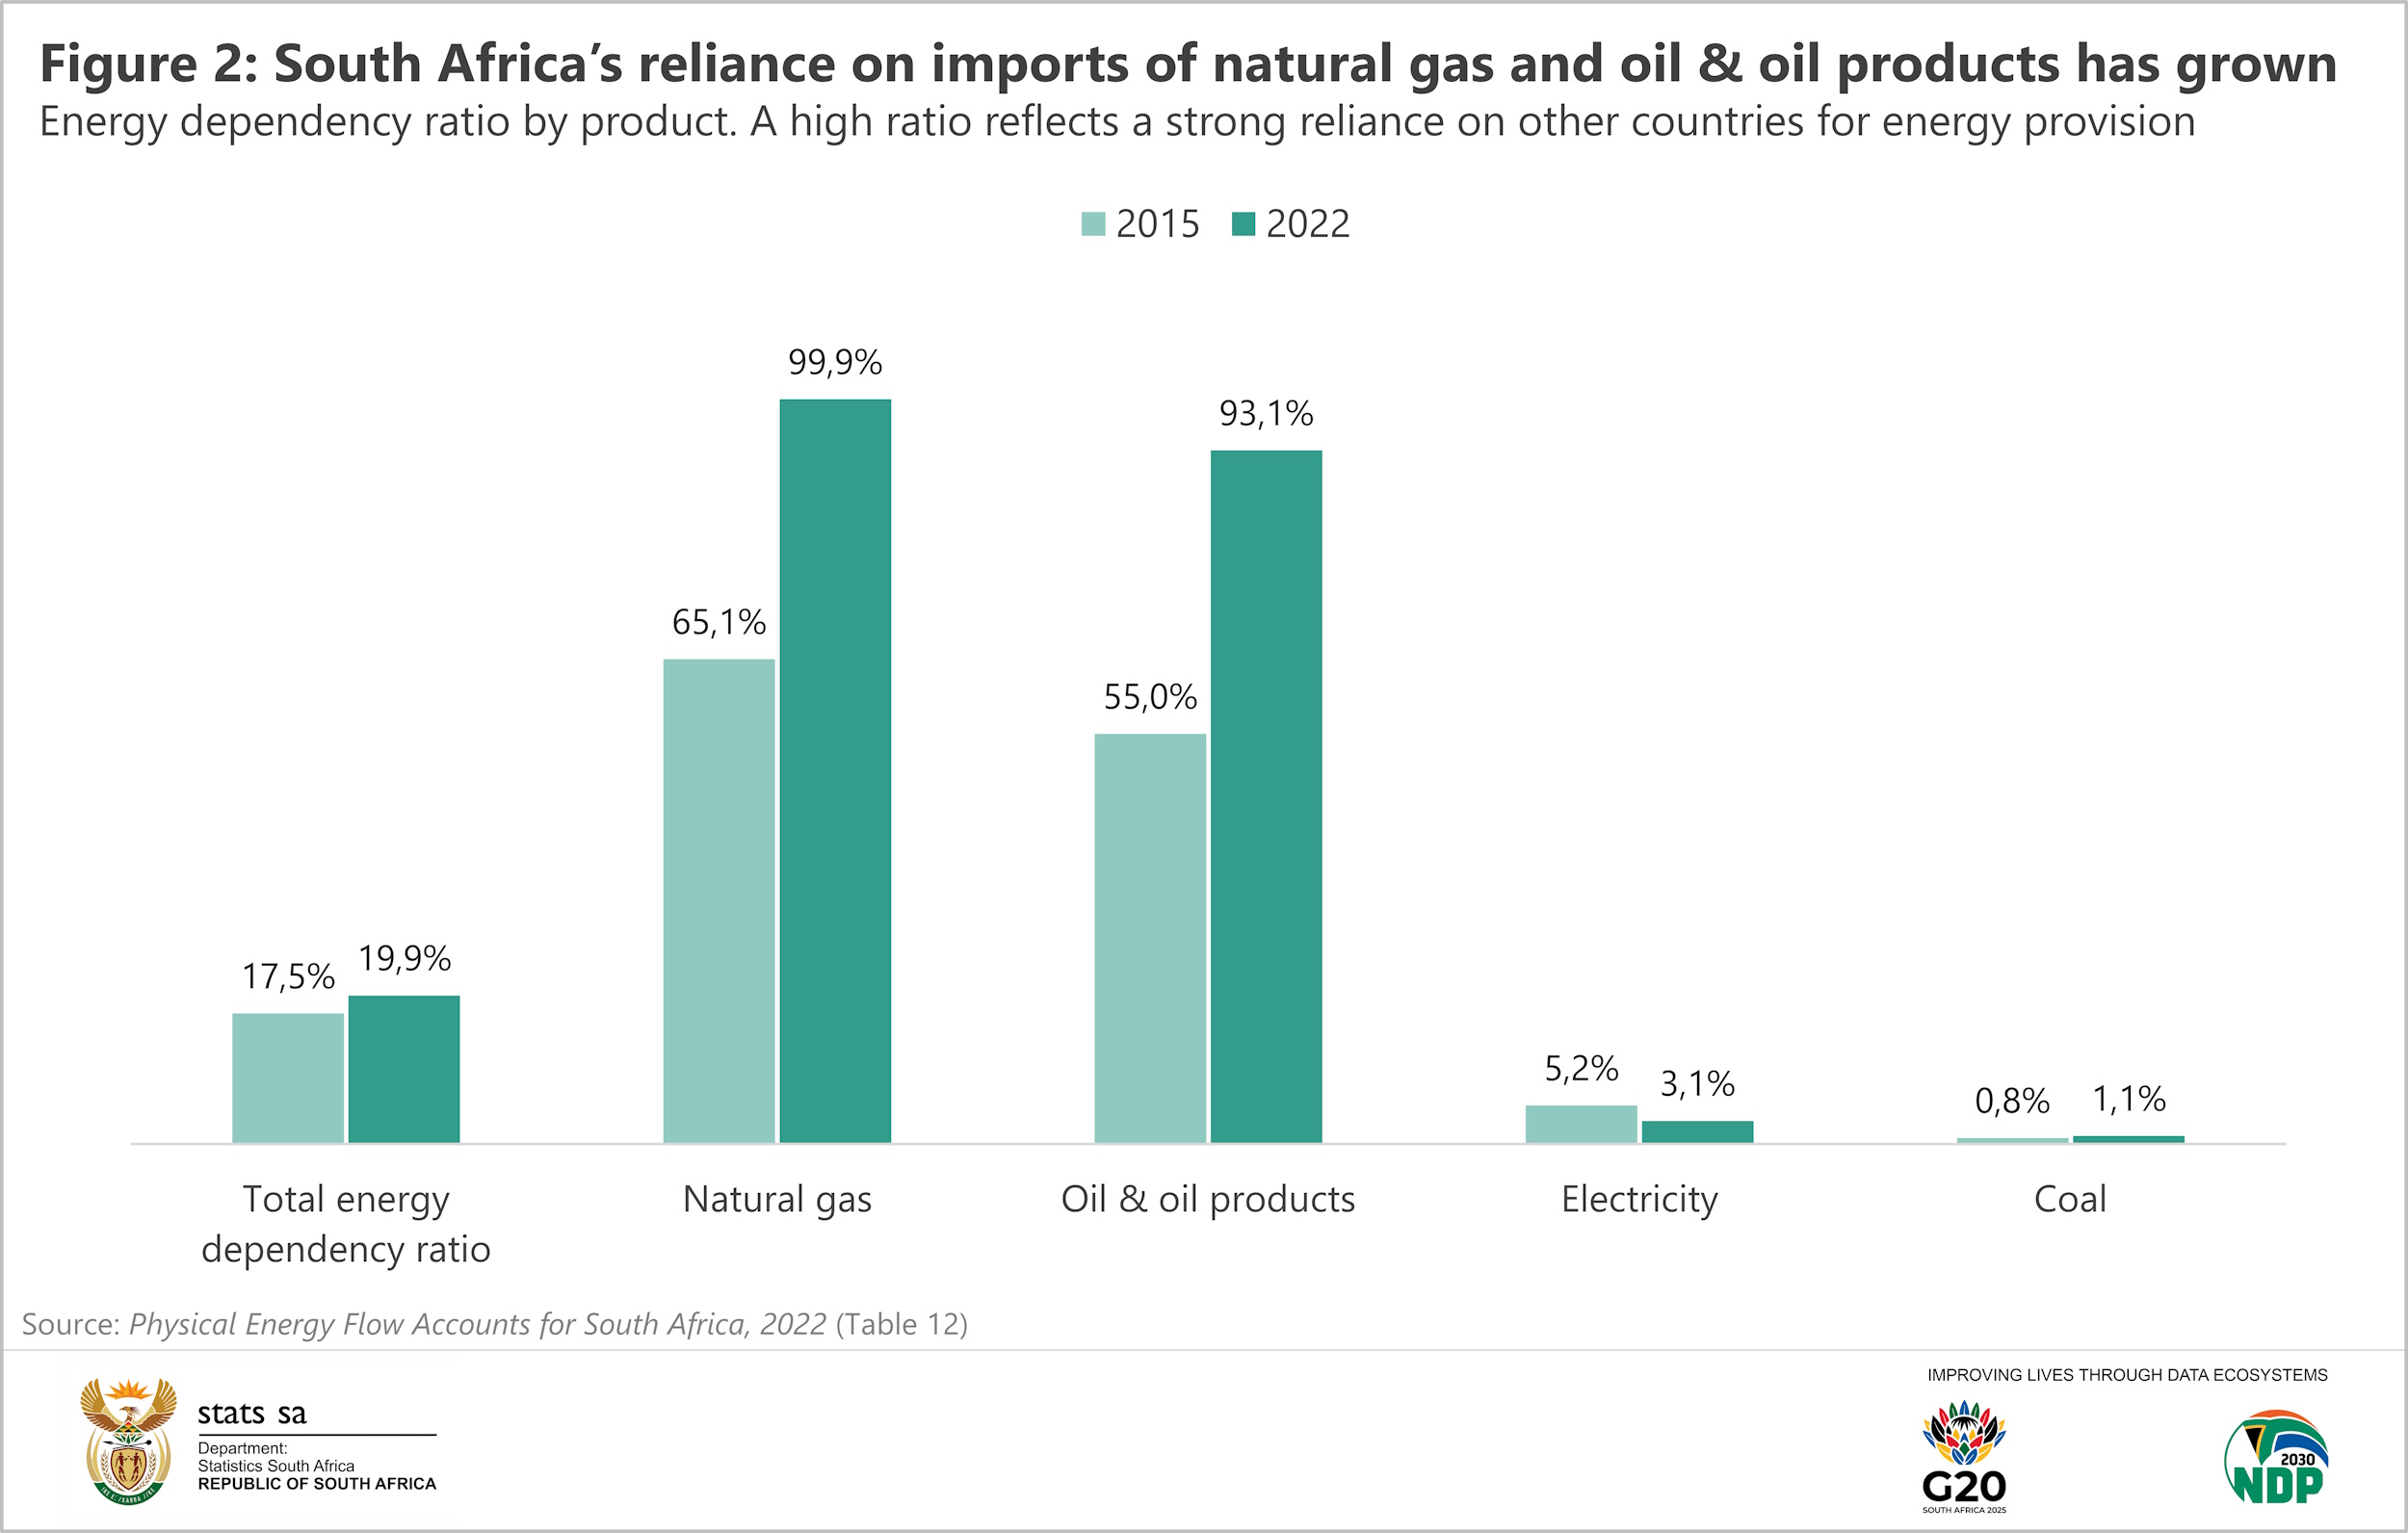
South Africa is far less reliant on the international community for electricity and coal. The country mines most of its coal locally and produces most of its electricity. Hence, the lower energy dependency ratios indicate a degree of ‘energy sovereignty’ for these two energy products.
Energy use per person
The physical energy flow accounts also provide an opportunity to gauge South Africa’s household energy use per capita. This indicator is calculated by dividing total resident household energy use by the resident population. Households consumed an estimated 727,8 million gigajoules (GJ) of energy in 2022. With a national population of 60,9 million, this equates to a household energy use per capita of 12,0 GJ per person.
Household energy use per capita for South Africa was 12,6 GJ per person in 2015, rising to a peak of 13,2 GJ per person during the COVID-19 pandemic in 2020 (Figure 3).
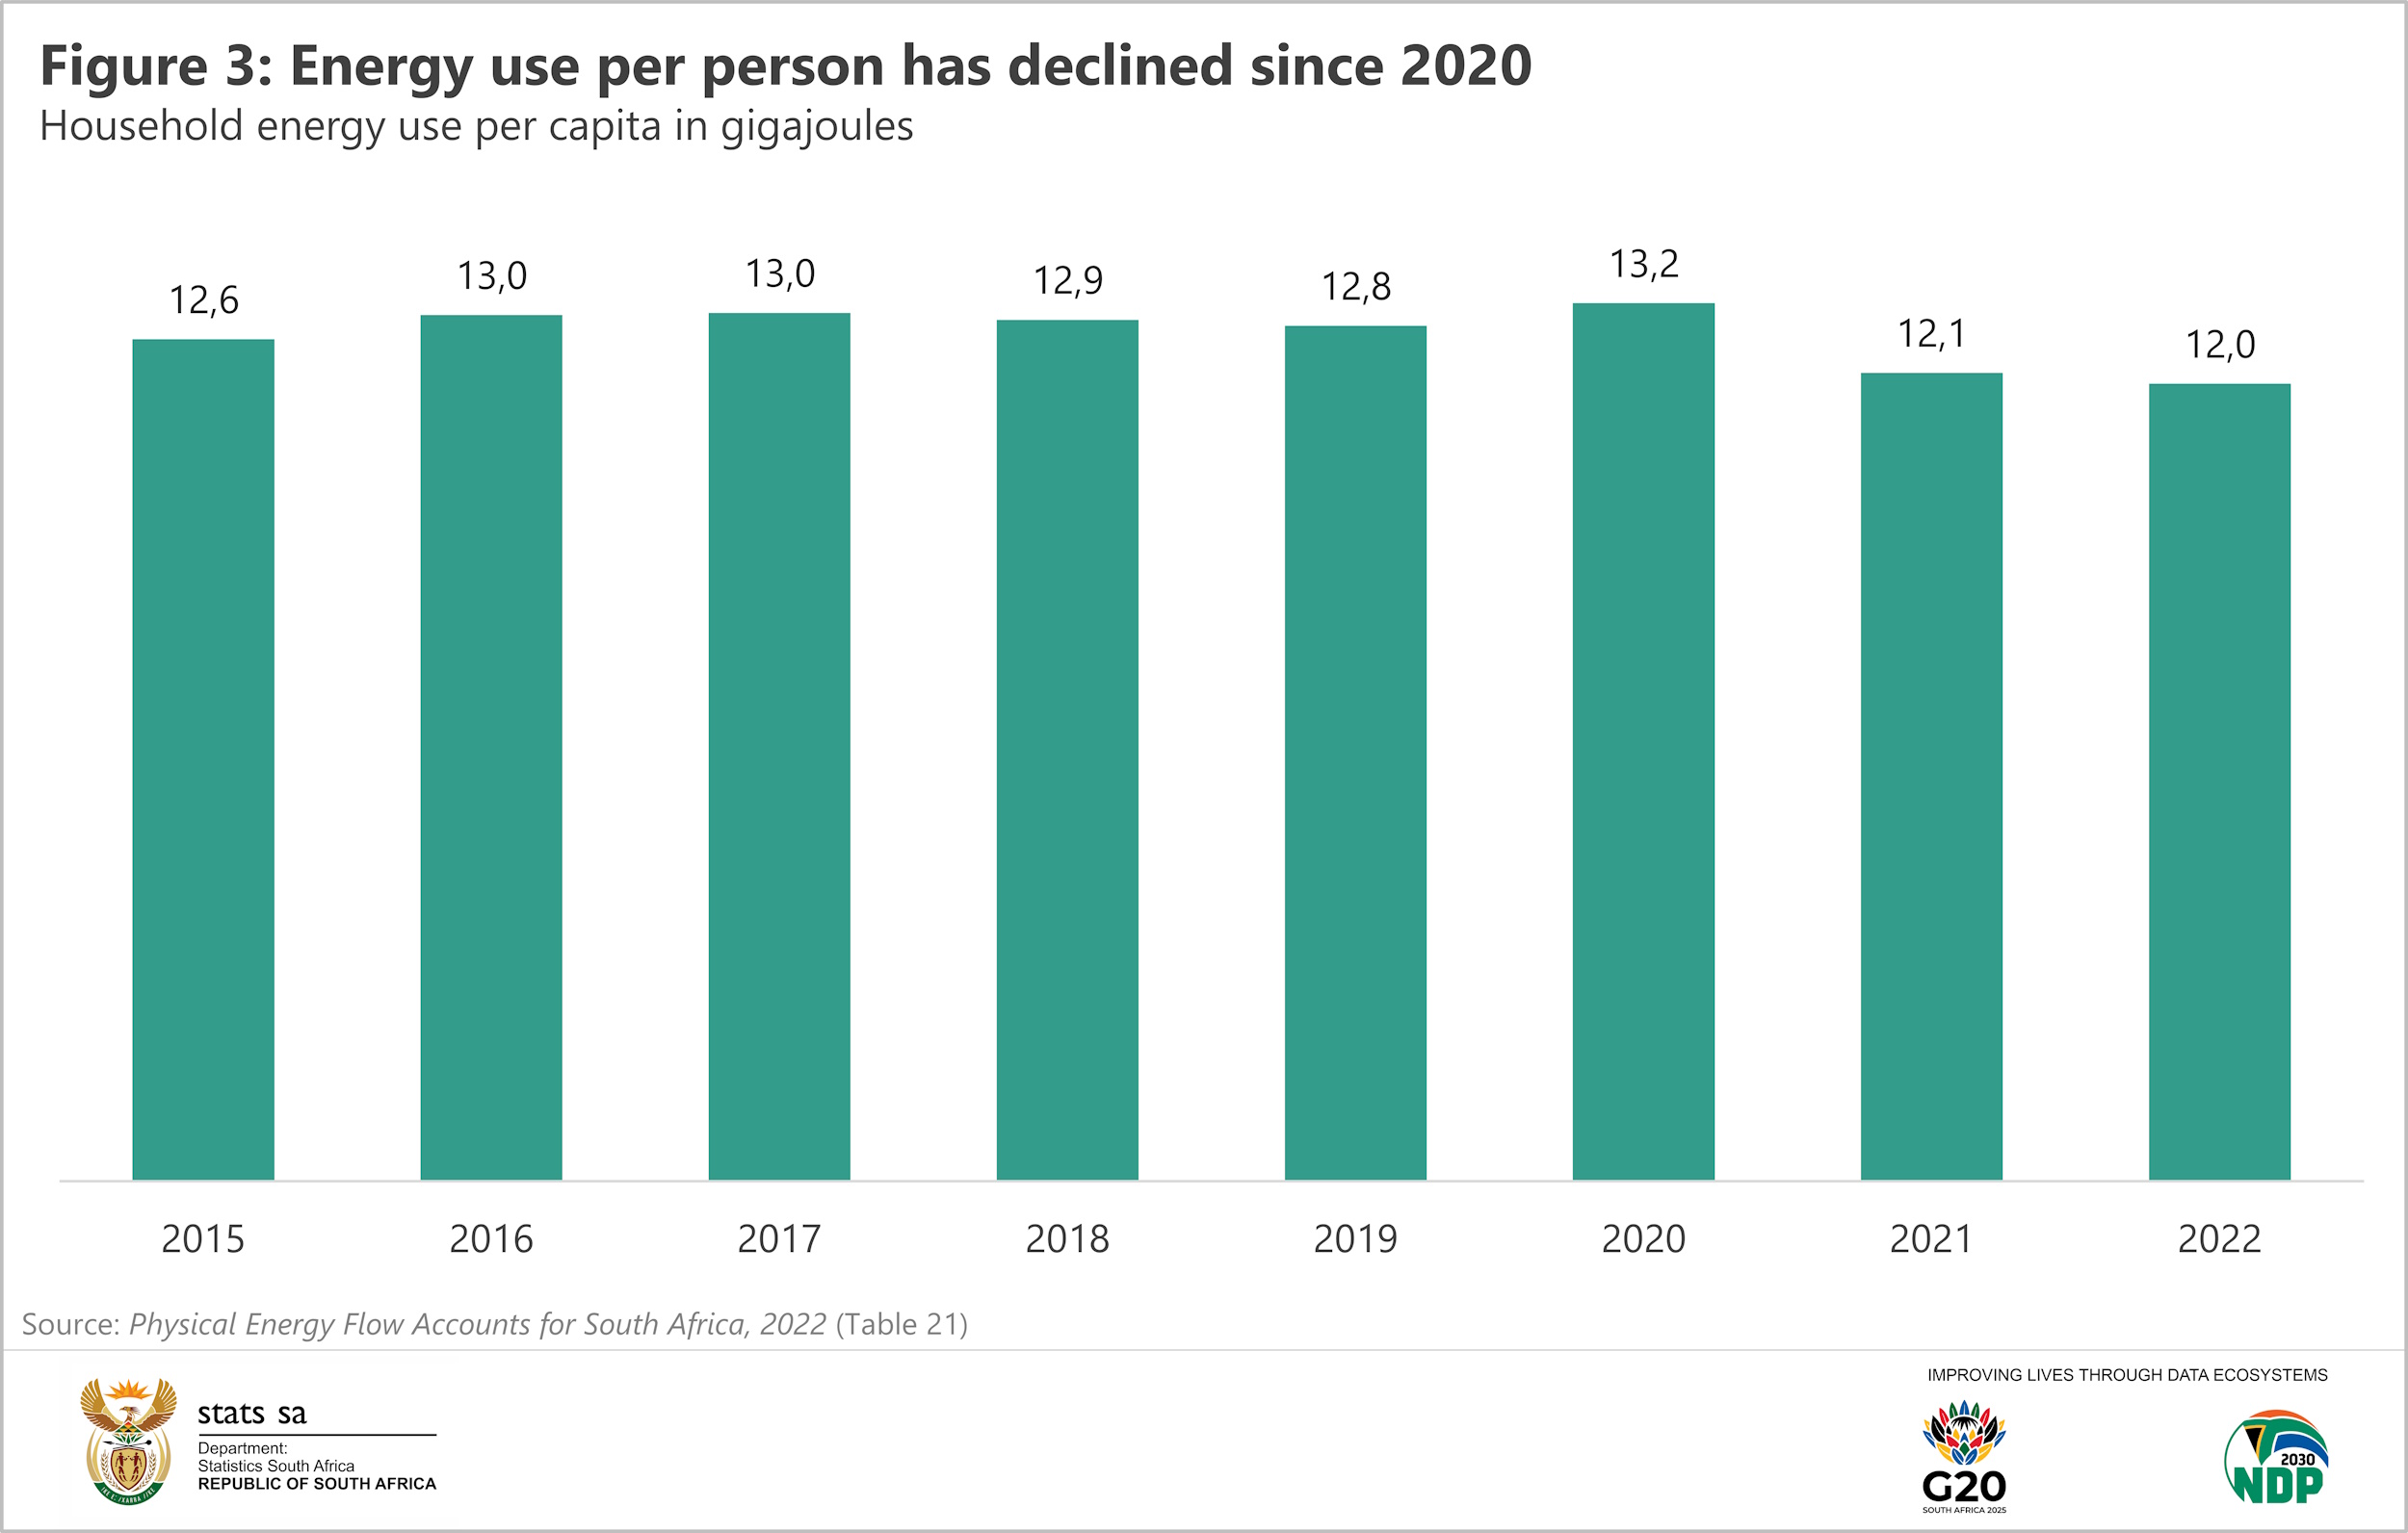
Several factors may trigger a decline in household energy use per capita, such as lower energy demand, reduced appliance use, smaller homes, socio-economic factors, or higher energy efficiency.
For more information, download the discussion document, “Physical Energy Flow Accounts for South Africa, 2022” here.
This is the seventh discussion document published by Stats SA in the Natural Capital series. The other discussion documents available in the series include:
Similar articles are available on the Stats SA website and can be accessed here.
For a monthly overview of economic indicators and infographics, catch the latest edition of the Stats Biz newsletter here.