

October marks Transport month in South Africa, a time to reflect on the progress and challenges in building a transport system that works for all.
This year’s theme, “Implementing an integrated, sustainable, and safe transport system that promotes inclusive economic growth, job retention and creation, and social development,” captures the broader vision of a transport system that moves more than just people. It speaks to how transport shapes everyday life from how children get to school to how workers reach their jobs revealing both the strides made and the inequalities that persist in access and affordability.
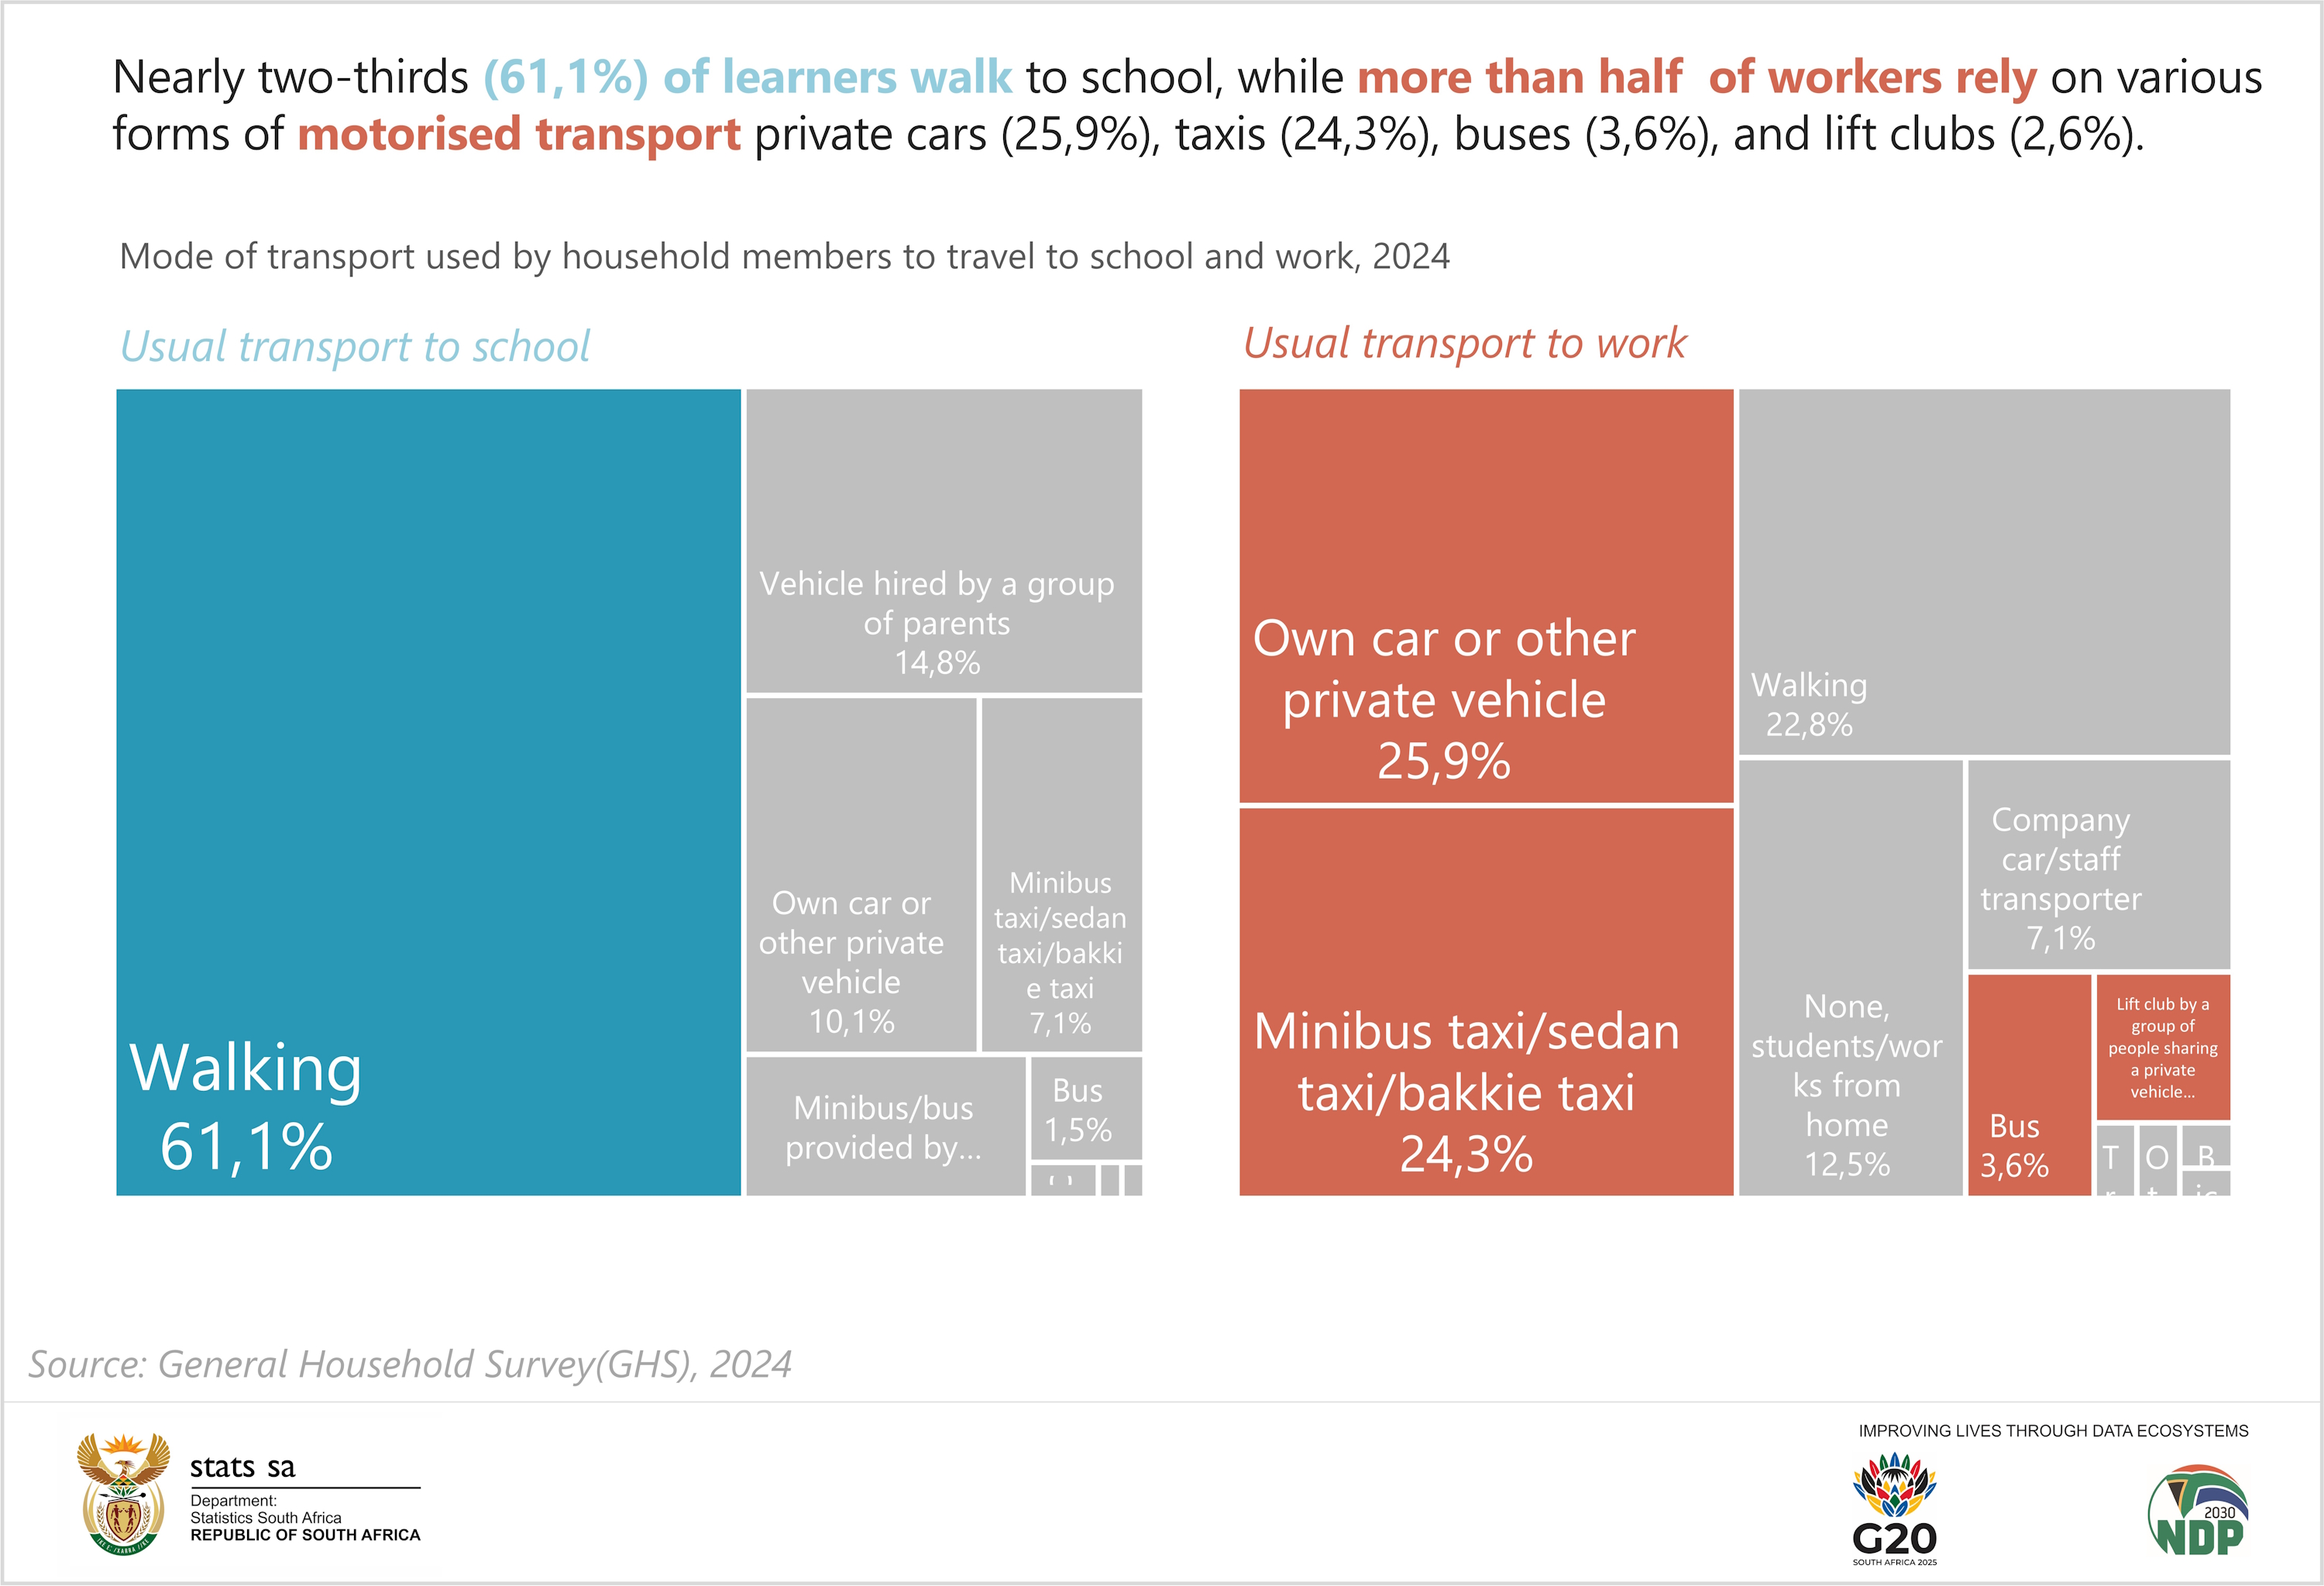
Recent findings from the General Household Survey (GHS) 2024 provide an overview of travel patterns. In South Africa, land transport remains the primary means of travel for most South Africans. The data shows that nearly two-thirds (61,1%) of learners walk to school, while 14,8% rely on transport arranged by parents, 10,1% travel by private car, 7,1% use taxis, and 1,5% take the bus. In contrast, fewer than a quarter (22,8%) of workers walk to work, with more than half depending on various forms of motorised transport private cars (25,9%), taxis (24,3%), buses (3,6%), and lift clubs (2,6%).
While the GHS highlights how South Africans move, the 2020 National Household Travel Survey (NHTS) provides further insight into the costs of these journeys. Of the 6,3 million households with at least one person using public transport weekly to get to work, nearly three-quarters (74,5%) spent R300 or more on transport. For those travelling to educational institutions, a significant portion (26,9%) spent between R500 and R1 000, while others managed with slightly less between R301 and R500 (24,5%) and R201 and R300 (15,0%).
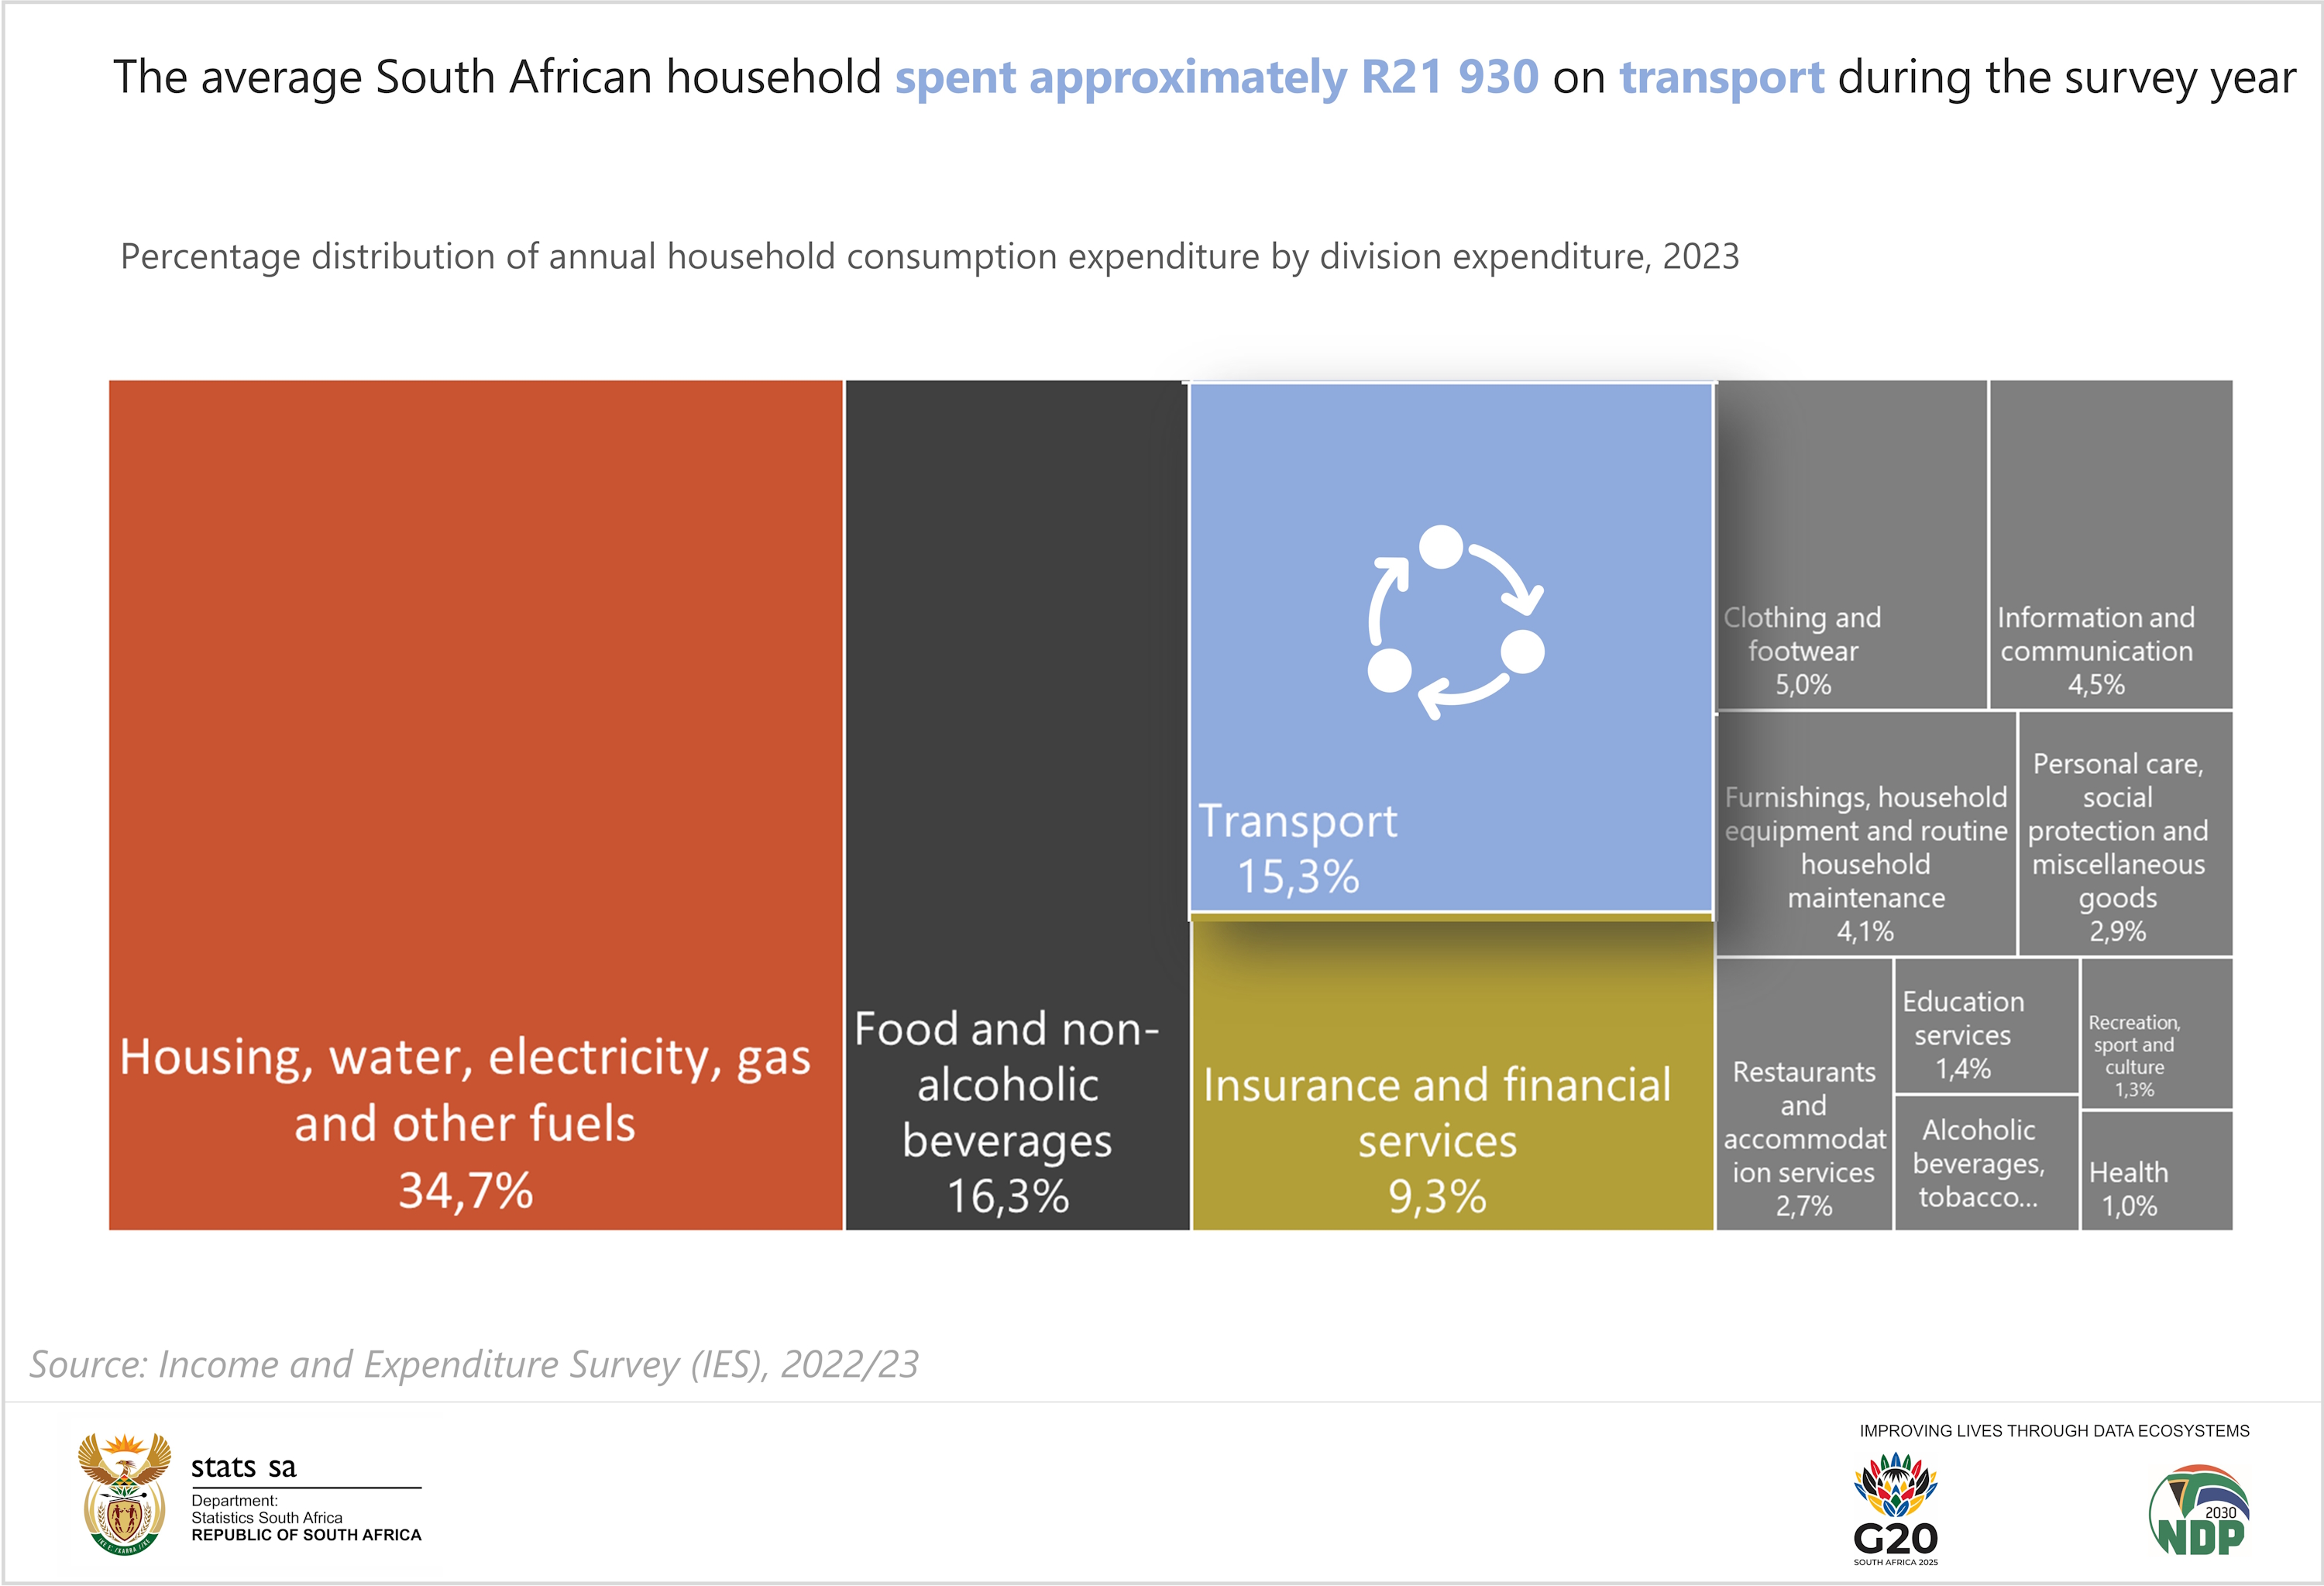
Transport’s financial impact on households is reflected in the Income and Expenditure Survey (IES) 2022/23, which ranked it as the third-largest contributor to household consumption expenditure, accounting for 15,3% or an estimated R467 billion. According to the IES 2022/23, the average South African household spent approximately R21 930 on transport during the survey year. At a provincial level, households in the Western Cape recorded the highest annual average at R33 487, followed by those in Gauteng (R29 333) and Mpumalanga (R21 964).
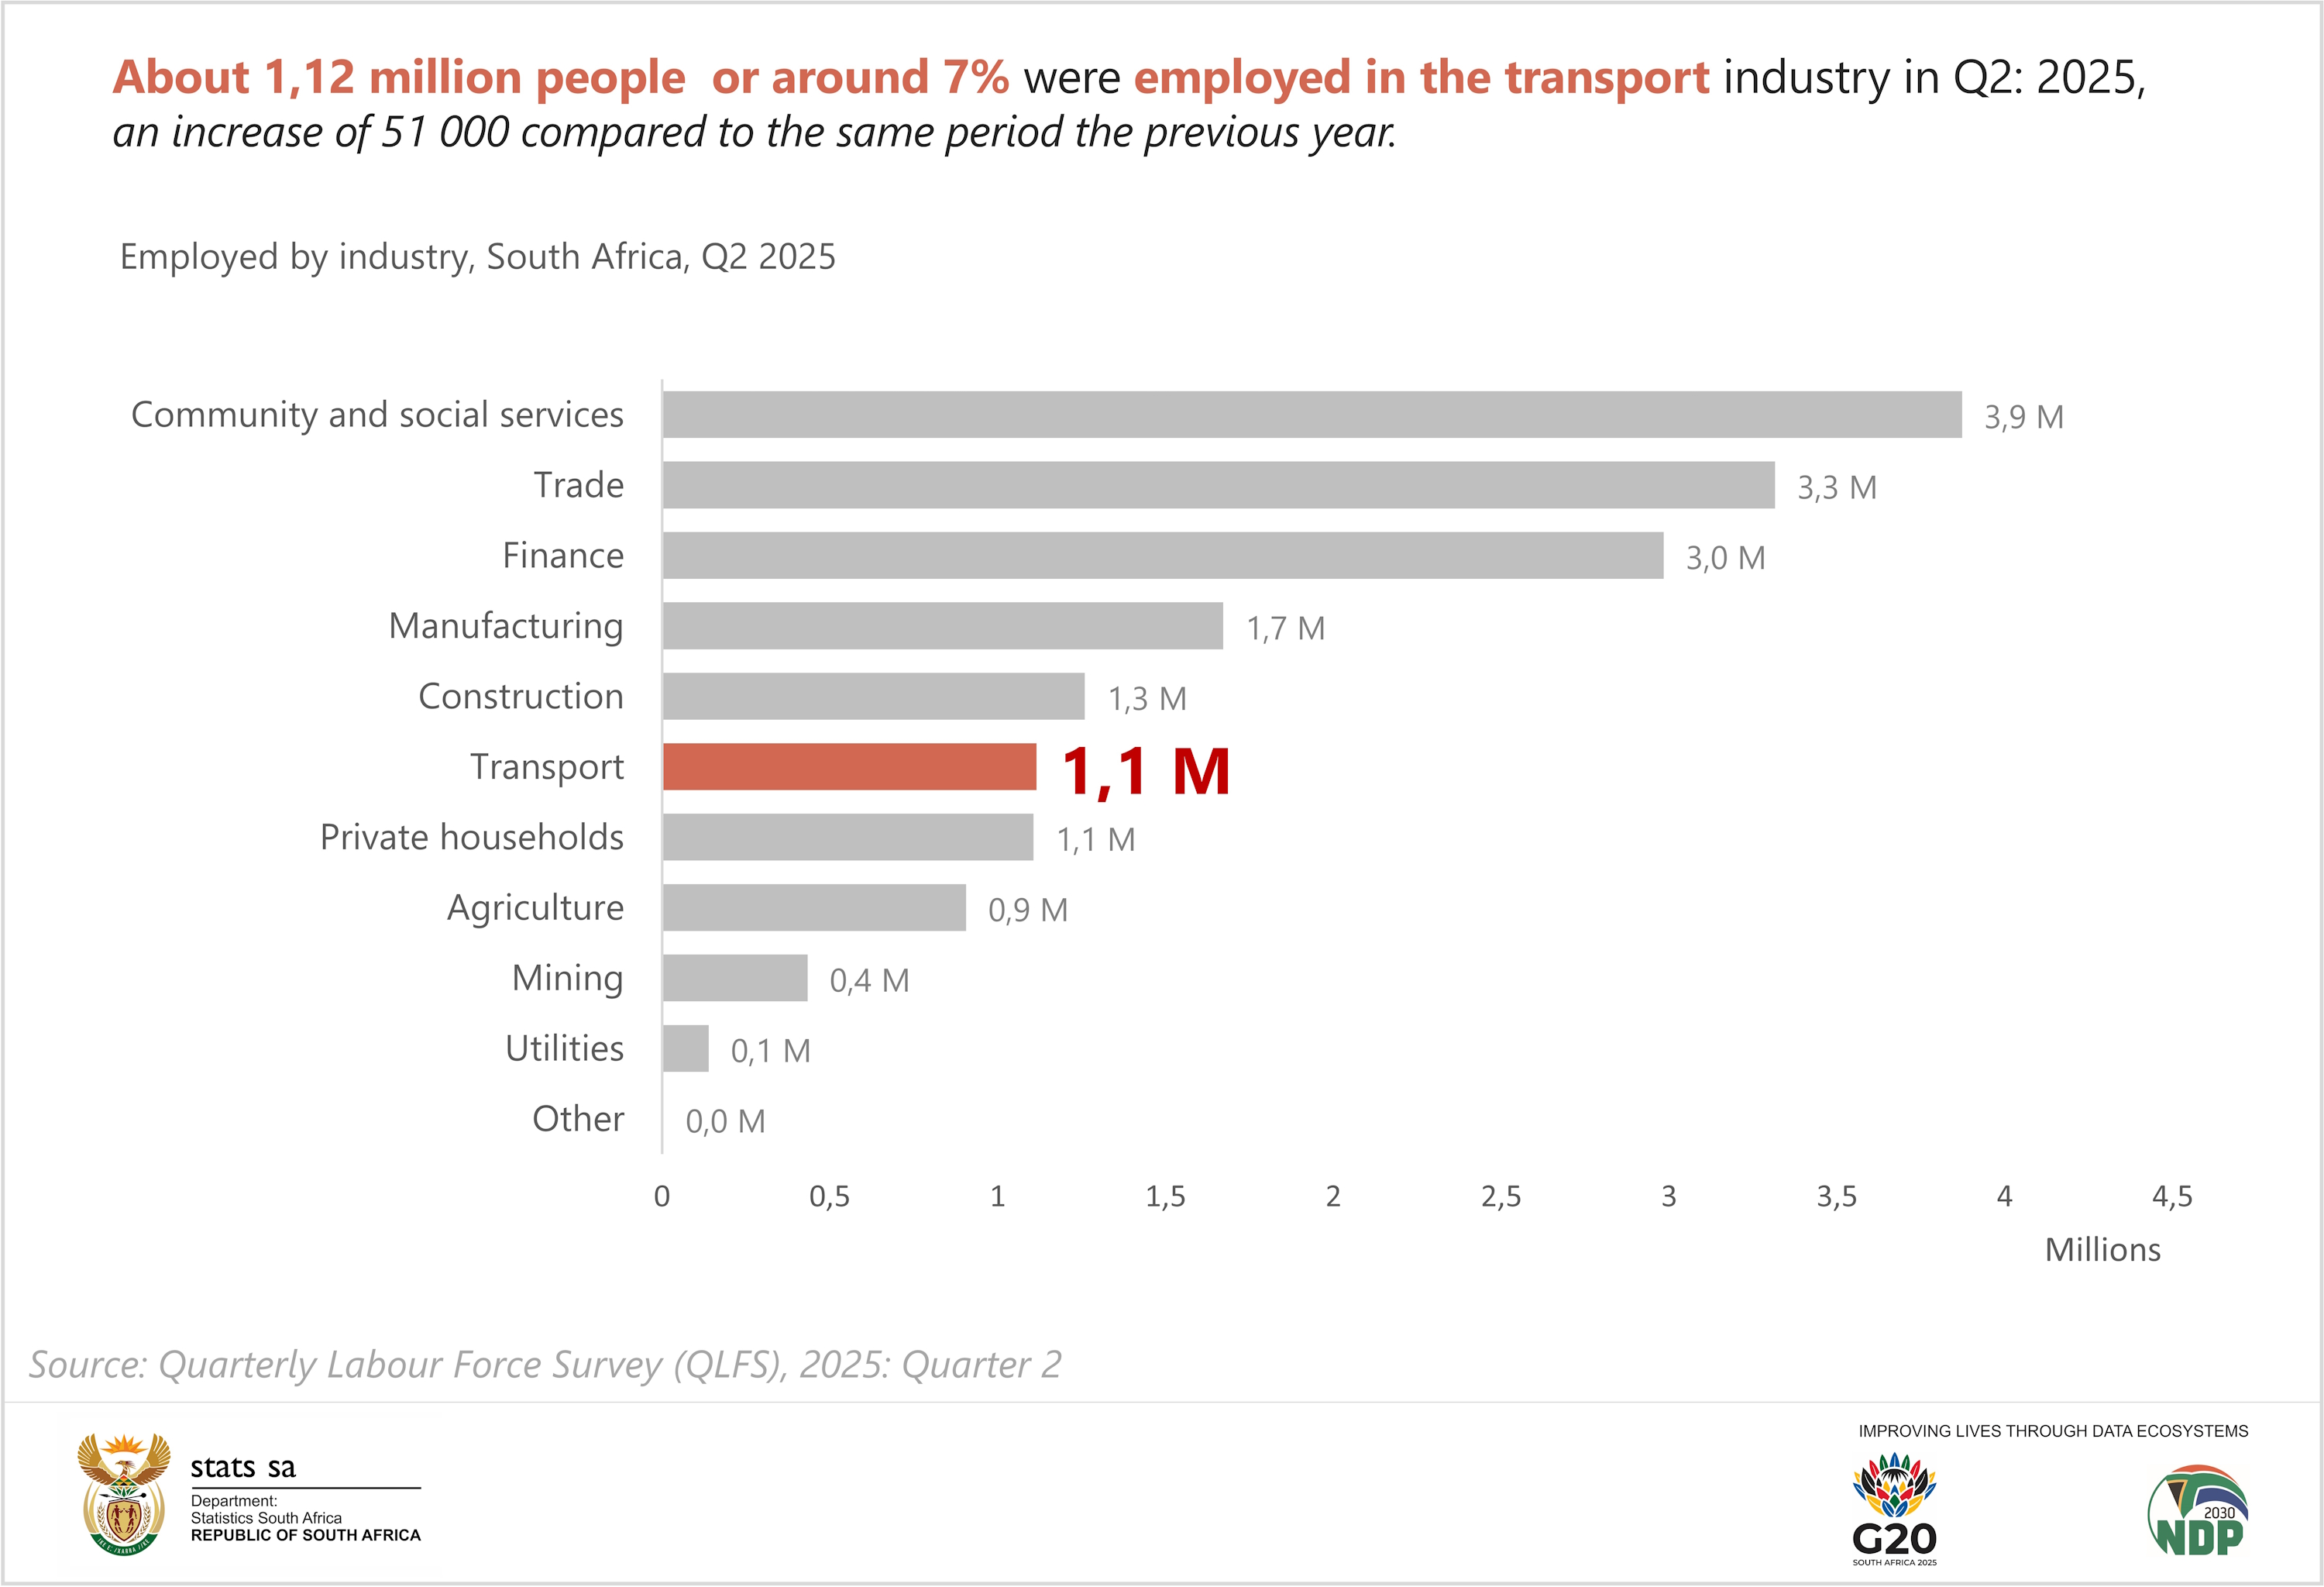
The Quarterly Labour Force Survey (QLFS) tracks employment and labour market trends among South Africans aged 15–64. According to the latest results for Quarter 2 of 2025 (April–June), about 1,12 million people were employed in the transport sector an increase of 51 000 compared to the same period last year. Of these, 732 000 worked in the formal sector and 384 000 in the informal sector.
Despite this growth in employment, the sector’s overall economic performance slowed. The Gross Domestic Product (GDP) report for the second quarter of 2025 showed that the transport, storage and communication industry contracted by 0,8%, subtracting 0,1 of a percentage point from overall GDP growth. The decline was mainly due to reduced activity in land transport and transport support services.
While transport plays a vital role in connecting people and driving economic activity, it also presents serious risks. Road crashes and injuries remain a daily reality in South Africa and across the world. Recognising this, road safety was included in the global developmental agenda in 2015, when the Sustainable Development Goals (SDGs) were adopted. Two of the 17 goals specifically address road safety: Goal 3, which aims to halve the number of global deaths and injuries from road traffic accidents by 2020, and Goal 11, which seeks to provide access to safe, affordable, and sustainable transport systems for all by 2030.
According to the Road Traffic Management Corporation (RTMC) State of Road Safety 2023 report, globally, occupants of four-wheel vehicles account for 30% of road fatalities, with no distinction between drivers and passengers. Pedestrians make up 23%, followed by users of powered two- and three-wheelers at 21%, and cyclists at 6%. The remaining 20% of fatalities involve occupants of large passenger vehicles, heavy goods vehicles, and other or unidentified users.
In South Africa, the Mortality and Causes of Death 2022 report recorded 64 575 non-natural deaths, up slightly from 60 999 in 2021. The 20–24 age group was the most affected by non-natural causes, with high proportions also seen among those aged 25–29 (46,4%), 15–19 (46,0%), 5–9 (36,3%), 30–34 (35,7%), and 10–14 (34,6%). Transport accidents were the third most common cause of non-natural deaths, accounting for 7,1% of such deaths and 0,9% of all deaths recorded in 2022.
Transport Month serves as a reminder that mobility in South Africa is shaped by inequality. For many, walking long distances or relying on taxis may not be a not a choice but perhaps a reflection of limited transport options or affordability constraints. While cars remain out of reach for most households, access to safe and reliable transport continues to mirror the country’s broader social and economic divides. As South Africa reflects on progress this Transport Month, the challenge remains to make movement equitable ensuring everyone can travel with dignity and opportunity.
For more information on transport in South Africa, please refer to the sources below:
Sources:
General Household Survey (GHS), 2024
Gross Domestic Product (GDP), 2025: Quarter 2
Income & Expenditure Survey (IES), 2022/23
National Household Travel Survey (NHTS), 2020
National Development Plan (NDP), 2030
National Land Transport Strategic Framework (NLTSF), 2023-2028
Mortality and Causes of Death, 2022
Quarterly Labour Force Survey (QLFS), 2025: Quarter 2
Road Traffic Management Corporation (RMTC): State of state of Road Safety, 2023
Sustainable Development Goals (SDGs), 2030