

In September 2025, Statistics South Africa (Stats SA) published results for a number of monthly surveys that were based on newly drawn samples. These surveys include:
New samples for these surveys are typically drawn every year to ensure that the data remain aligned with the Statistical Business Register (SBR), which is updated using information from the South African Revenue Service (SARS).
Why new samples are needed
The SBR changes continuously as businesses merge, close or shift their main activities. To reflect these changes, Stats SA runs quality improvement surveys and refreshes the survey samples. Updating the samples ensures that economic activity is measured as accurately as possible.
Comparing old and new samples
When a new sample is introduced for each of the surveys mentioned above, Stats SA usually runs it in parallel with the old sample for three months, namely April, May and June.
Table 1 summarises the percentage differences between old and new samples from 2018 to 2025, for example:
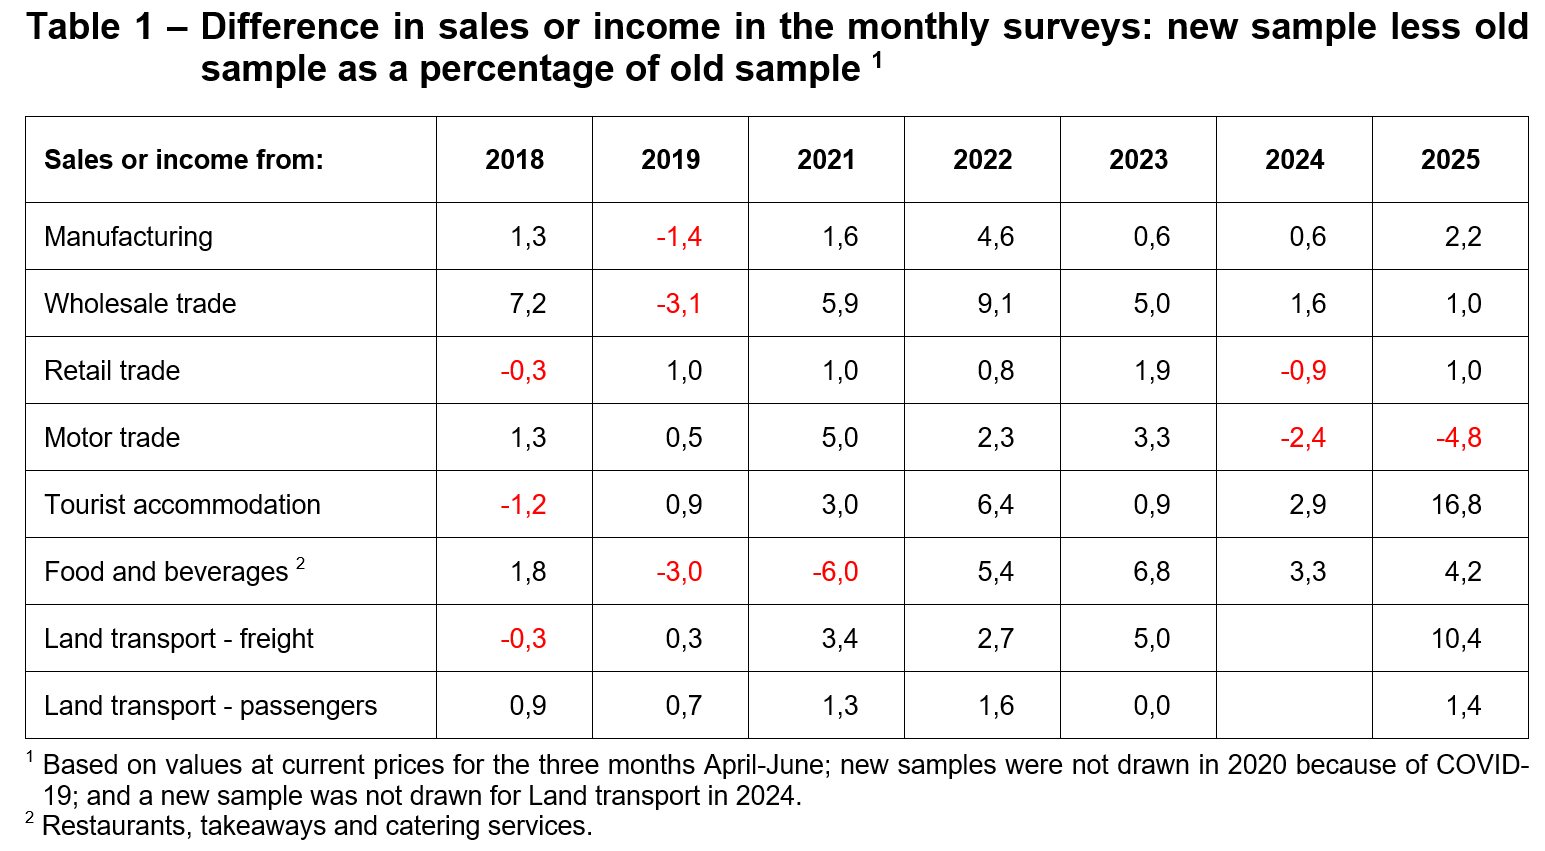
These differences highlight that new samples can shift the levels of sales or income. Without adjustments, this would distort growth rates.
Linking the old series to the new
Users are usually more interested in growth rates (month-on-month or year-on-year) than the actual values of sales or income. To avoid distortions, Stats SA uses a linking method that adjusts the old series to match the level of the new one, while keeping growth rates intact.
Stats SA revises the historical data by linking the old series to the new series using a simple formula:
![]()
This ensures that the time series remains continuous and that growth rates are comparable over time.
Wholesale trade: an example
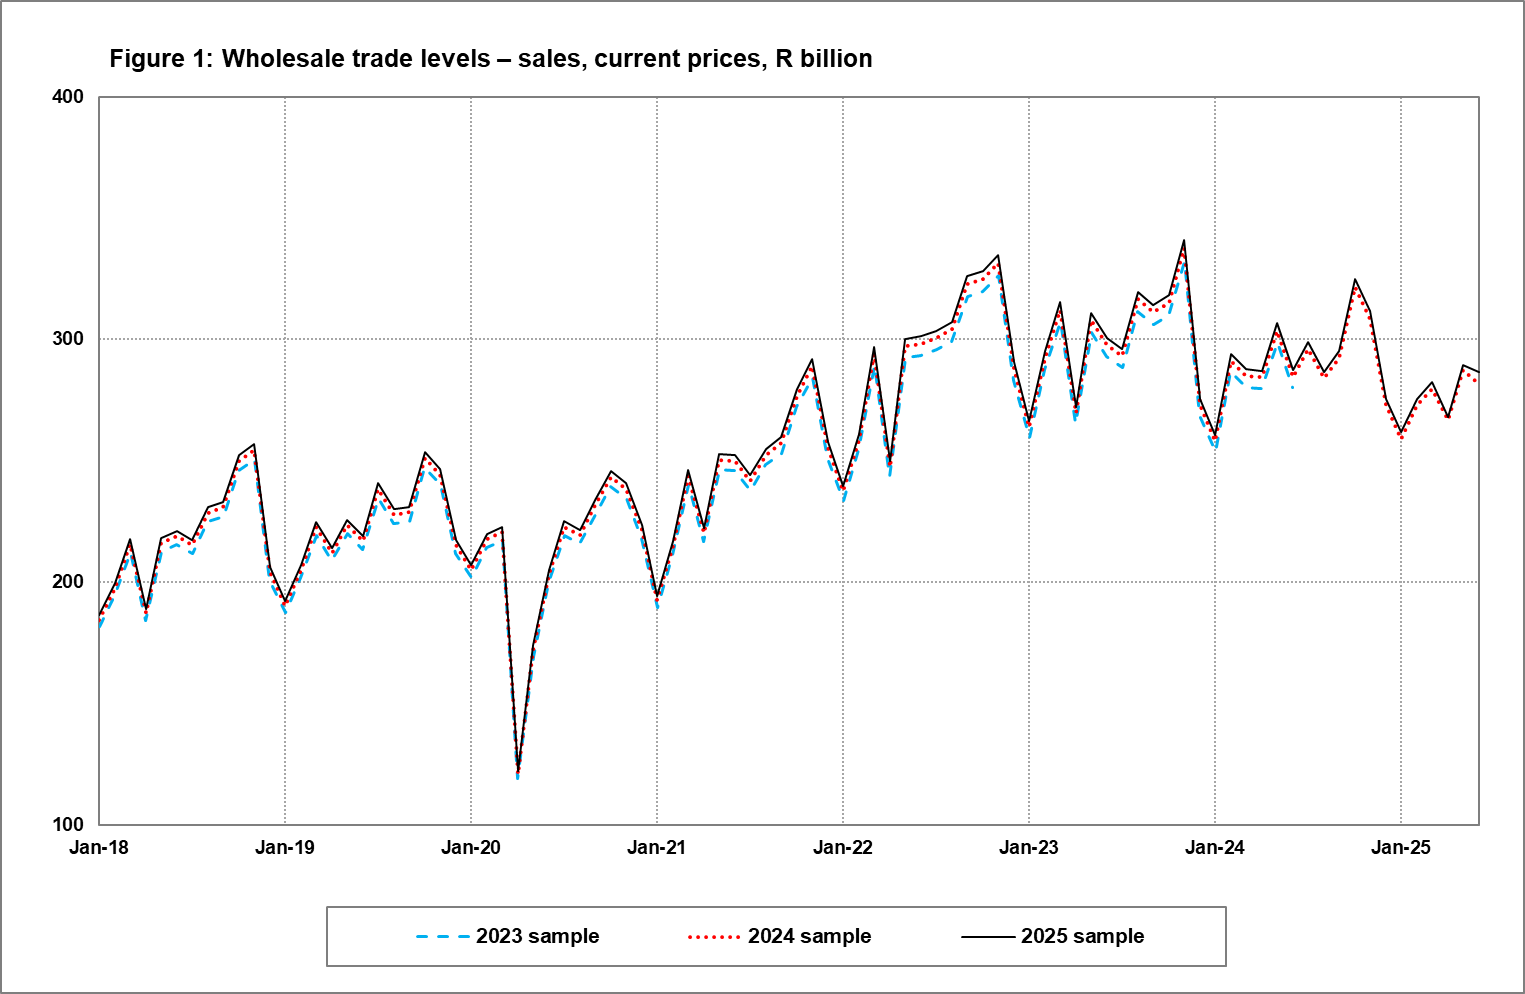
Figure 1 shows wholesale trade sales levels for the 2023, 2024 and 2025 samples. Each new sample is slightly higher than the previous one (the 2024 sample sits 1,6% above 2023, and 2025 is 1,0% above 2024). Importantly, the overall patterns remain the same across samples.
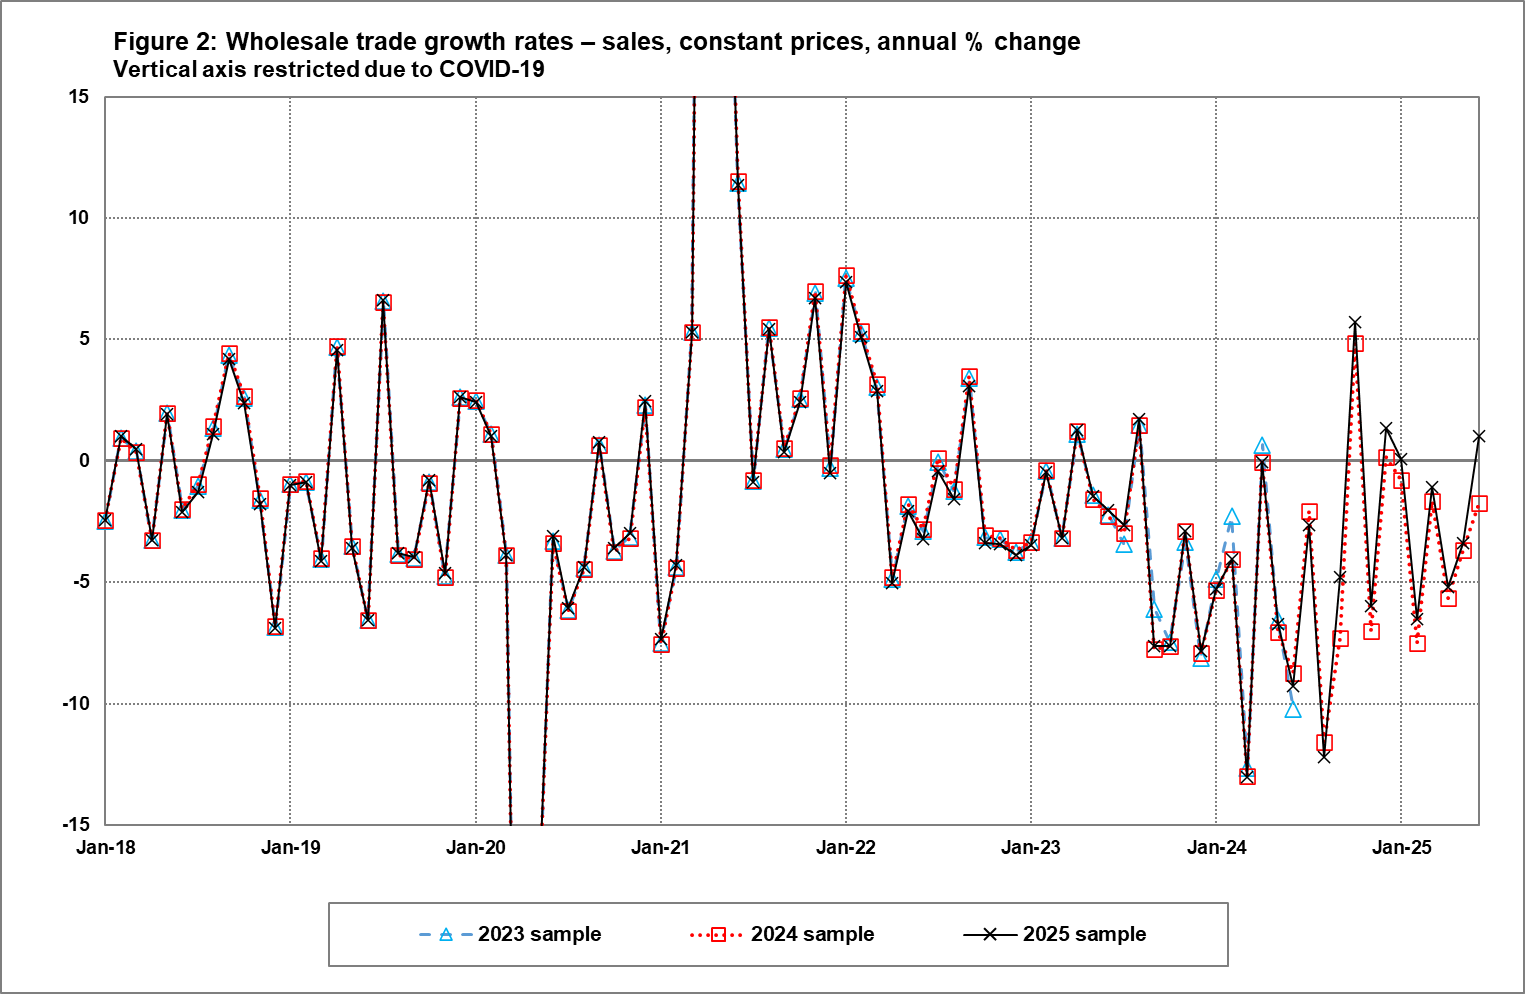
The corresponding wholesale trade growth rates are illustrated in Figure 2. Here, we see that the linking process keeps the growth trends consistent, even after the sample change. Minor differences are visible, but the overall story – steady growth with fluctuations tied to broader economic conditions – remains unchanged.
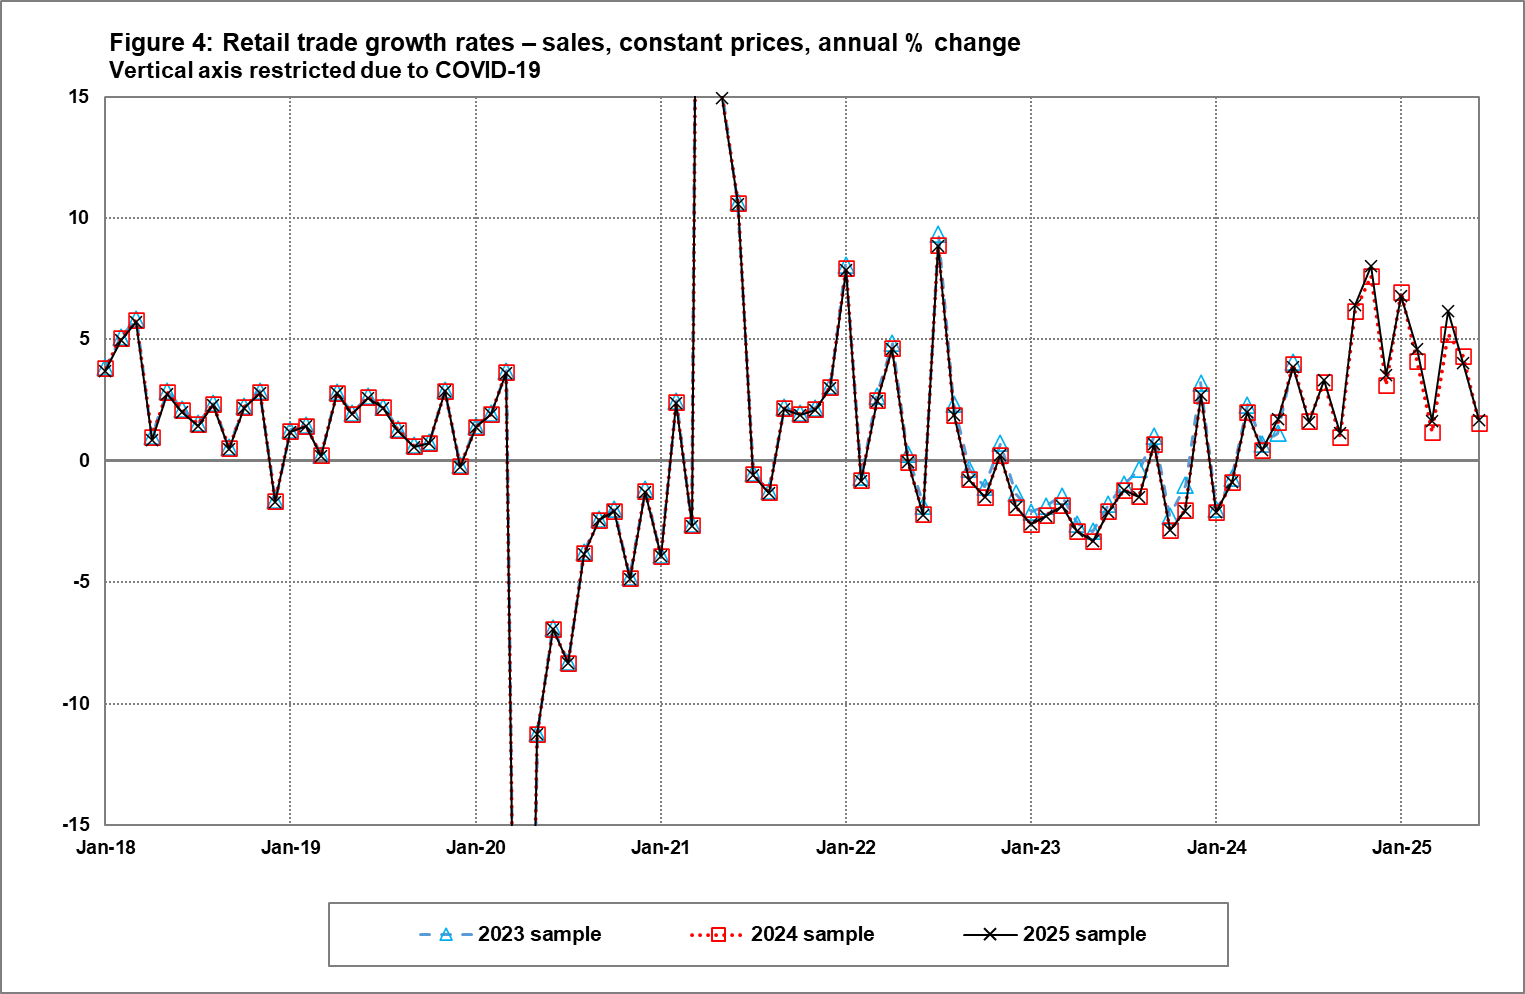
Retail trade: seasonal patterns
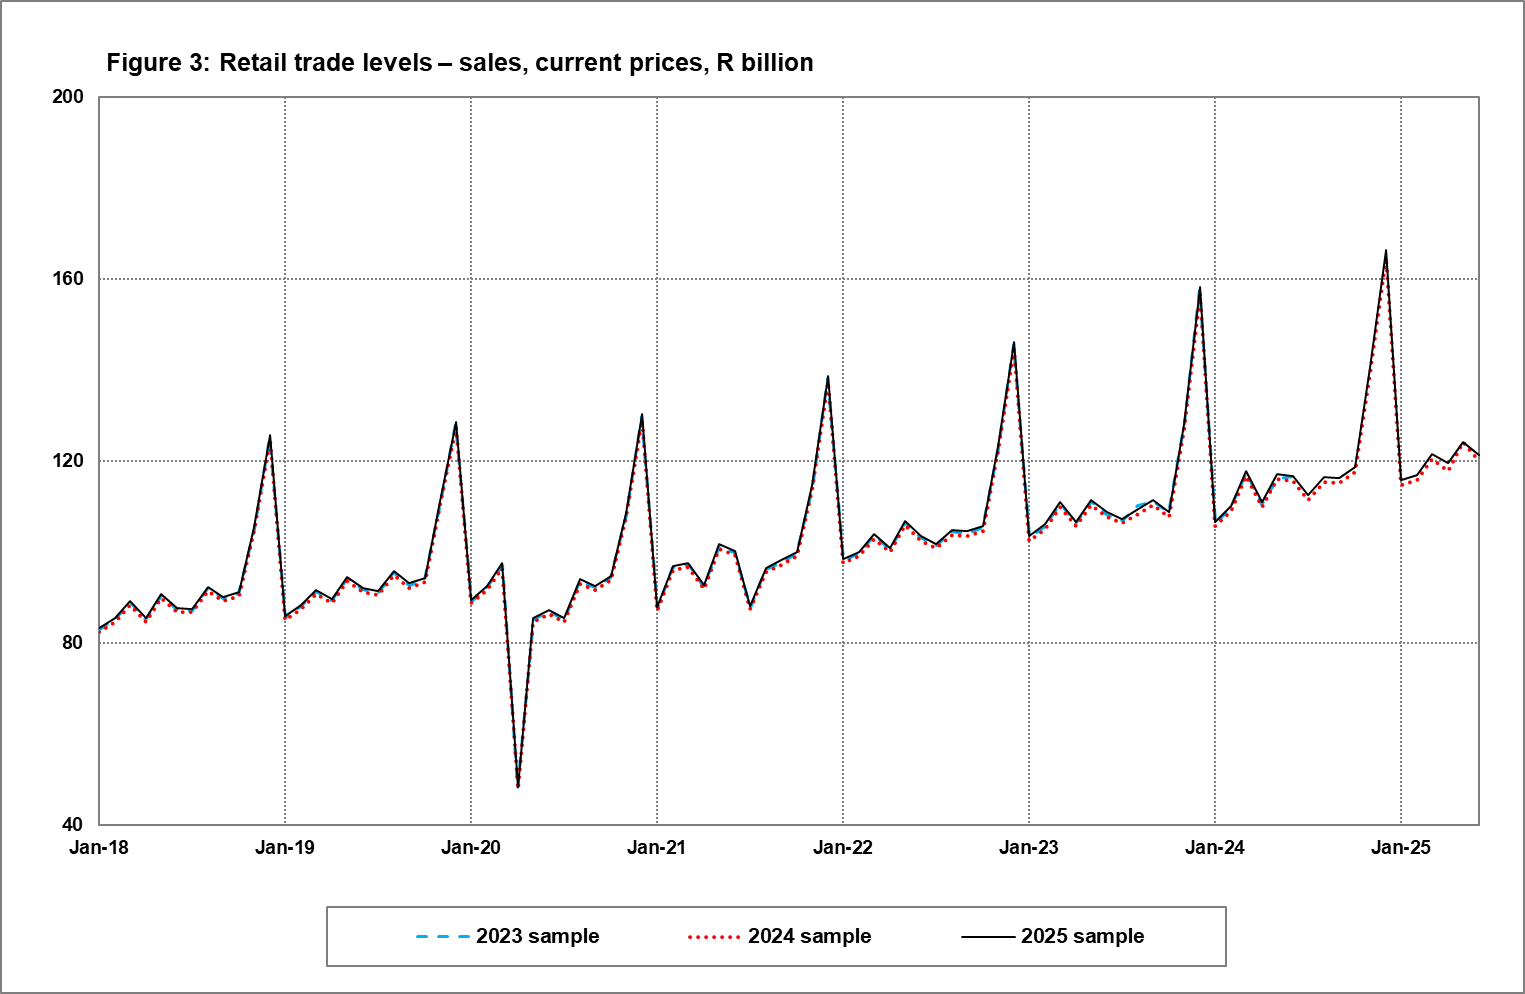
Retail trade levels (Figure 3) show strong seasonal spikes in November (due to Black Friday sales) and December (reflecting festive shopping), and a sharp dip in April 2020 during the COVID-19 lockdown. These patterns appear across all samples.
When we look at the growth rates (Figure 4), the linking process once again ensures that the trend lines remain smooth and comparable. The sample changes barely alter the interpretation of retail growth.
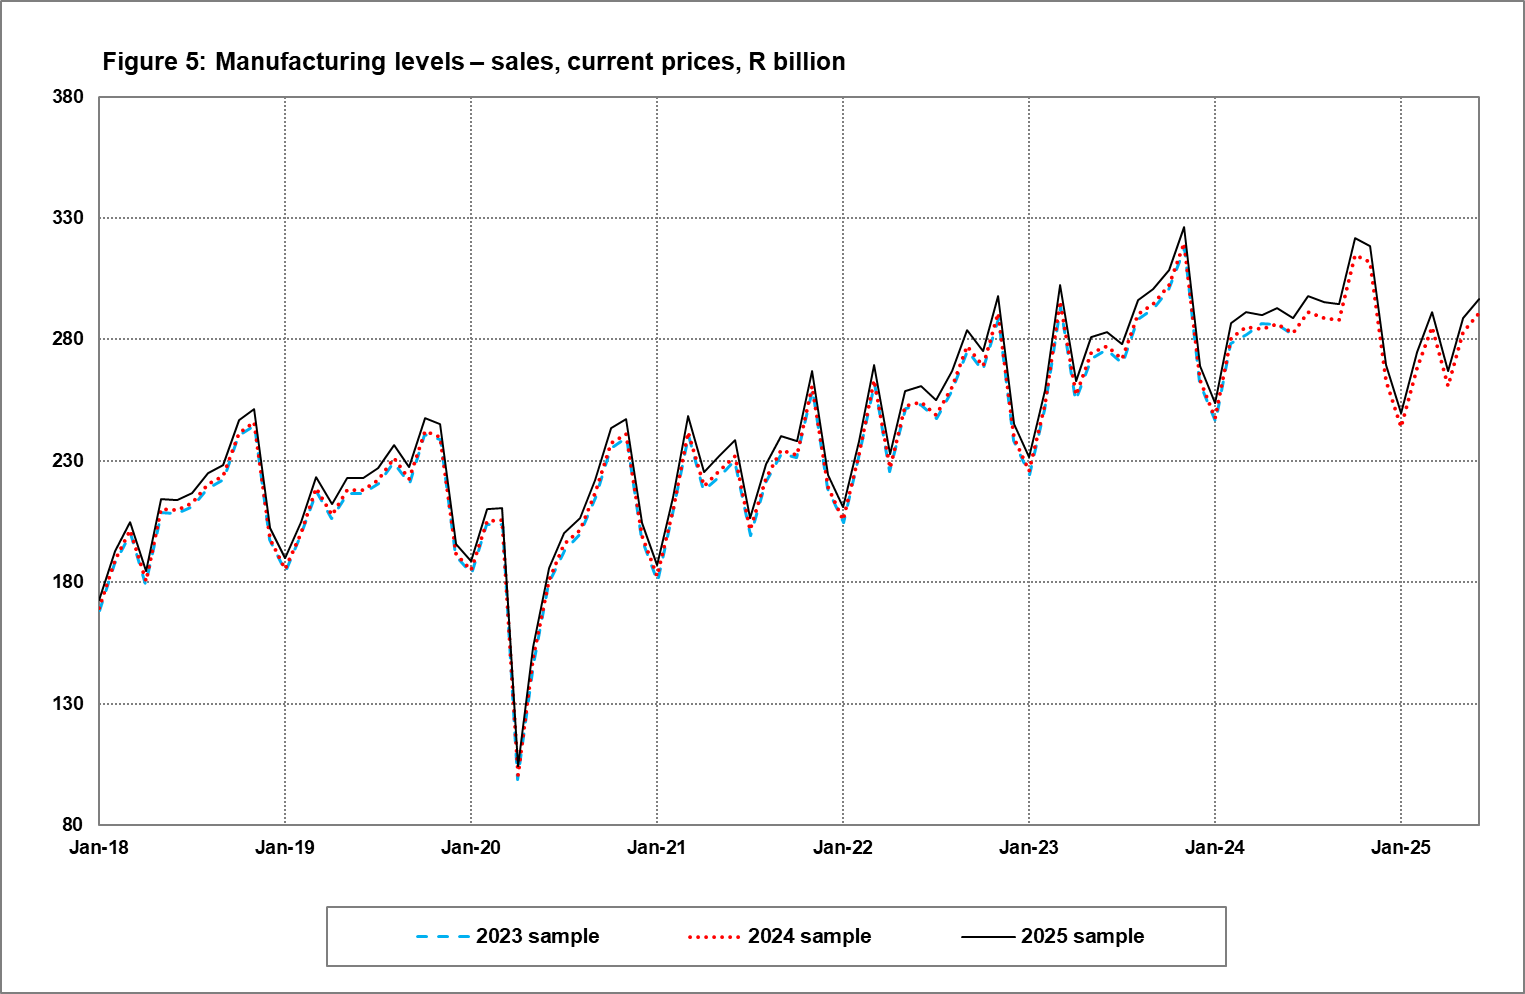
Manufacturing: sales vs production
For manufacturing, sales levels are presented in Figure 5. The 2025 sample lies above the 2024 sample, which in turn lies above 2023. Seasonal spikes ahead of the festive season (October/November) as well as seasonal dips during the festive season (December/January) are clearly visible, as well as the impact of the COVID-19 pandemic in April 2020.
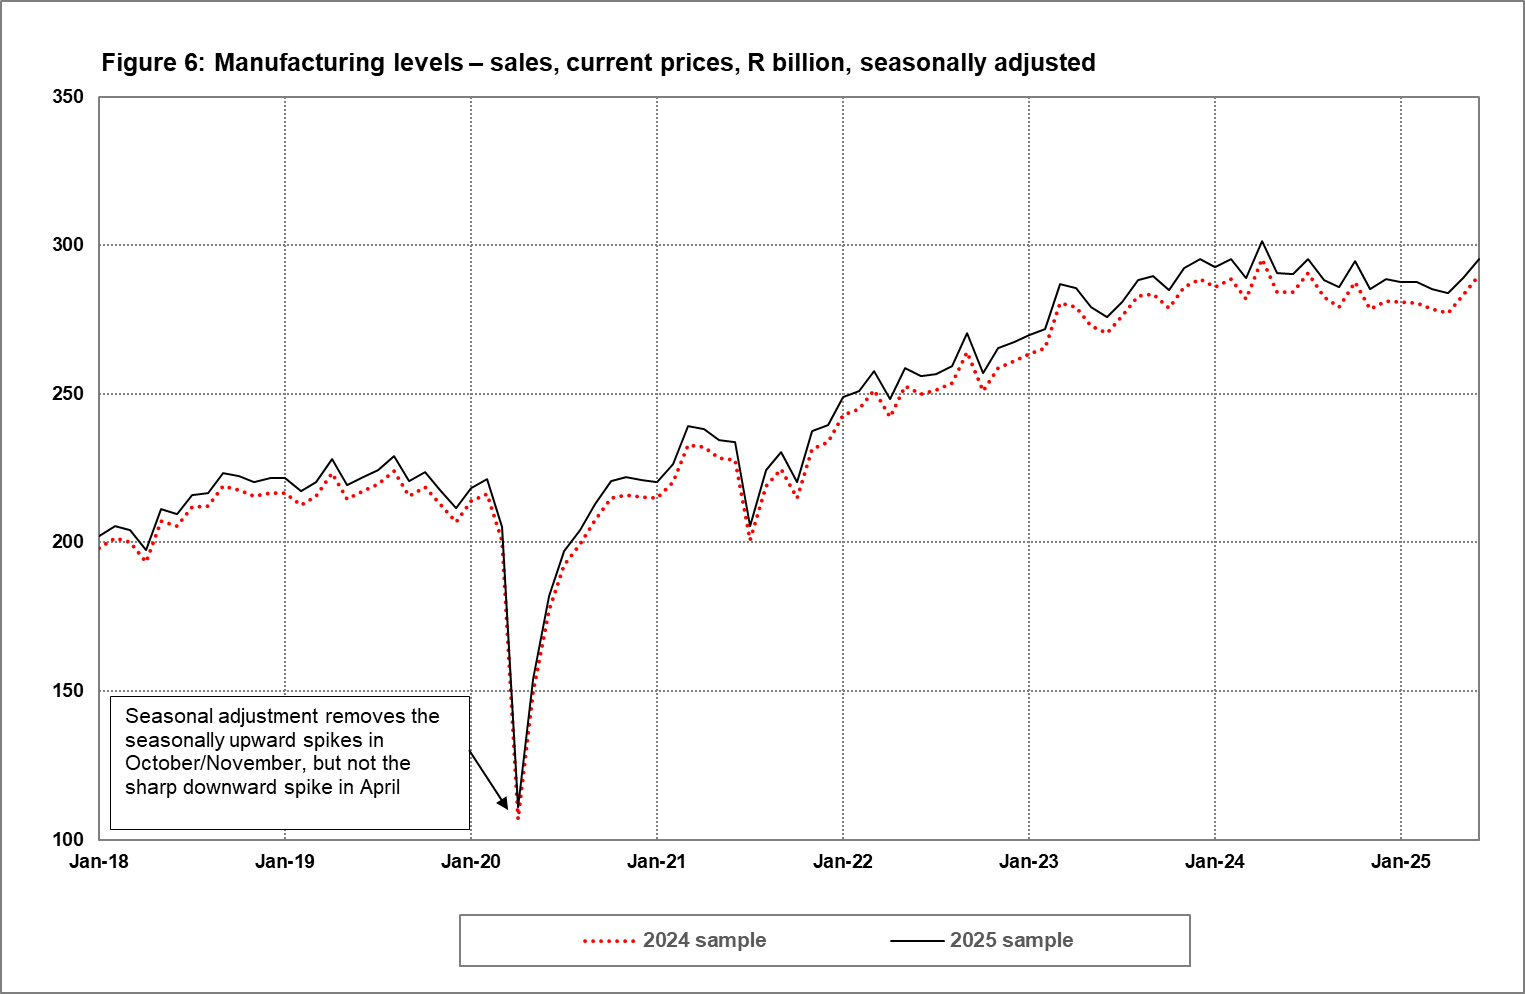
When sales are seasonally adjusted (Figure 6), the spikes ahead of the festive season and the dips during the festive season disappear, leaving the underlying trend clearer. Importantly, the sample-linking method also carries through to the seasonally adjusted series.
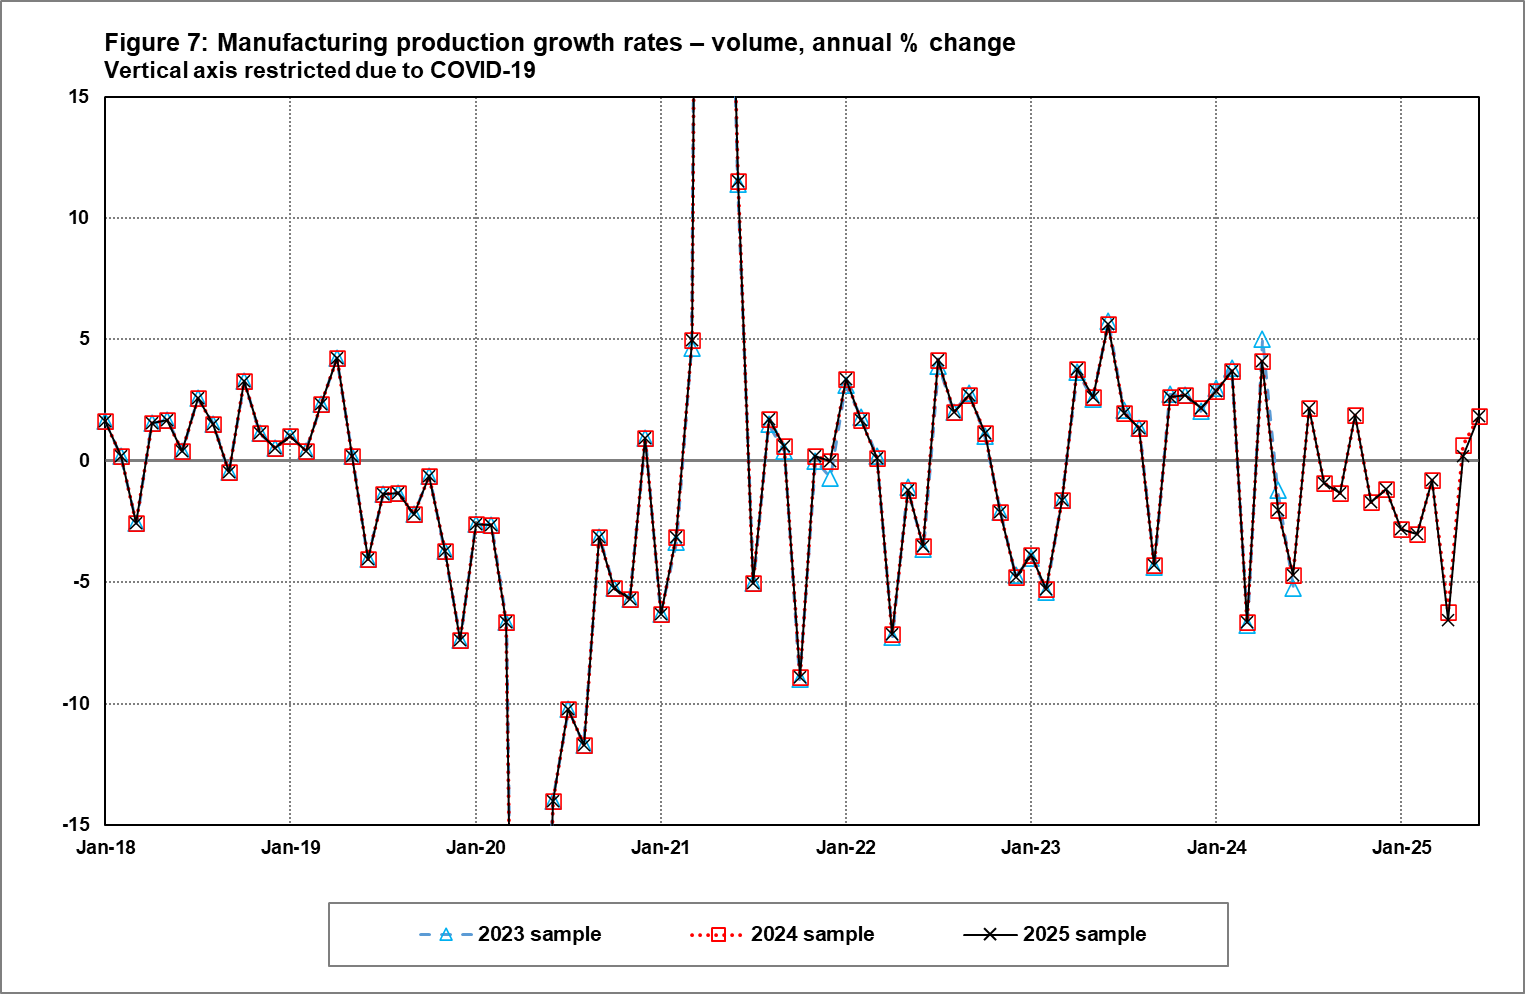
Manufacturing production growth rates (Figure 7), however, are not affected by sample changes because the production index is anchored to its 2019 base year. This provides users with a stable measure of real growth, independent of sample updates.
Conclusion
Refreshing survey samples each year ensures that Stats SA’s monthly business indicators remain aligned with the most up-to-date SBR. While new samples can shift the level of sales or income, linking methods prevent distortions in growth rates, preserving the integrity of the time series. For users, this means that although absolute figures may adjust slightly when a new sample is introduced, the overall growth trends remain consistent.
Similar articles are available on the Stats SA website and can be accessed here.
For a monthly overview of economic indicators and infographics, catch the latest edition of the Stats Biz newsletter here.