

Municipal debt figures can be sliced and diced in several ways. The debt-to-income ratio is one of several indicators used to gauge the financial health of municipalities.
A breakdown of municipal liabilities
In non-financial circles, the word debt is often associated broadly with liabilities, which is any financial obligation that must be paid. This can include items such as outstanding supplier bills and formal loans. Total liabilities for South Africa’s 257 municipalities amounted to R386 billion in 2024, according to Stats SA’s latest Financial census of municipalities statistical release.
In finance, however, debt specifically refers to formal borrowings, which include loans, bank overdrafts and bonds. These form a part of total liabilities. In 2024, formal borrowings accounted for 19% of municipal liabilities (Figure 1). Trade payables, which include unpaid bills to suppliers, accounted for 32%.
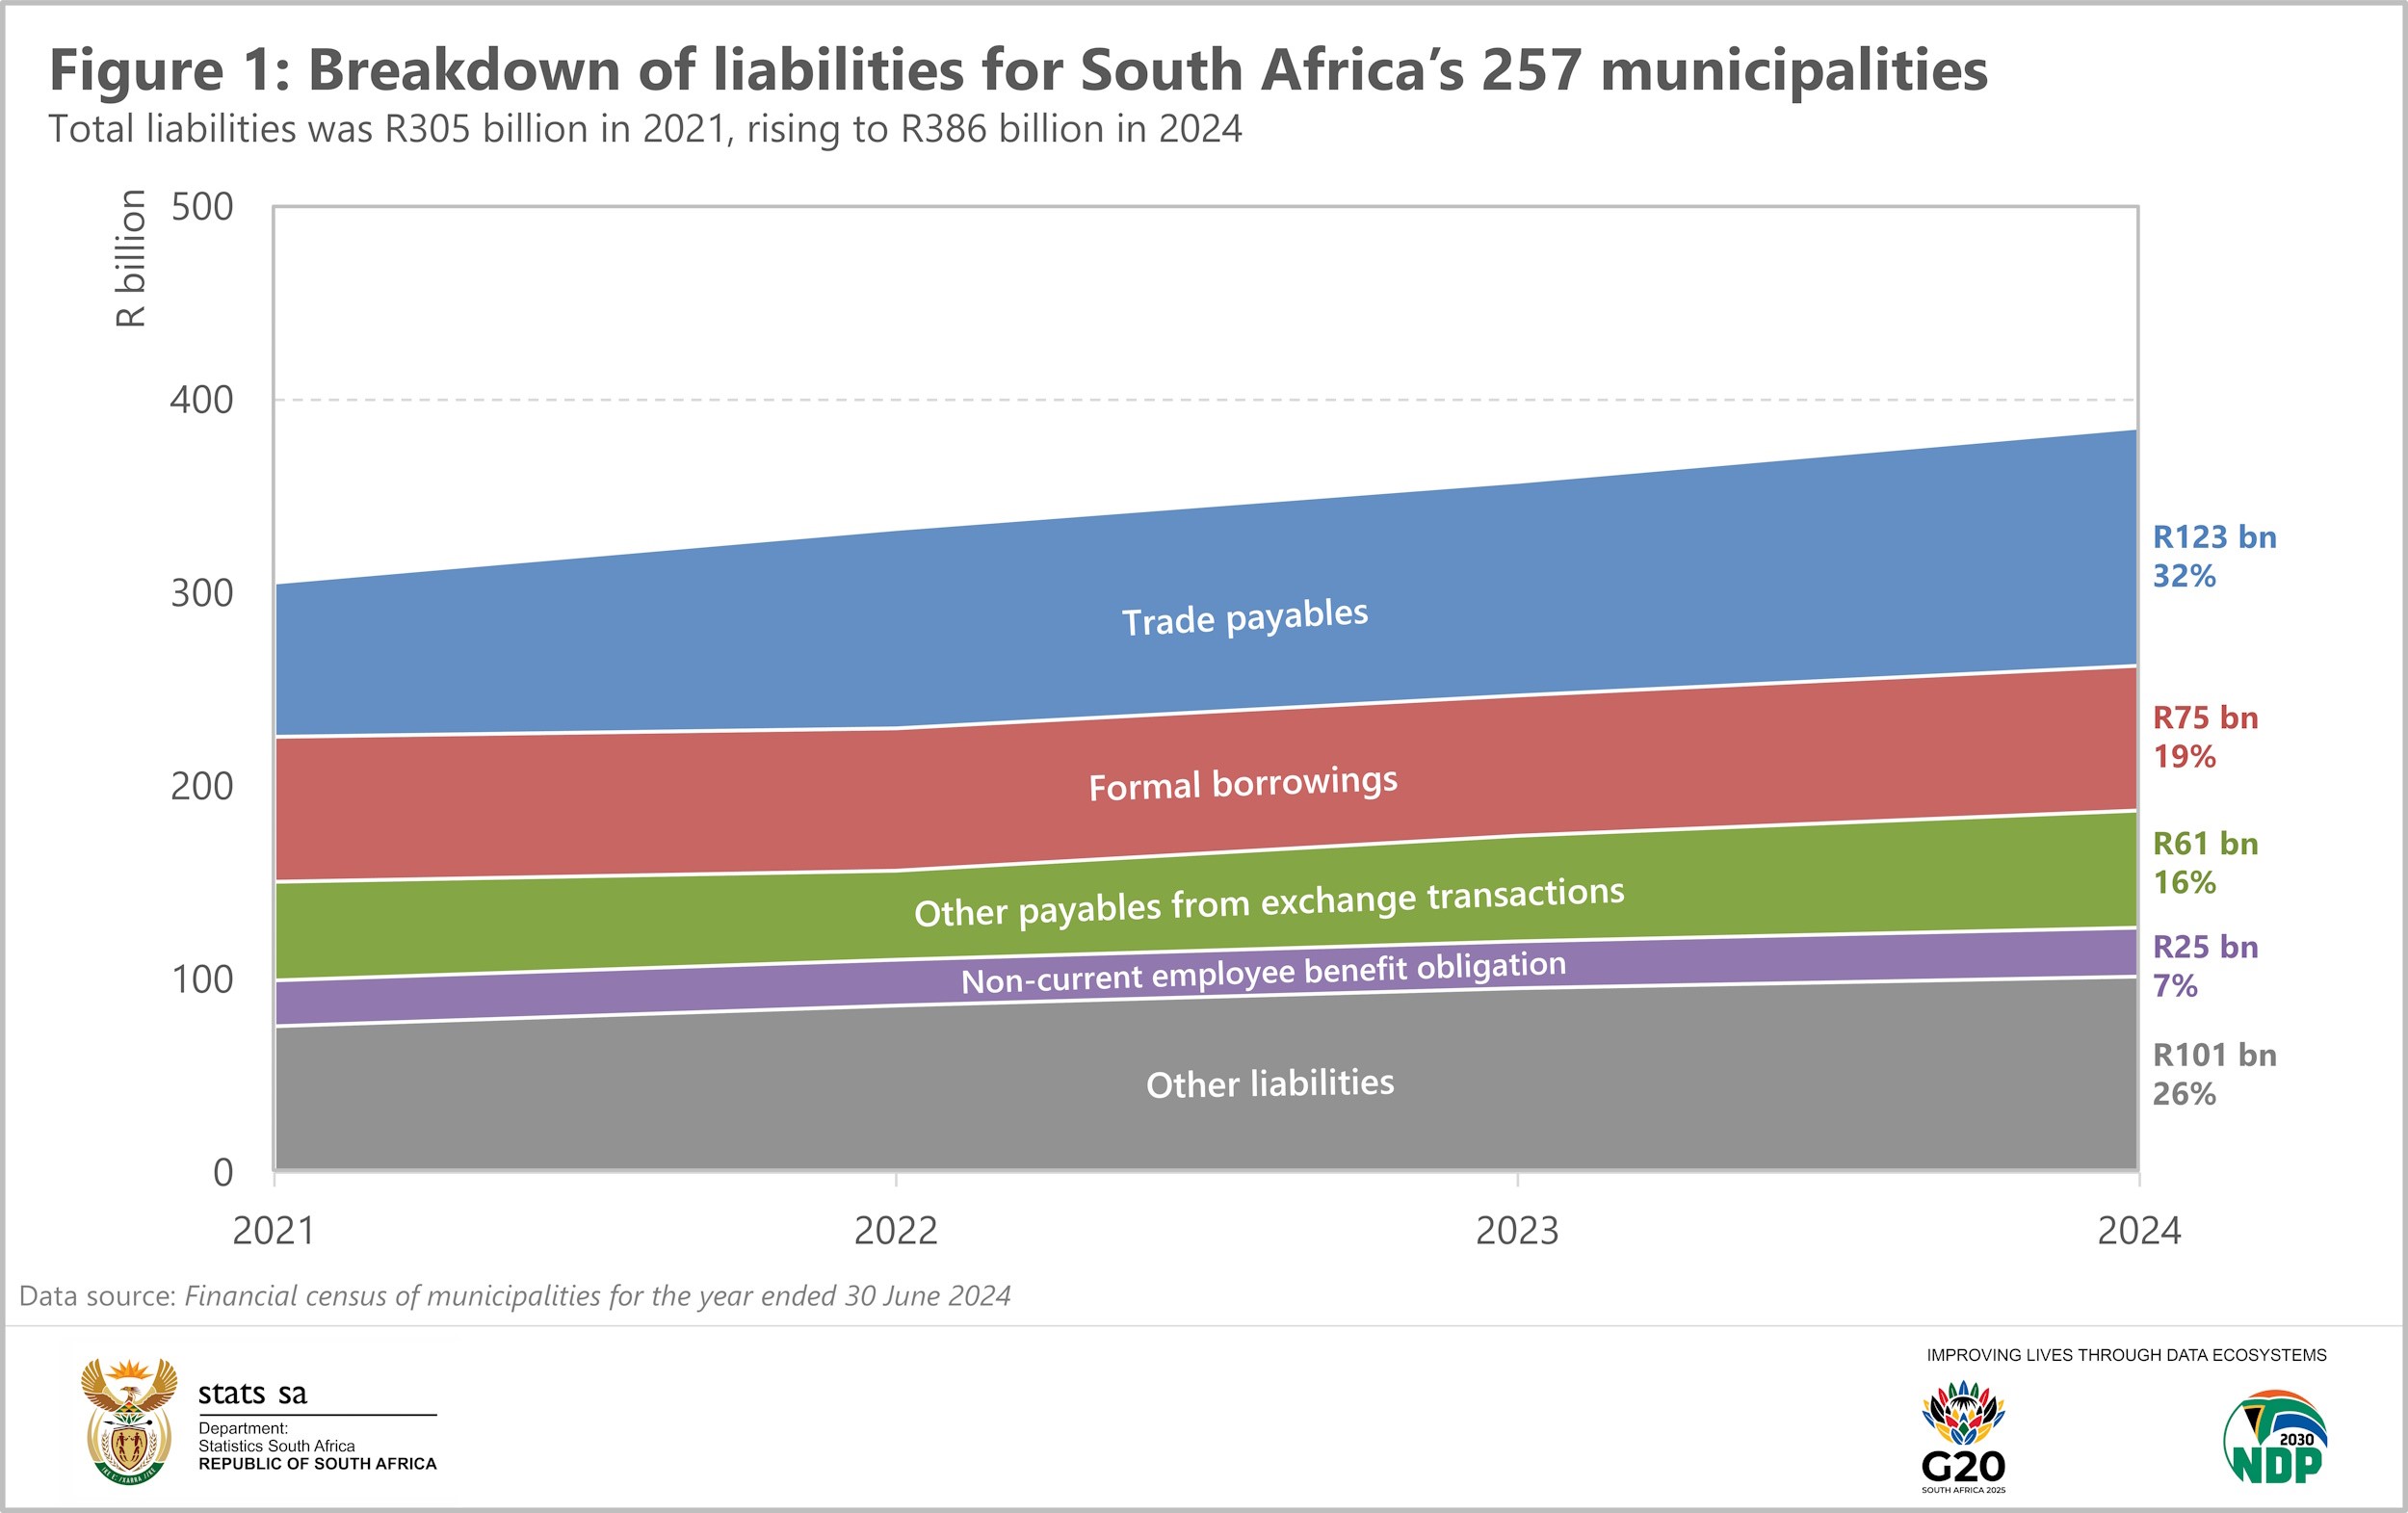
Whereas formal borrowings have remained stable over time, trade payables have expanded notably over the 2021‒2024 period.
Narrowing the focus: Formal borrowings
The debt-to-income ratio helps answer the question of whether a municipality has the capacity to repay its debt from its income. A municipality with a high ratio may struggle to manage its debt burden.
National Treasury’s set of financial ratios and norms limits the calculation to formal borrowings.1 On the income side of the calculation, National Treasury’s Municipal Borrowing Bulletin excludes capital transfers.2 Capital transfers are non-operational, often once-off, and cannot be used to pay back debt.
Municipal borrowings stood at R75 billion in 2024, according to Figure 1. Income (excluding capital transfers) was R530 billion. Dividing municipal borrowings by income gives a debt-to-income ratio of 14,1%.
Free State and Gauteng exceeded the national average (Figure 2). In Free State, Matjhabeng stood out with a ratio of 137,5%, making it the only municipality in the country to surpass 100%. A look at its financial statements for 2024 shows why this is the case. A concessionary loan of R5,3 billion was recorded as part of National Treasury’s municipal debt relief programme, causing a spike in Matjhabeng’s formal debt level.3
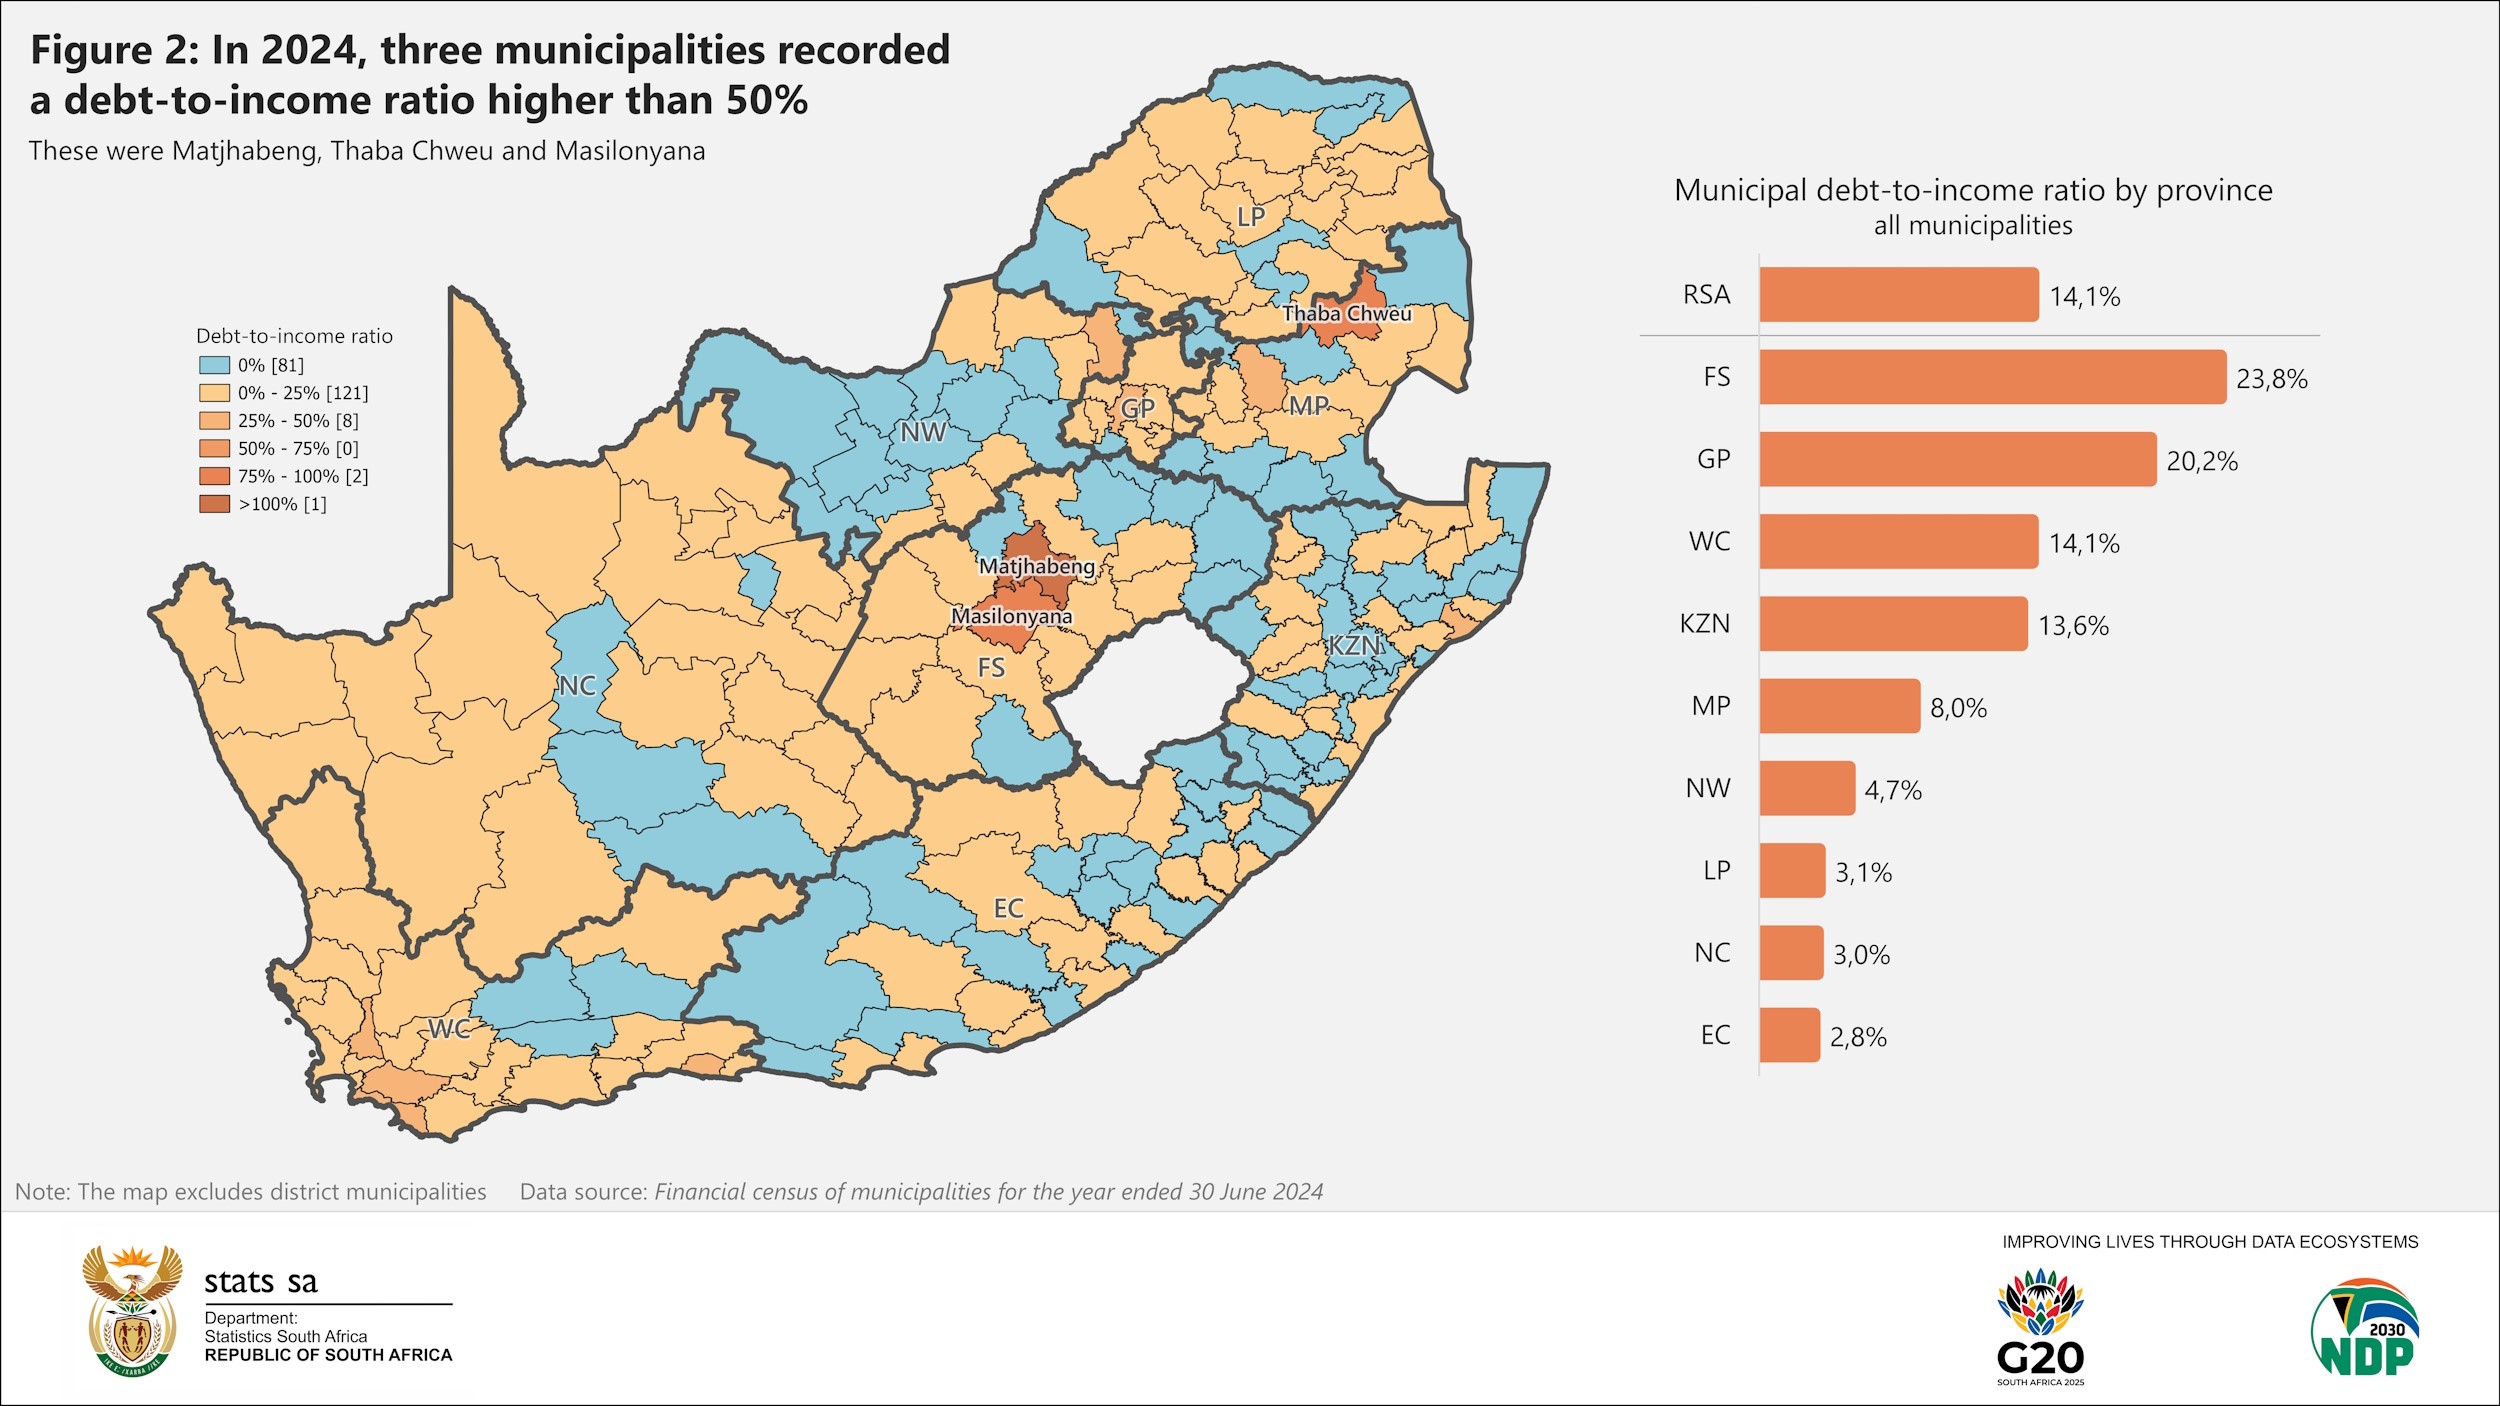
Gauteng’s high ratio was mainly due to the metropolitan heavyweights of City of Johannesburg (28,0%), City of Tshwane (20,5%) and City of Ekurhuleni (16,7%).
Figure 3 shows how the debt-to-income ratio has changed over time. Free State is a clear outlier, with its debt-to-income ratio sharply higher in 2024 compared with 2021. Closer inspection of the data reveals that much of this increase occurred in 2024, with Matjhabeng (mentioned earlier) the main contributor.
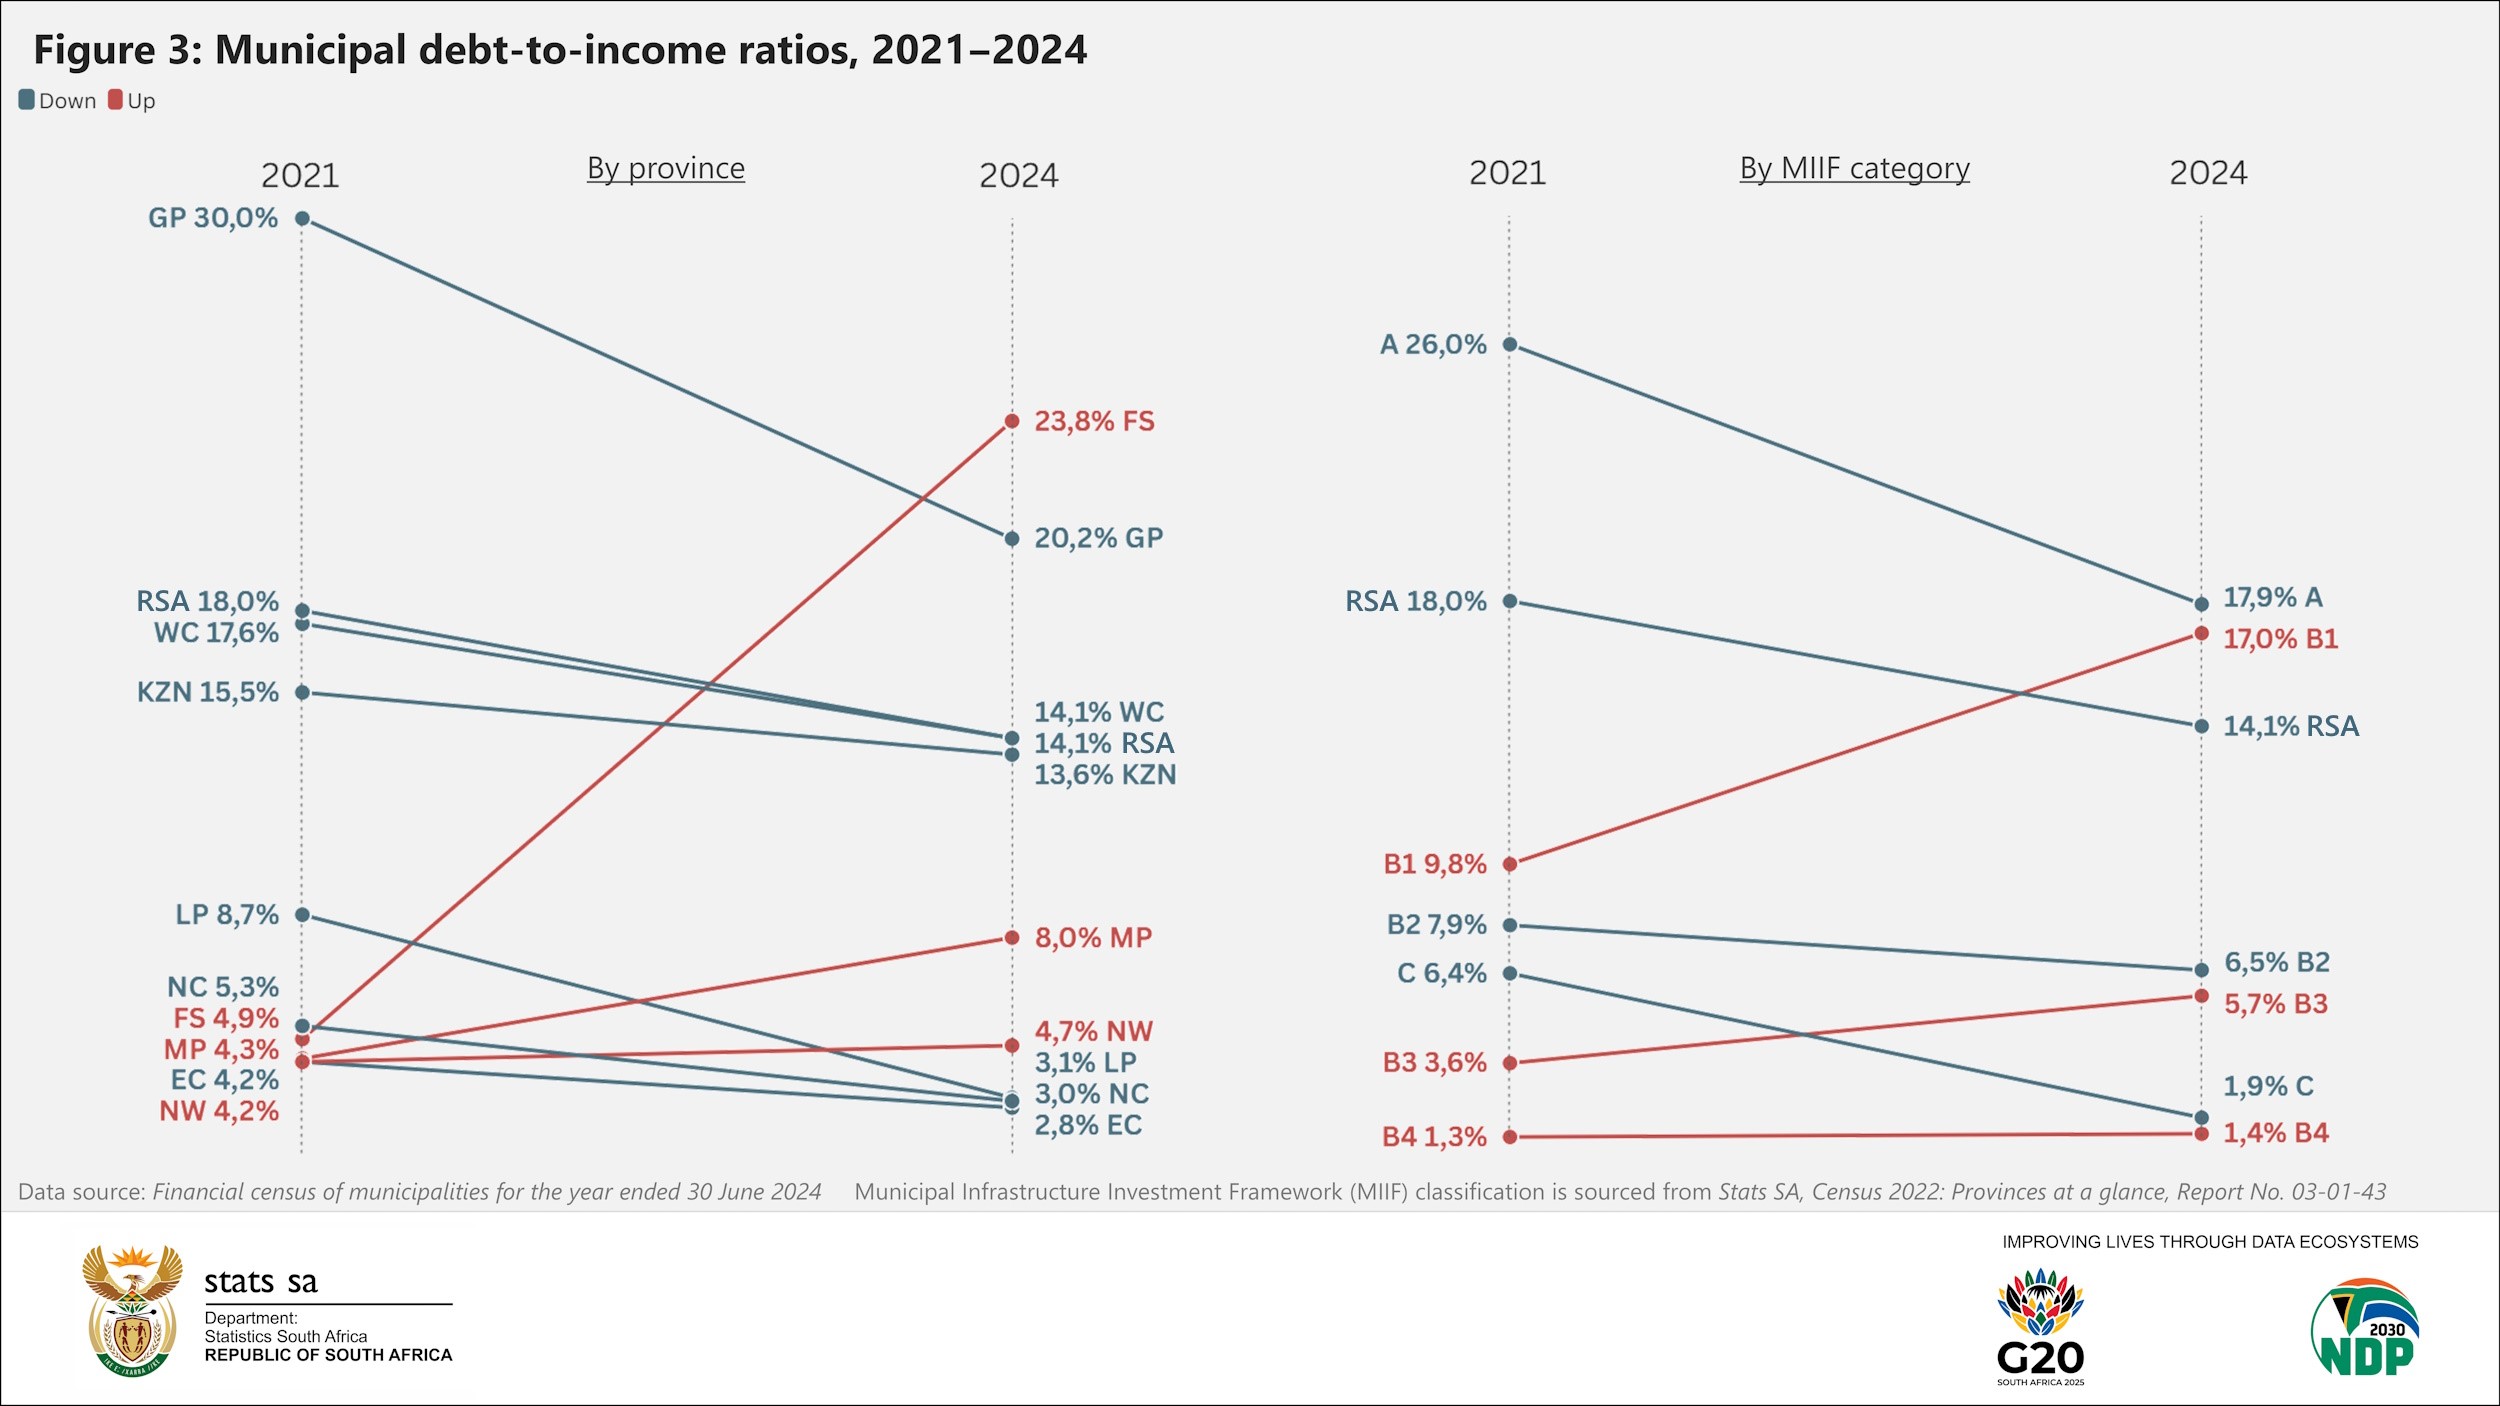
Gauteng saw its debt-to-income ratio fall over the same period. Many of the municipalities in the province recorded a decline in formal borrowings alongside a rise in income. This includes the three metropolitan municipalities.
Figure 3 also provides a breakdown by municipal type. The Municipal Infrastructure Investment Framework (MIIF) categorises municipalities into metropolitan municipalities (A), secondary cities (B1), municipalities with a large town as its core (B2), municipalities with small towns (B3), municipalities that are predominantly rural (B4), and district municipalities (C).4
As a group, B1 municipalities recorded a sharp rise in the debt-to-income ratio, which again includes Matjhabeng. Other B1 municipalities that recorded notable increases include Steve Tshwete in Mpumalanga and City of uMhlathuze in KwaZulu-Natal.
Metropolitan municipalities, designated as A-type municipalities, saw a decline. All eight metropolitan municipalities recorded lower debt-to-income ratios in 2024 compared with 2021.
Exploring the impact of Matjhabeng
The large concessionary loan on the books of Matjhabeng in 2024 had a notable impact on the debt-to-income ratios for Free State and the B1 category. If this loan is removed from the analysis above, the ratio for Free State is strikingly lower at 2,7% in 2024 (instead of 23,8%). The ratio for B1 municipalities shifts downwards to 9,9% (instead of 17,0%) and the national ratio is softer at 13,1% (instead of 14,1%).
An important note about this analysis
Readers may rightly point out that the debt-to-income ratio, as calculated here, is blind to a crucial aspect: it doesn’t account for unpaid bills to Eskom and other suppliers, which have weighed heavily on municipal finances. As trade payables, these line items are excluded from the analysis above. A comprehensive overview of financial health requires the consideration of more than just one indicator. Stats SA will expand its exploration of municipal liabilities in a future article.
For more information, download the Financial statistics of municipalities, 2024 statistical release and associated unit level data here. A comparable time series is also available for the 2020‒2024 period. In the analysis above, the year 2021 was chosen as the starting point instead of 2020. This was to avoid any distortions the COVID-19 pandemic may have caused on municipal finances.
1 National Treasury, Annexure 1 – Summary of Uniform Financial Ratios and Norms, page 3 (download here).
2 National Treasury, Municipal Borrowing Bulletin, main page (via the Internet Archive).
3 Matjhabeng Local Municipality, Annual Financial Statements for the year ended 30 June 2024, page 69 (download here).
4 Development Bank of South Africa, 2011. The Municipal Infrastructure Investment Framework (MIIF 7), Round 7 (2009–2010): A capital investment perspective (download here). A list of municipalities categorised by the MIIF classification is accessible from Stats SA’s Census 2022: Provinces at a glance report, available here.
Similar articles are available on the Stats SA website and can be accessed here.
For a monthly overview of economic indicators and infographics, catch the latest edition of the Stats Biz newsletter here.