

This year’s Women’s Month marks two major milestones: the 69th anniversary of the 1956 women’s march to the Union Buildings and the 30th anniversary of the first official National Women’s Day. Under the theme “Building Resilient Economies for All,” the 2025 commemoration highlights the importance of women’s participation in leadership and the economy.
As the country reflects on the strides made toward gender equality, the latest Quarterly Labour Force Survey (QLFS) for the second quarter of 2025 reveals ongoing disparities in the labour market. South Africa’s national unemployment rate stands at 33,2%, but the figures show that women continue to carry a heavier share of this burden. The unemployment rate for women was 35,9%, compared to 31,0% for men, a gap of 4,9 percentage points.
These differences reflect persistent gender imbalances in unemployment, labour force participation, and the sectors in which men and women are employed.
The Gender Divide in Unemployment Persists Across Education Levels
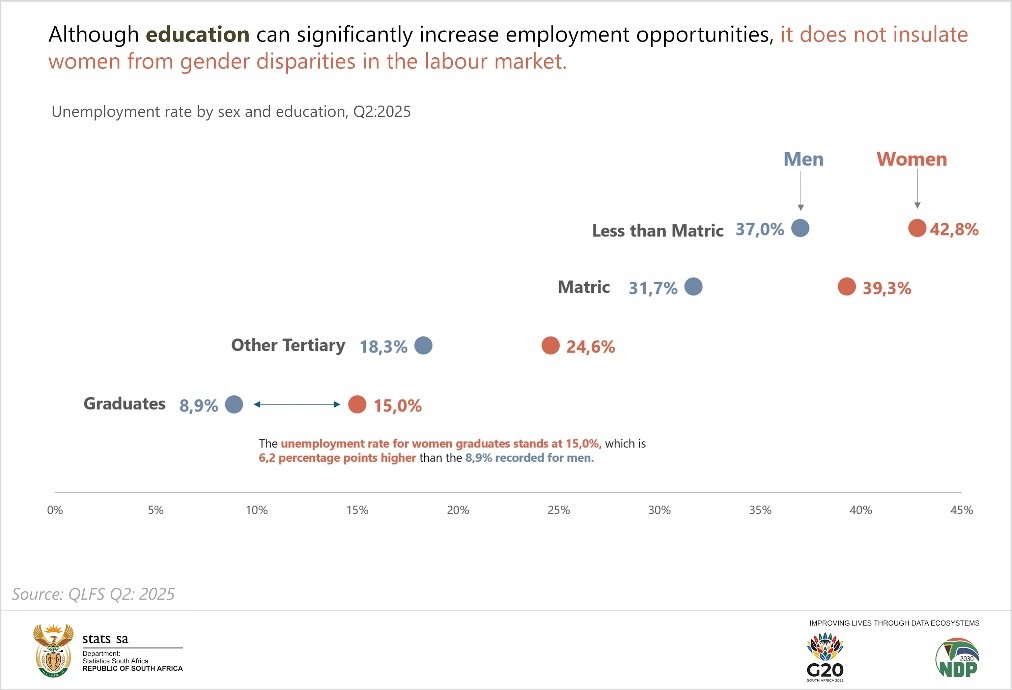
Education is often seen as a pathway to better job prospects, but it doesn’t close the gap in unemployment for South African women. Recent data shows that gender disparities in the labour market remain entrenched across all levels of educational attainment.
In the second quarter of 2025, the official unemployment rate for graduates stood at 12,2%, marking a 0,5 percentage point increase from the previous quarter. While this rate is lower than the national average, a closer look reveals a persistent gender gap among the most educated. Female graduates faced an unemployment rate of 15,0%, compared to 8,9% for their male counterparts, a difference of 6,1 percentage points.
The disparity is even more pronounced among those with lower educational qualifications. Women without a matric certificate recorded an unemployment rate of 42,8%, compared to 37,0% for men. This 5,8 percentage points difference highlights the heightened vulnerability of women with limited schooling, who face both educational and gender-based barriers to employment.
For individuals with only a matric certificate, the gender gap widens further. Unemployment among women in this group was 39,3%, while the rate for men was 31,7%. This 7,6 percentage points gap is the widest across all education levels.
No matter the level of education, women in South Africa face significantly greater challenges in securing employment than men.
Gender Gap in Labour Force Participation Remains Wide Despite Decade of Change
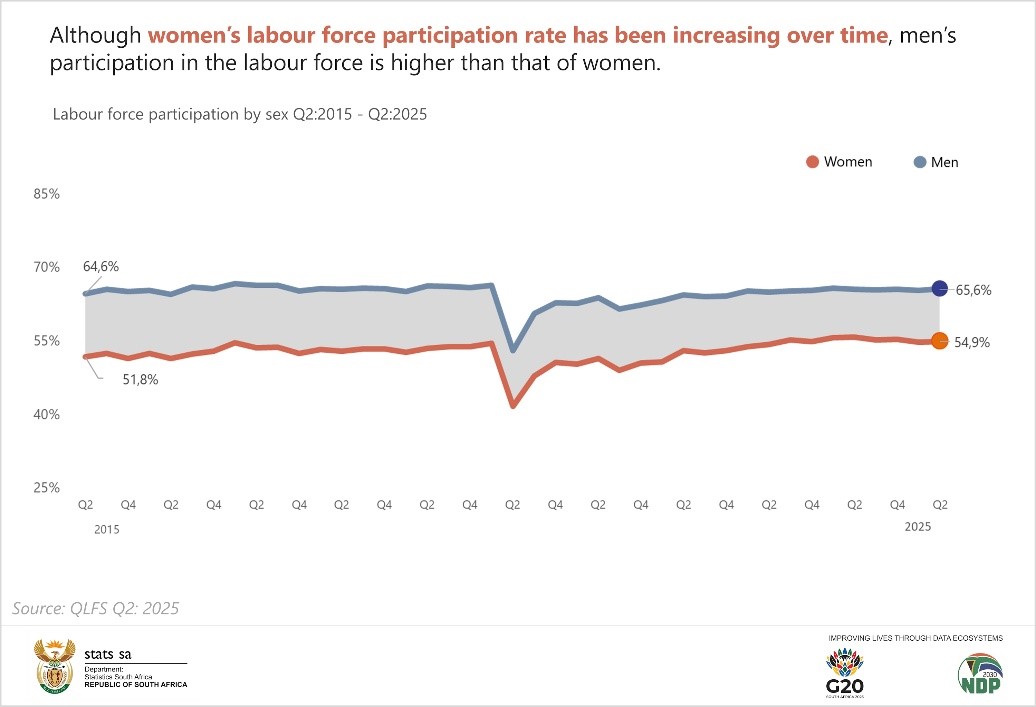
While unemployment rates often make the headlines, the labour force participation rate – a figure that reflects who is actively engaged in the economy, either through employment or by actively seeking work and being available reveals a consistent gender divide that persists across industries and occupations.
In the second quarter of 2025, 65,6% of working-age men were participating in the labour force, compared to 54,9% of women. This 10,7 percentage point gap translates into millions of women who remain outside the labour force. A decade ago, in the same quarter of 2015, the gender gap in participation stood at 12,9 percentage points. Despite efforts to improve gender equity in the workplace, the gap has only marginally narrowed over ten years.
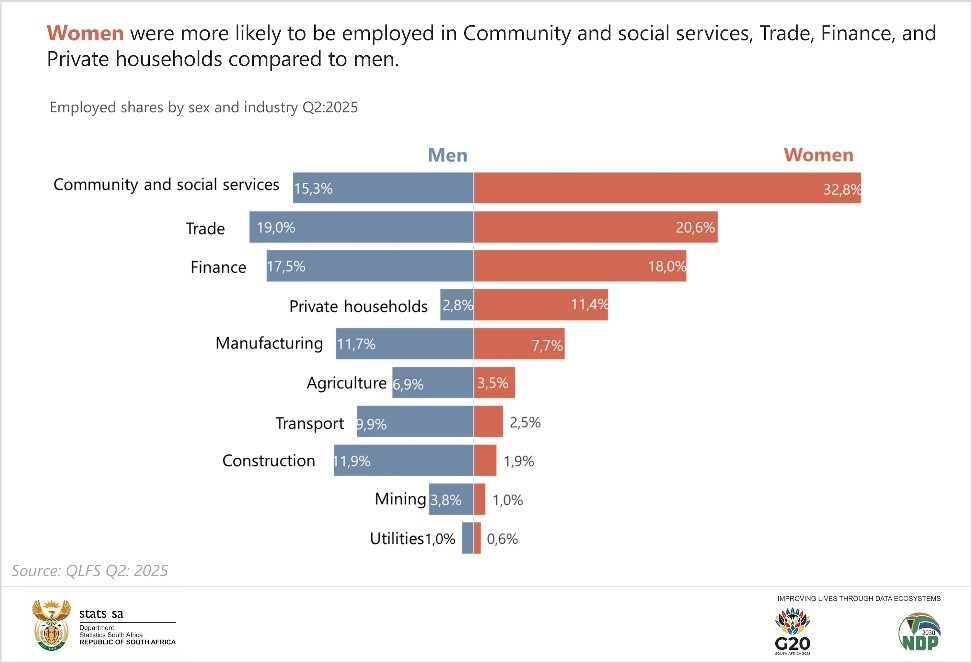
Even when women are employed, they are often concentrated in specific industries. According to the latest data, nearly a third of all employed women (32,8%) work in community and social services. This is followed by 20,6% in the trade industry, 18,0% in finance, and 11,4% in private household employment. Women remain significantly underrepresented in male-dominated industries such as transport, construction, and mining, where their representation stands at 2,5%, 1,9%, and 1,0% respectively.
The occupational breakdown further reveals the gendered nature of the labour force. In Q2:2025, only 6,8% of employed women held managerial positions, compared to 10,7% of men. Many women are concentrated in lower-skilled or semi-skilled roles. Elementary occupations accounted for 21,5% of all employed women, followed by 19,2% in sales and services, and 17,6% in clerical positions. Skilled agriculture, craft and related trade, and machine operation each represented less than 4% of jobs held by women.
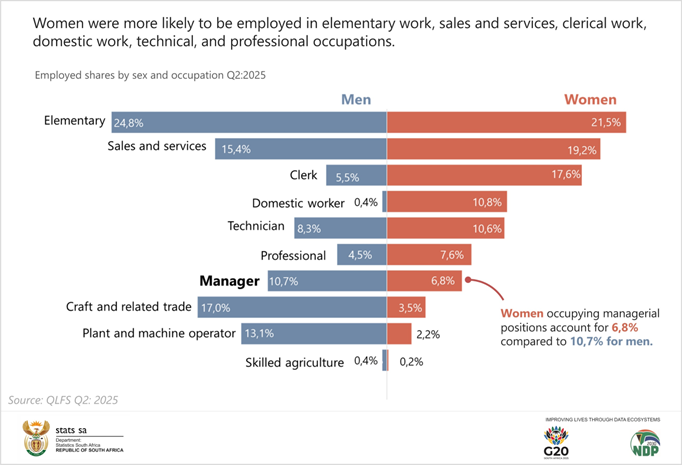
Despite this concentration in lower-level positions, women are slightly more represented in certain higher-skilled categories. Women make up 7,6% of professional roles and 10,6% of technician roles, compared to 4,5% and 8,3% of men respectively in those occupations.
For many women, the informal sector continues to serve as an economic safety net. In Q2:2025 close to 1,2 million women, equivalent to 15,9% of all employed women, worked in the informal sector. These jobs often lack formal protections such as medical aid, pensions, or contracts.
A more telling indicator of economic vulnerability is the informal employment rate, which includes all persons who are employed, working in the informal sector, private households and helping unpaid in a household business or working for someone else for pay and are not entitled to pension or medical aid and have no written contract. This rate stood at 27,2% for women in Q2:2025, indicating that more than one in four employed women, approximately 2,0 million individuals, are in vulnerable positions.
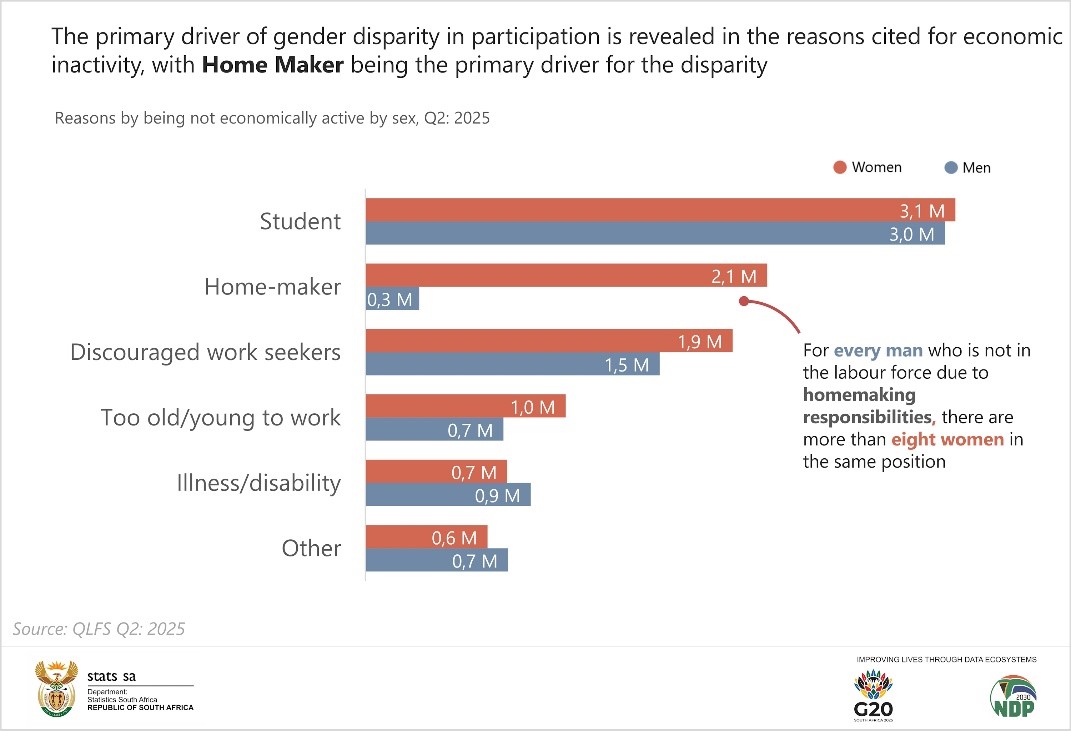
One of the primary reasons for women’s lower participation in the labour market is revealed in the reasons for inactivity. In Q2:2025, 2,4 million people cited “homemaker” as their reason for not being in the labour force. Of these, 2,1 million (88,2%) were women, while just 280,000 were men. This means that for every man staying out of the labour force due to homemaking responsibilities, more than eight women are in the same position.
From industry concentration and occupational segregation to informal work, women continue to face significant challenges in achieving full and equal participation in the economy.
For more information, download the full report here.