
Ocean fishing: what’s filling our nets?
Amanzimtoti Main Beach was reopened last week following the end of 2025’s sardine run.1 The annual mass migration of fish, which occurs between May and July, is a boon for local fishing communities along the KwaZulu-Natal coast.
The sardine run highlights South Africa’s rich marine resources, which contribute to a vibrant fishing industry. A recent report by Stats SA focuses on the ocean (marine) fisheries and related services industry, providing financial facts and figures, as well as data on employment and overall catch volumes.2
Anchovies and hake lead the way
Catch volumes are measured in terms of mass or generated income. Anchovies dominate in terms of mass, with catch volumes reaching 152 431 metric tons in 2023 (Figure 1). These slender fish are best known globally for their salty taste and are incorporated into a variety of meals and sauces. In South Africa, caught anchovies are used for fishmeal and oil rather than for human consumption.3
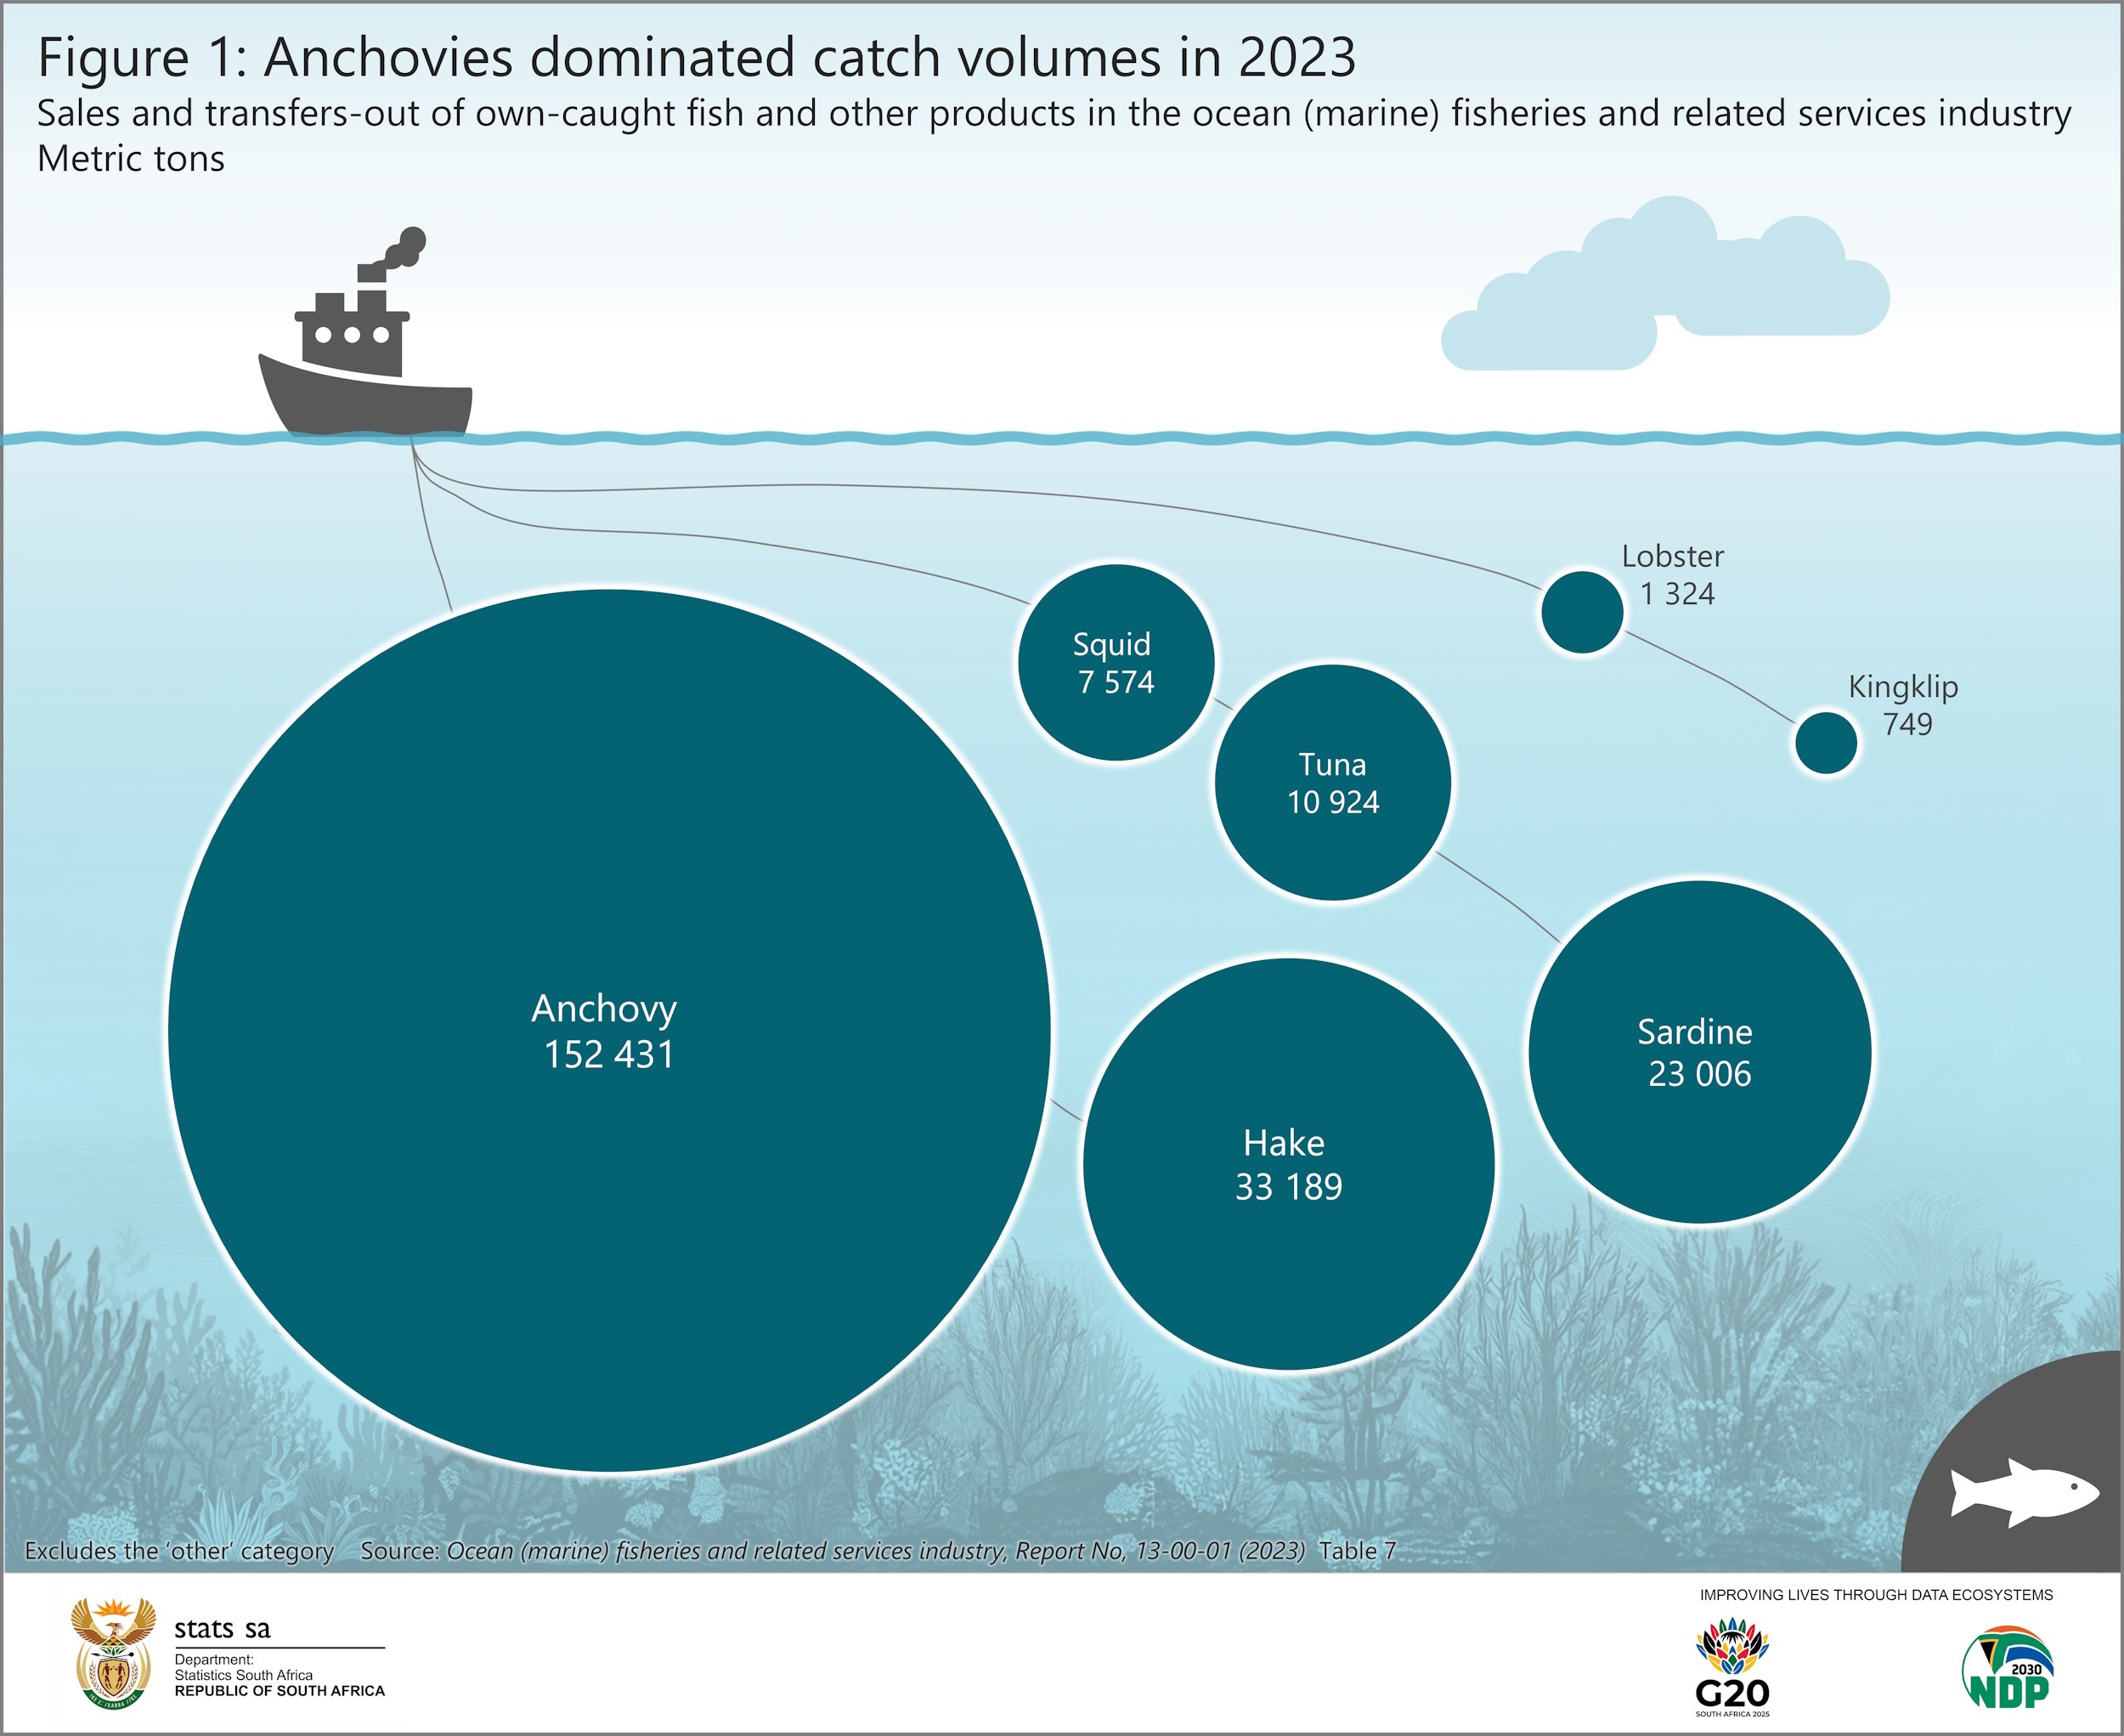
Hake was the second largest caught fish. The humble sardine, the instigator of all the excitement along the east coast, was the third largest.
Although hake follows behind in mass, it shines in terms of income. In 2023, hake generated over a quarter of total sales of caught fish, followed by squid, lobster, tuna and anchovy (Figure 2).
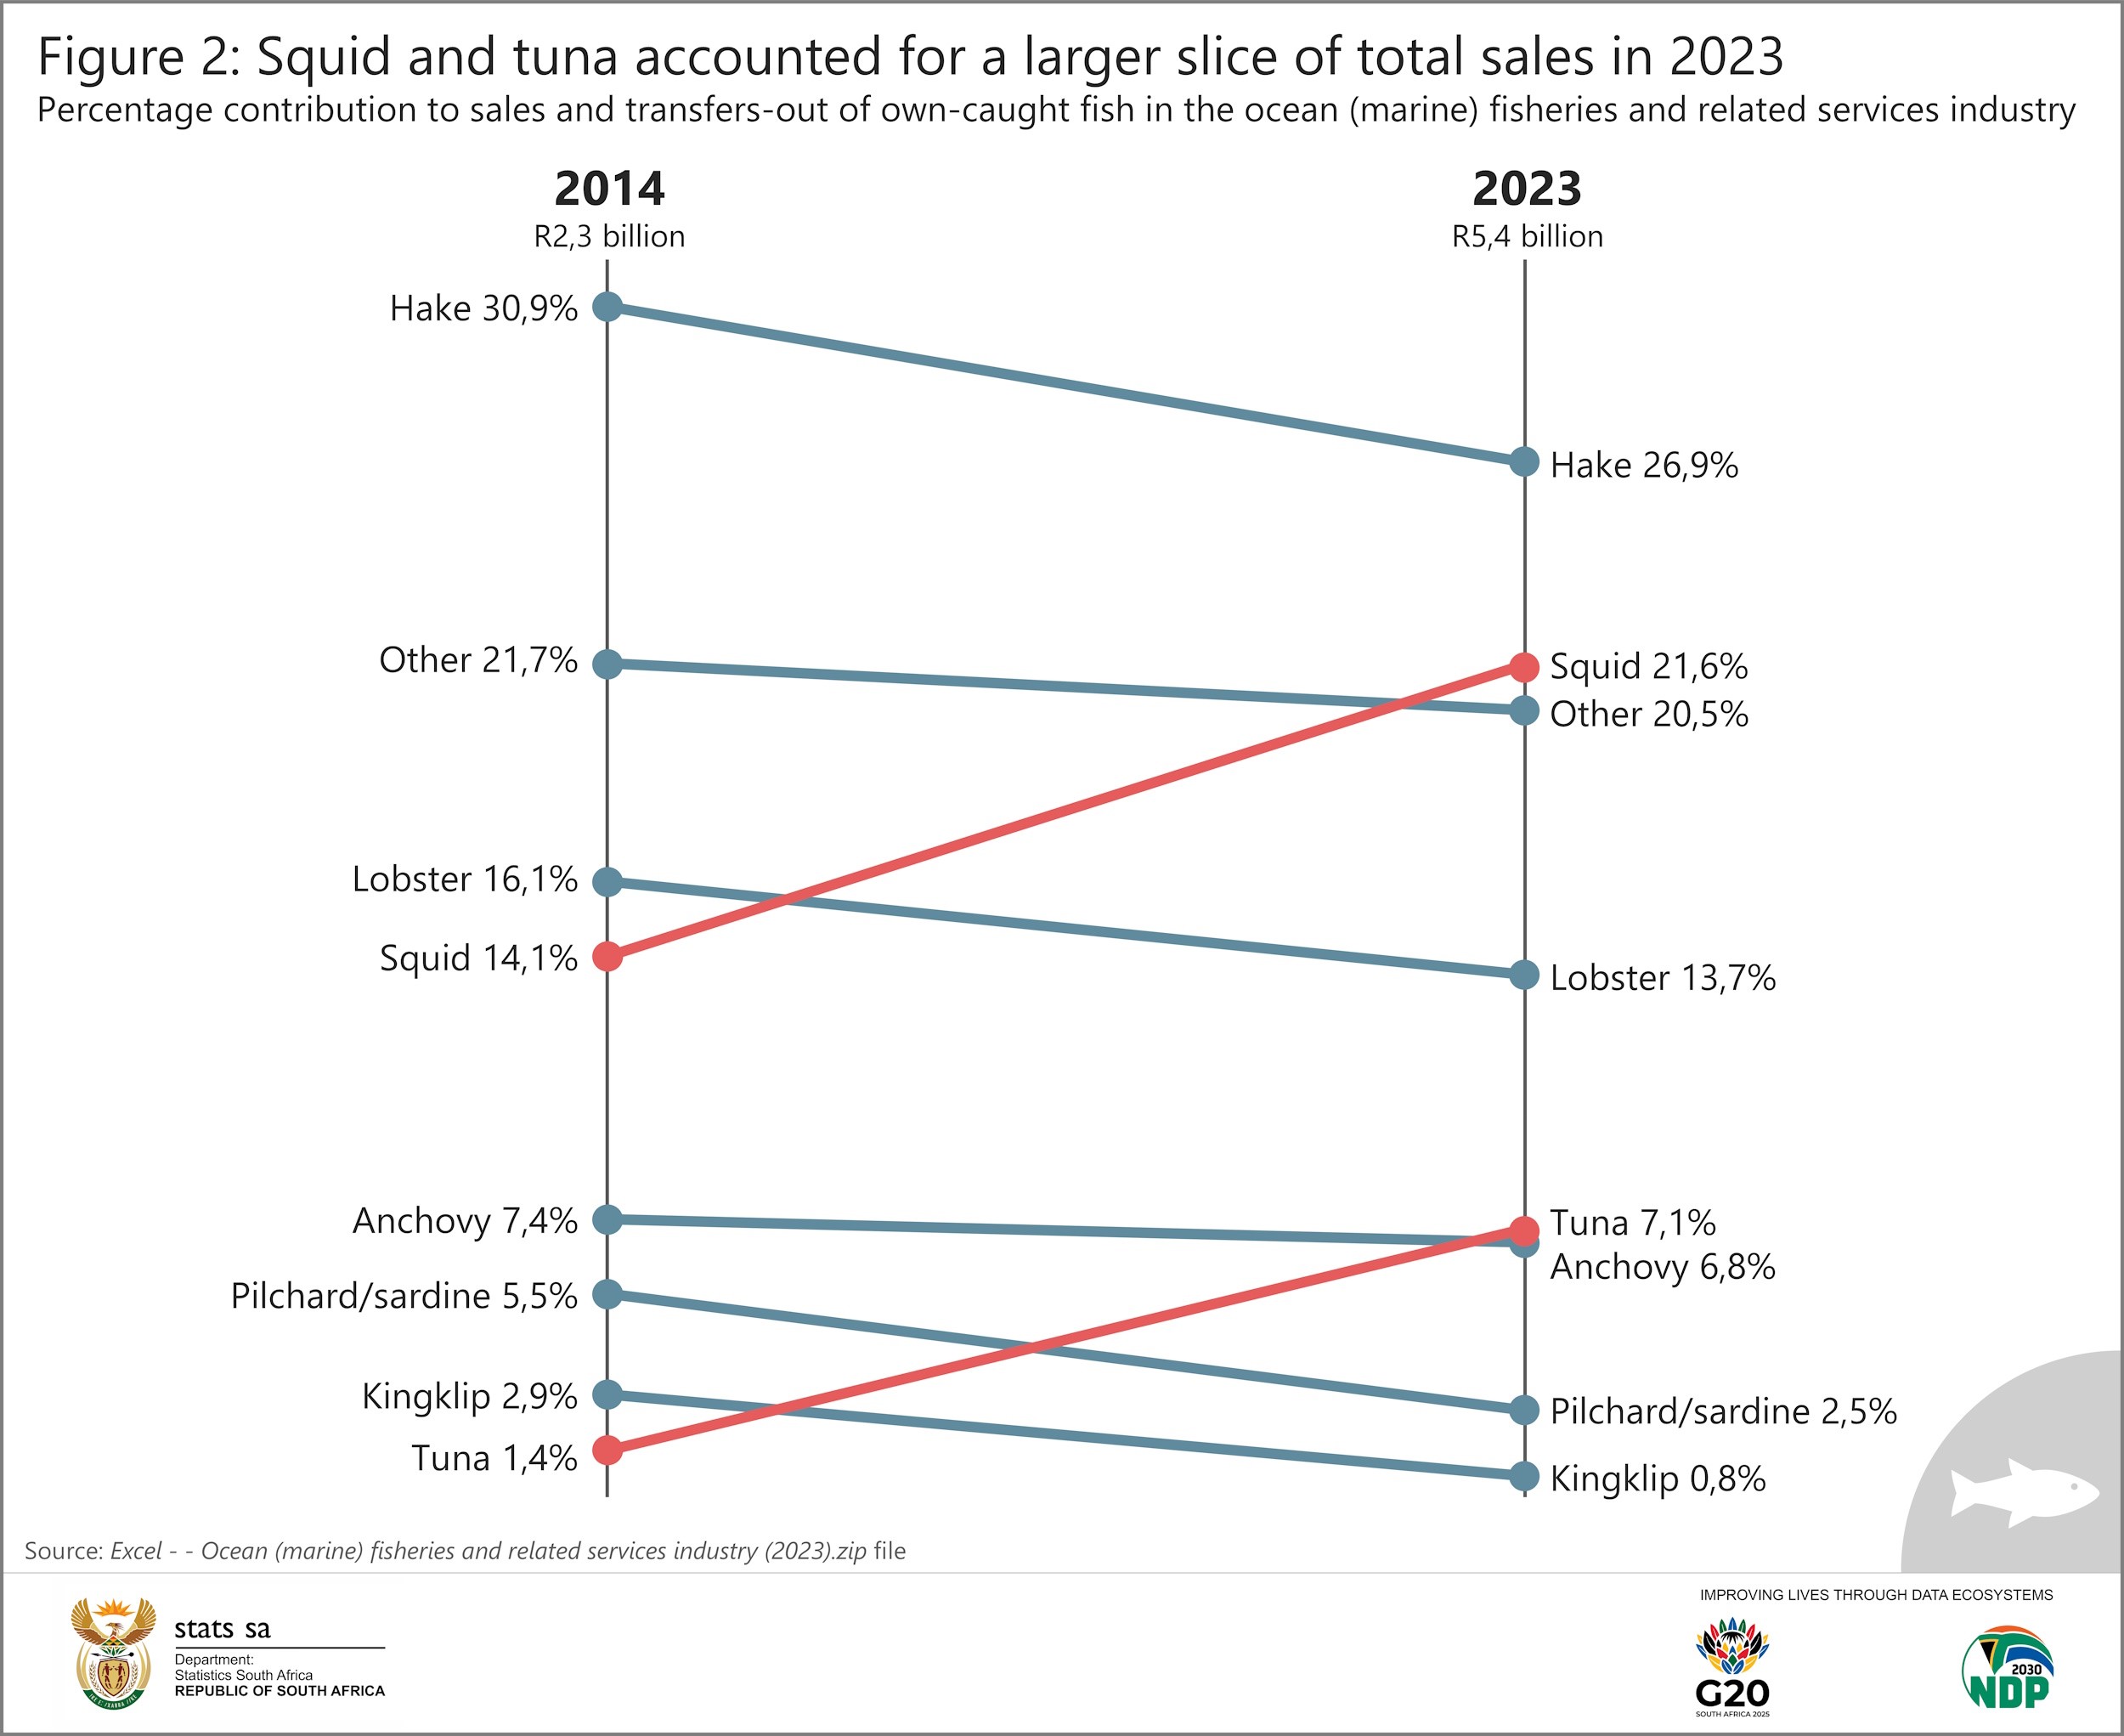
In contrast to anchovy, South African hake is widely distributed as a food source. The fish accounts for 0,8% of total household spending on food, according to the consumer inflation basket. This is higher than other food items such as beef steak, sausages and meat patties.4
Although hake lost some market share in Figure 2, it doubled the value of income it generated, from R0,7 billion in 2014 to R1,4 billion in 2023.
Squid and tuna have muscled their way up the rankings, bolstering their contributions to total sales. Both recorded notable increases in rand terms too.
The lifeblood of the industry
Caught fish is the second largest source of income for the ocean (marine) fisheries and related services industry, generating R5,4 billion in 2023. Processed fish was the largest source (Figure 3).
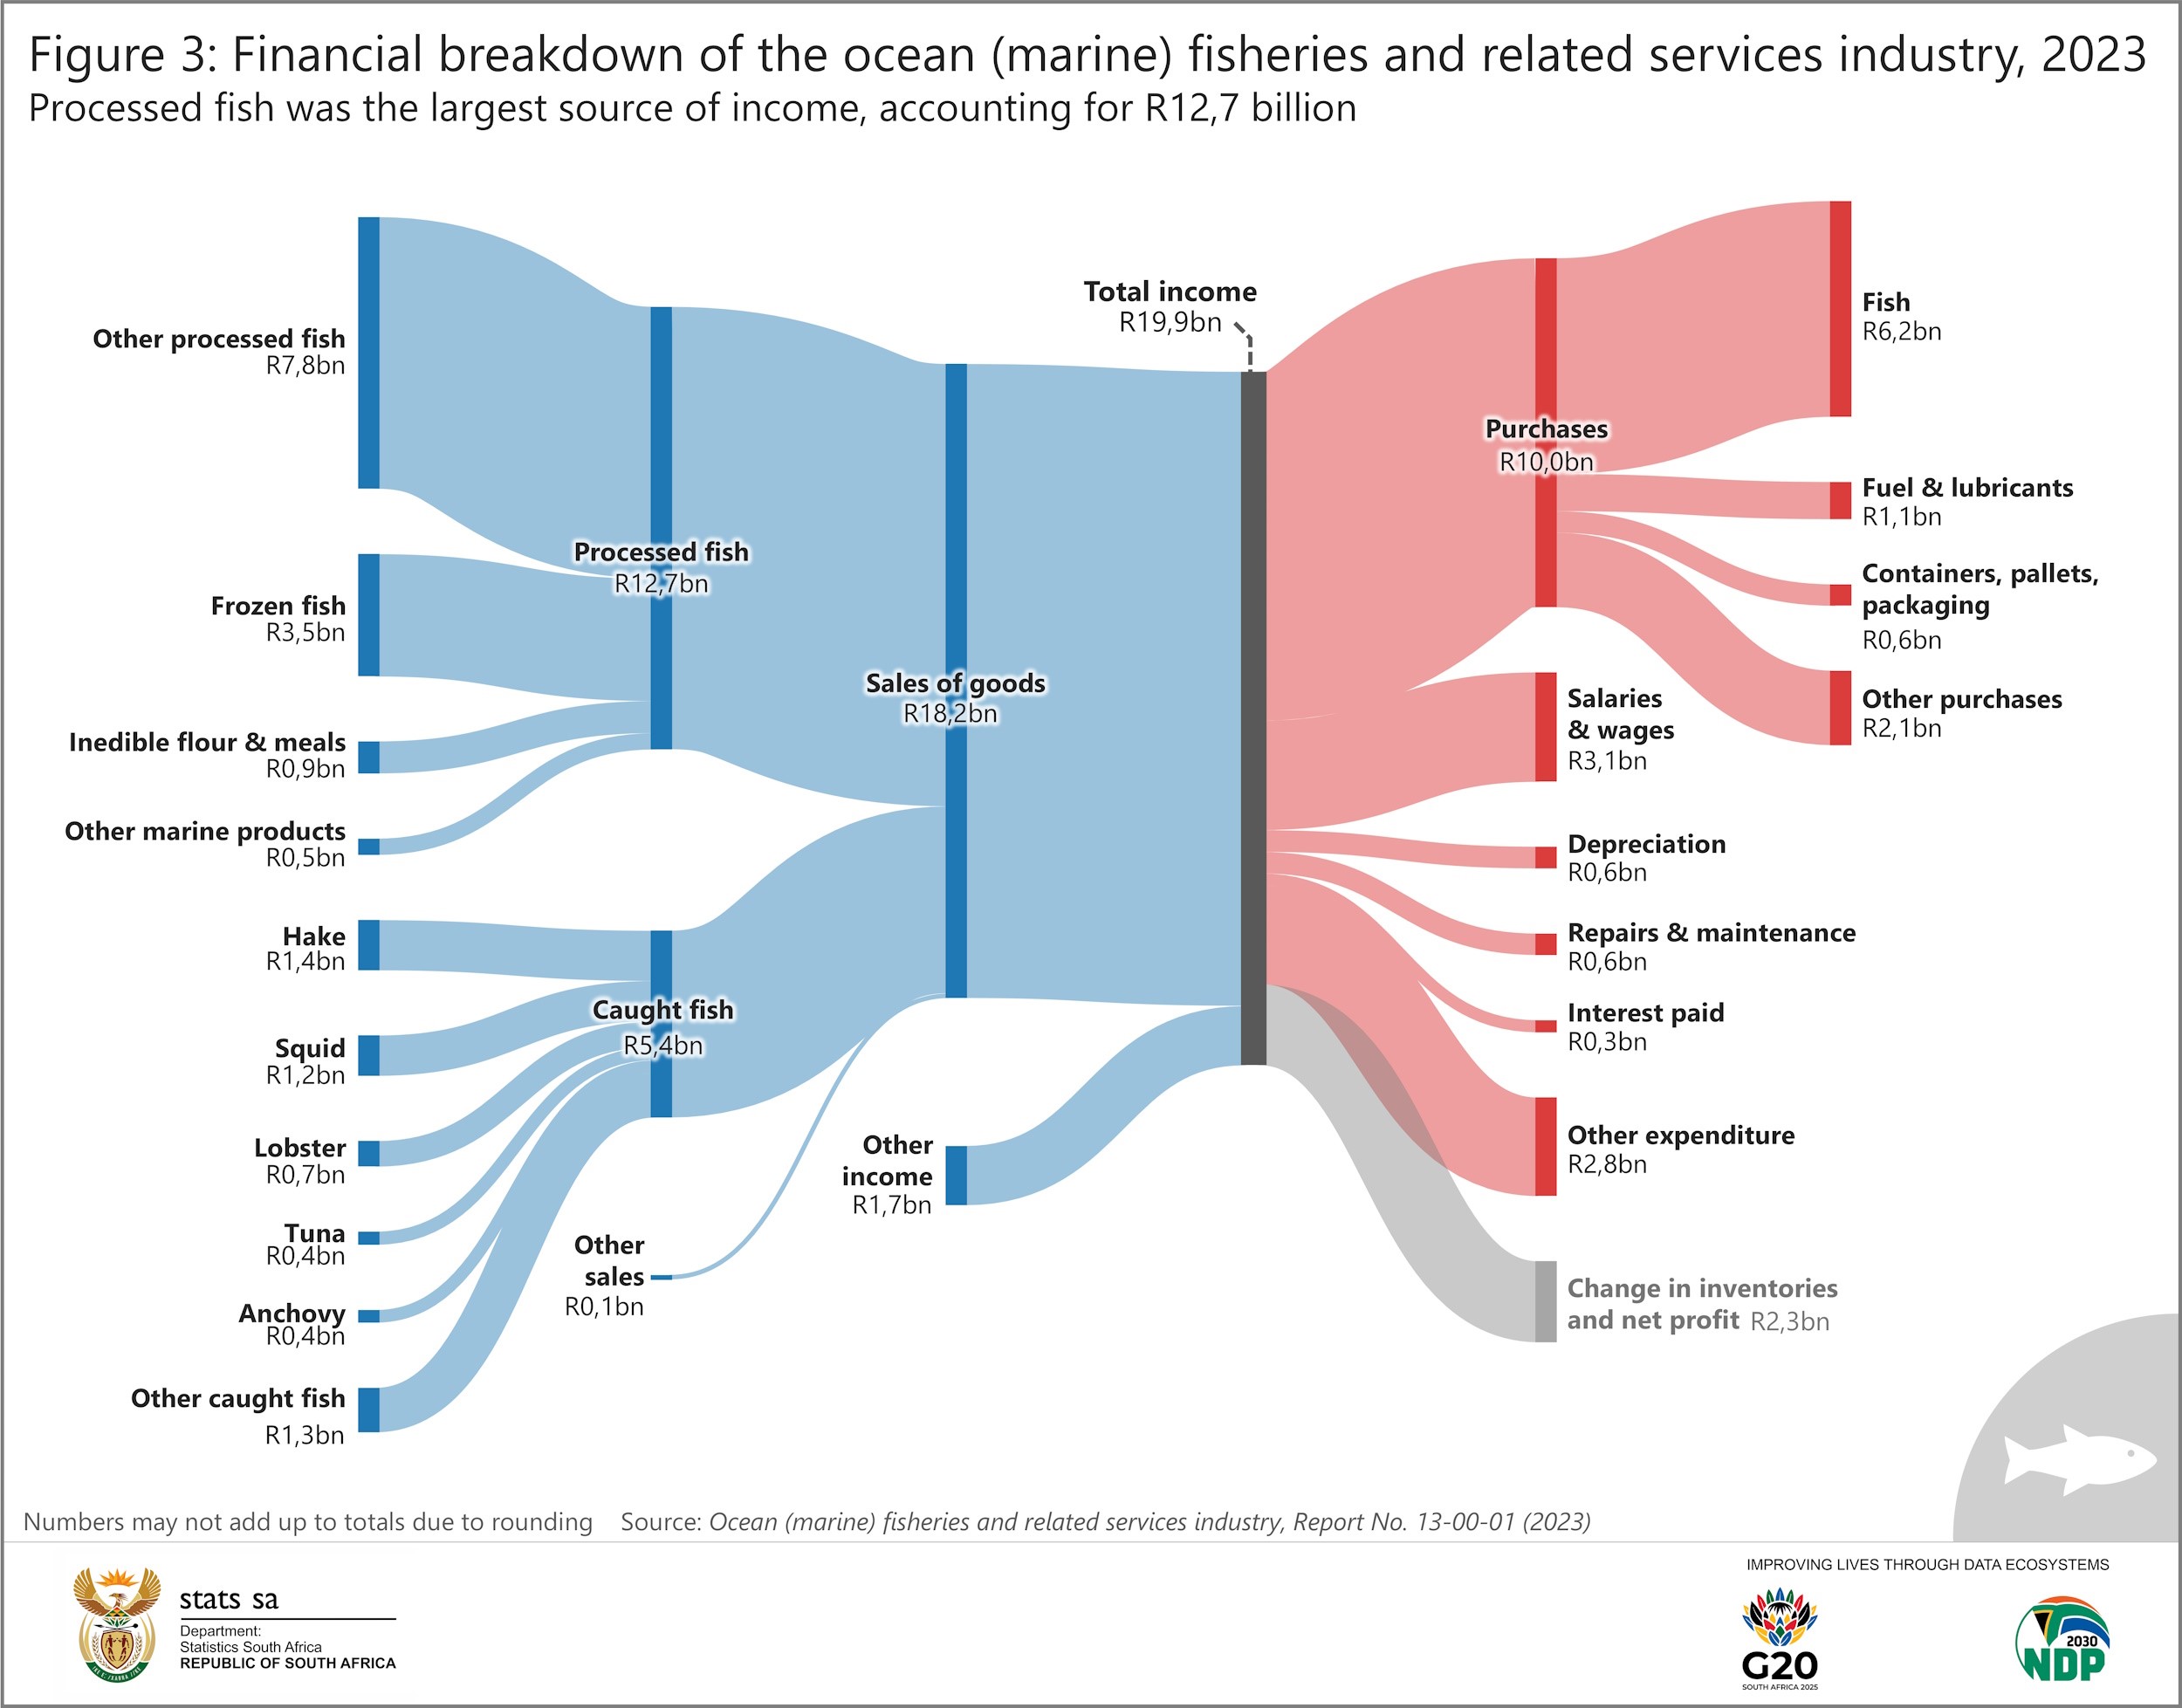
The industry generated R19,9 billion in total. This makes it the smallest of 16 industries surveyed by Stats SA in a series of detailed, industry-specific reports. To provide some context, manufacturing – the biggest of the 16 – is 132 times larger if income is used as a measure.
Despite its small size, the ocean (marine) fisheries and related services industry is a vital source of food. It employs just over 16 000 individuals and contributes to the economic well-being of fishing communities. The 2025 sardine rush may be over, but the role the industry plays remains firmly anchored in the economy.
For more information, download the 2023 Ocean (marine) fisheries and related services industry report and associated Excel data here.
1 The Citizen, Amanzimtoti Main Beach opens for swimming [17 July 2025] (read here).
2 The ocean (marine) fisheries and related services industry survey sourced data from enterprises registered for value-added tax (VAT). The scope of the survey includes ocean and coastal fishing but excludes fish hatcheries and fish farms.
3 Shannon L, Waller L. 2021. A Cursory Look at the Fishmeal/Oil Industry From an Ecosystem Perspective. Frontiers in Ecology and Evolution. Volume 9 (read here).
4 May 2025 Consumer Price Index (CPI) (COICOP 2018 – 8-digit) Excel dataset (download here).
Similar articles are available on the Stats SA website and can be accessed here.
For a monthly overview of economic indicators and infographics, catch the latest edition of the Stats Biz newsletter here.