

Stats SA started the year with 20 new releases. Key economic outputs include the conclusion of consumer inflation data for 2024, the release of a new consumer inflation basket and weights, and the much-anticipated release of the Income and Expenditure Survey (IES) report.
Inflation heats up to 3,0%
Consumer inflation increased for a second straight month, rising to 3,0% in December from 2,9% in November and 2,8% in October. Inflation for food & non-alcoholic beverages edged higher. Vegetables; oils & fats; fruit; hot beverages; and sugar, sweets & desserts recorded an increase in their annual rates in December. The rates for bread & cereals and milk, eggs & cheese remained stable. Meat, cold beverages and fish recorded declines.
Vehicle inflation continued a downward trajectory, with the rate for used vehicles entering its second consecutive month of deflation. Used vehicles are on average 0,6% cheaper than a year ago.
The December Consumer Price Index (CPI) release concludes the results for 2024. Average inflation in 2024 was the lowest in four years since the pandemic in 2020. The average rate was 4,4%, down from 6,0% in 2023 and 6,9% in 2022.
A new basket of goods and services
Keeping with inflation, Stats SA updated the basket that is used in the calculation of the headline rate. Updates are done periodically to keep in line with current consumer behaviour. The reshuffle sees 71 new products entering the basket, 53 leaving the basket, and the reorganisation (merging and splitting) of 29 products.
Current consumer trends are reflected. Air fryers, e-hailing services, refills for e-cigarettes, physiotherapists, streaming services and toy building bricks (which includes LEGO) are included in the new basket. Load shedding may have also had an impact with the inclusion of power banks, gas in cylinders and candles.
Notable products leaving the basket include graters, sandwich makers, wax shoe polish, postbox rental, TV decoders, magazines and music CDs.
The biggest spenders live in Cape Town and Tshwane
The IES is the main source of data that determines the structure of the new inflation basket. The latest IES release, for the year 2022/23, provides a detailed breakdown of income and spending across South Africa.
Households in Cape Town spent the most, with a median expenditure of R140 523. The City of Tshwane was second, with a median of R123 176. Of the eight metropolitan municipalities, Buffalo City recorded the lowest median expenditure of R75 283.
Retail trade records a notable jump in activity
Turning attention to the most recent consumer spending data, retail trade sales rose by a notable 7,7% in the 12 months to November 2024. The momentum was mainly driven by general dealers, expanding by 11,9%. Consumers also increased their spending at retailers specialising in textiles & clothing; household goods; food & beverages; and pharmaceuticals, medical goods & cosmetics. The miscellaneous group referred to as all ‘other’ retailers – which includes online stores and retailers in jewellery, stationery and sports goods – also witnessed a positive month.
Hardware, paint & glass was the lone exception, declining by 4,3% year-on-year.
Other sectors that recorded stronger year-on-year figures in November include electricity; tourist accommodation; restaurants, catering & fast-food; and rail passenger transport (Figure 1).
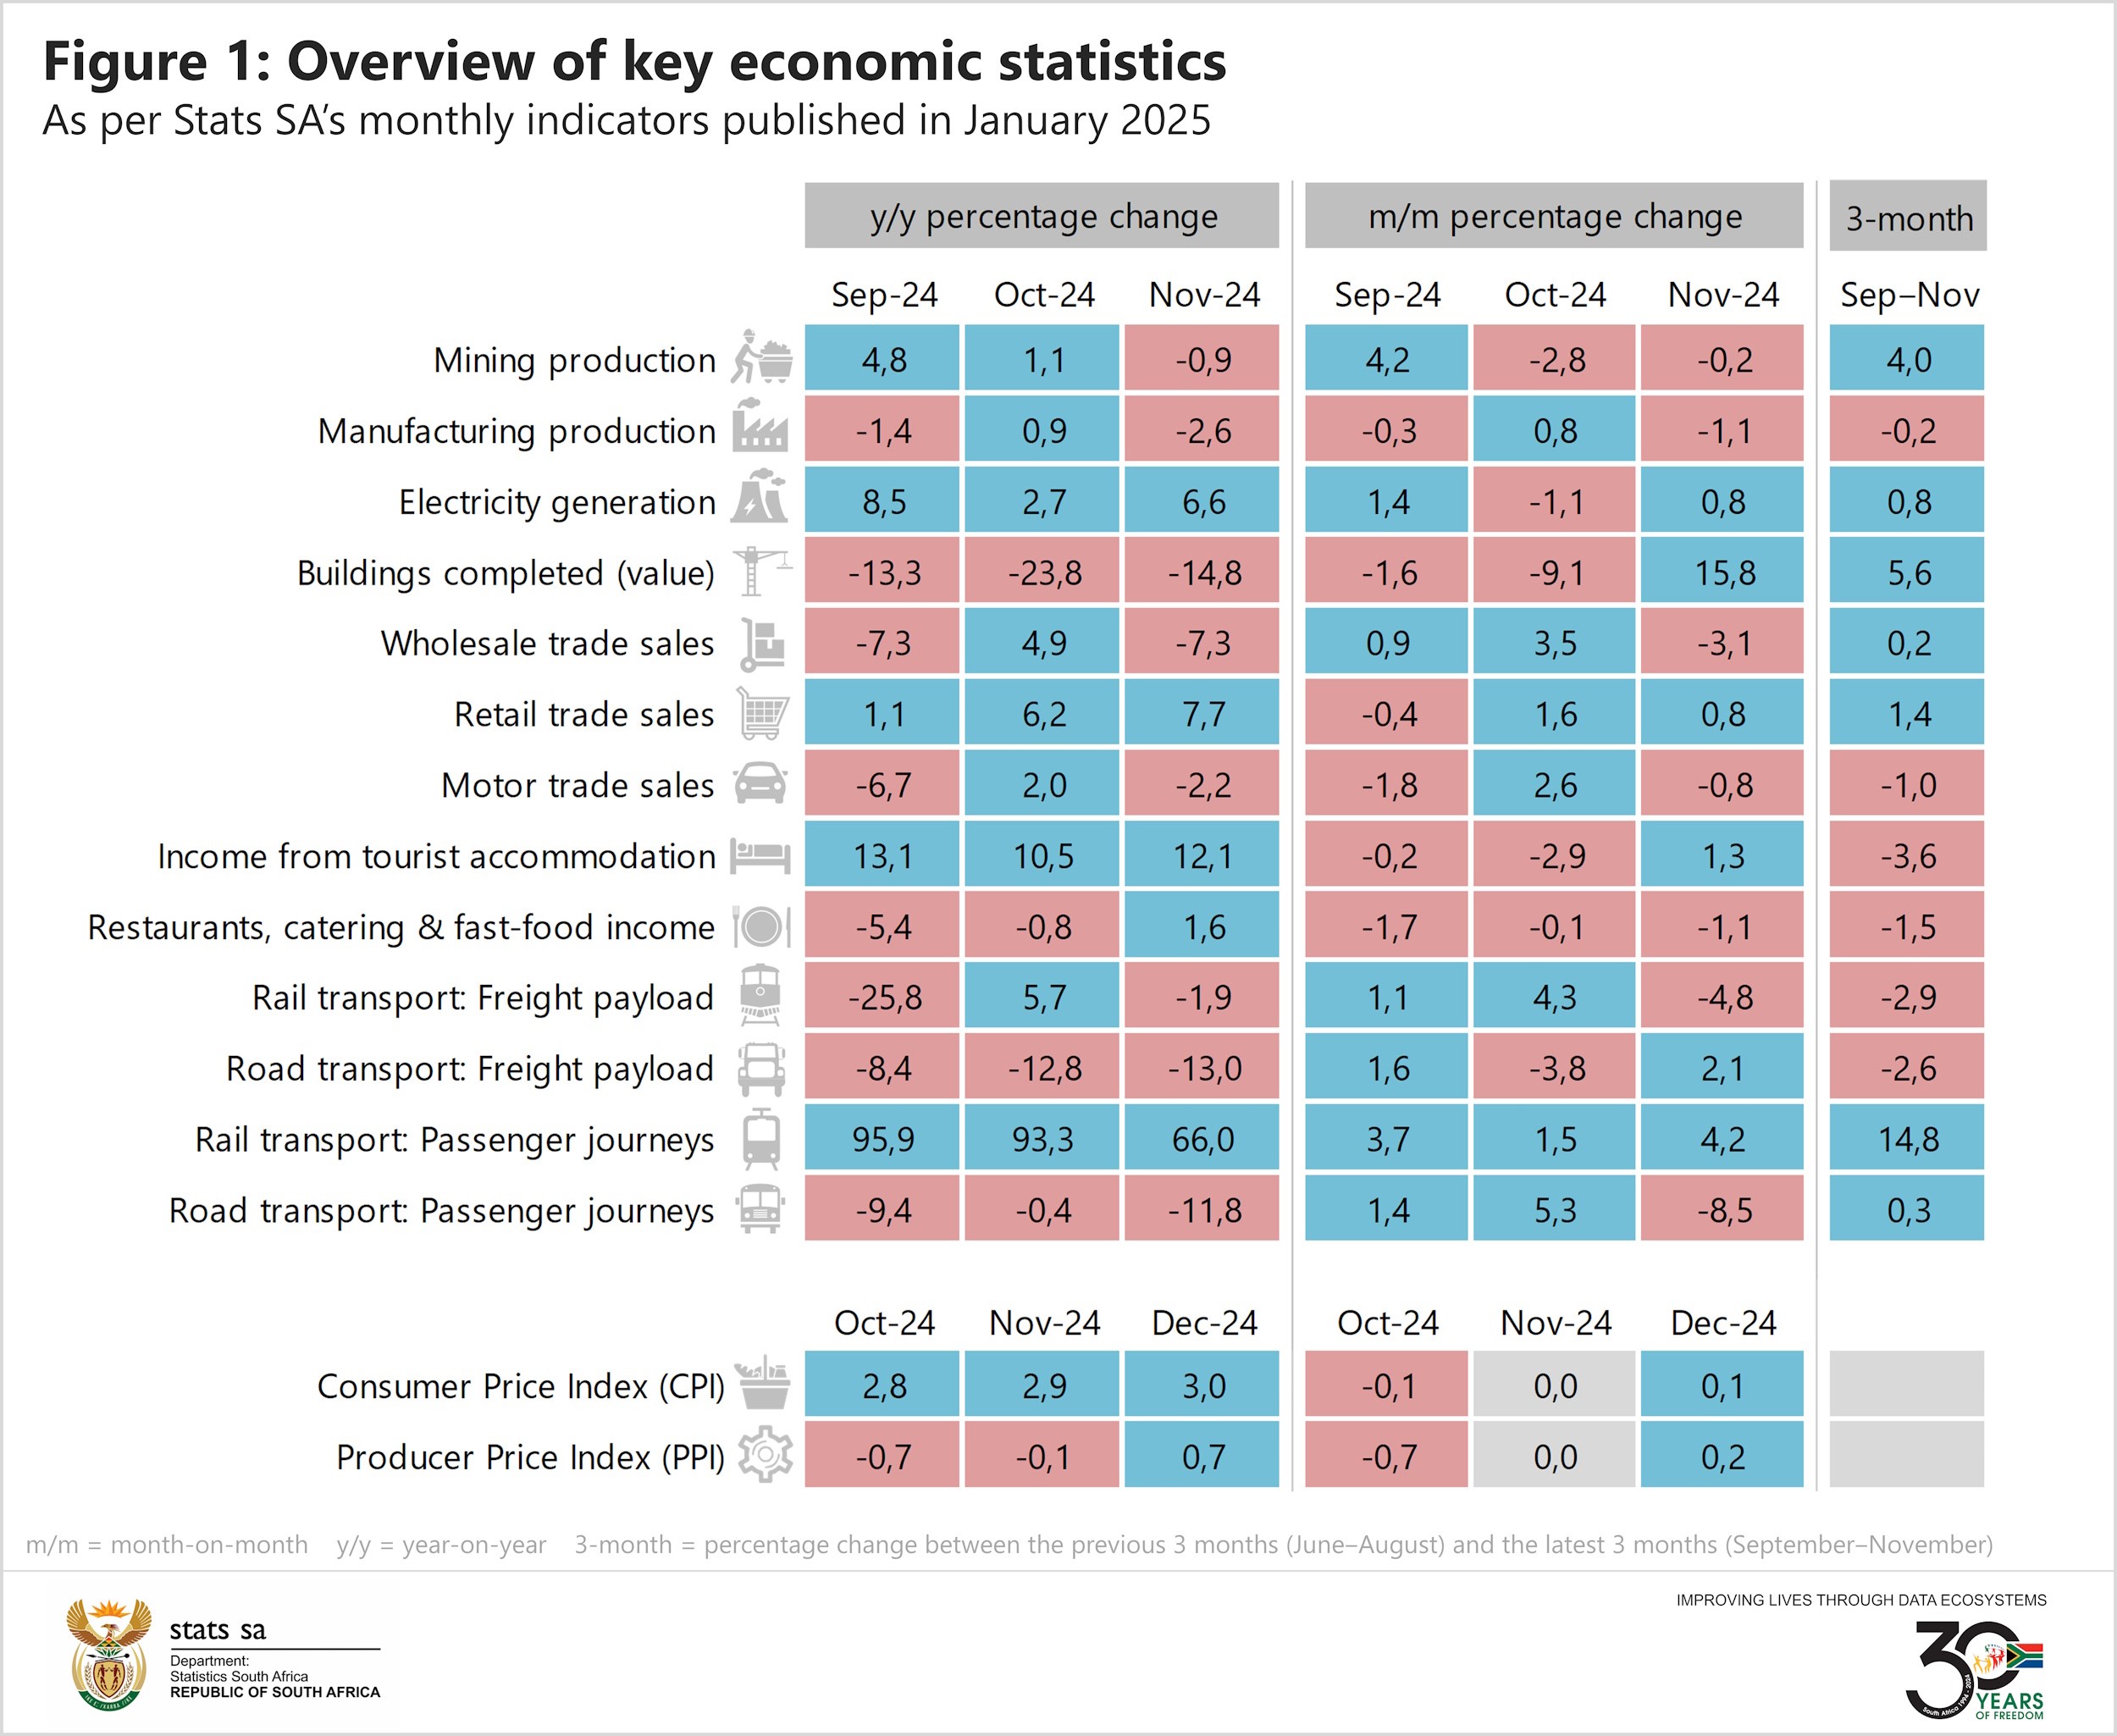
Sectors that were weaker on a year-on-year basis include mining, manufacturing, construction (buildings completed as reported by large municipalities), wholesale trade, motor trade, rail transport (freight) and road transport (both passenger and freight).
What to look forward to in February
Notable releases scheduled in the month include the latest manufacturing utilisation data that will be published on 06 February and the next set of employment and unemployment figures that will be released on 18 February.
Interested to know more? Keep up to date with our publication schedule here. For a comprehensive list of products and releases, download our catalogue here. For a regular update of indicators and infographics, visit our data story feed and download the latest edition of the Stats Biz newsletter.