
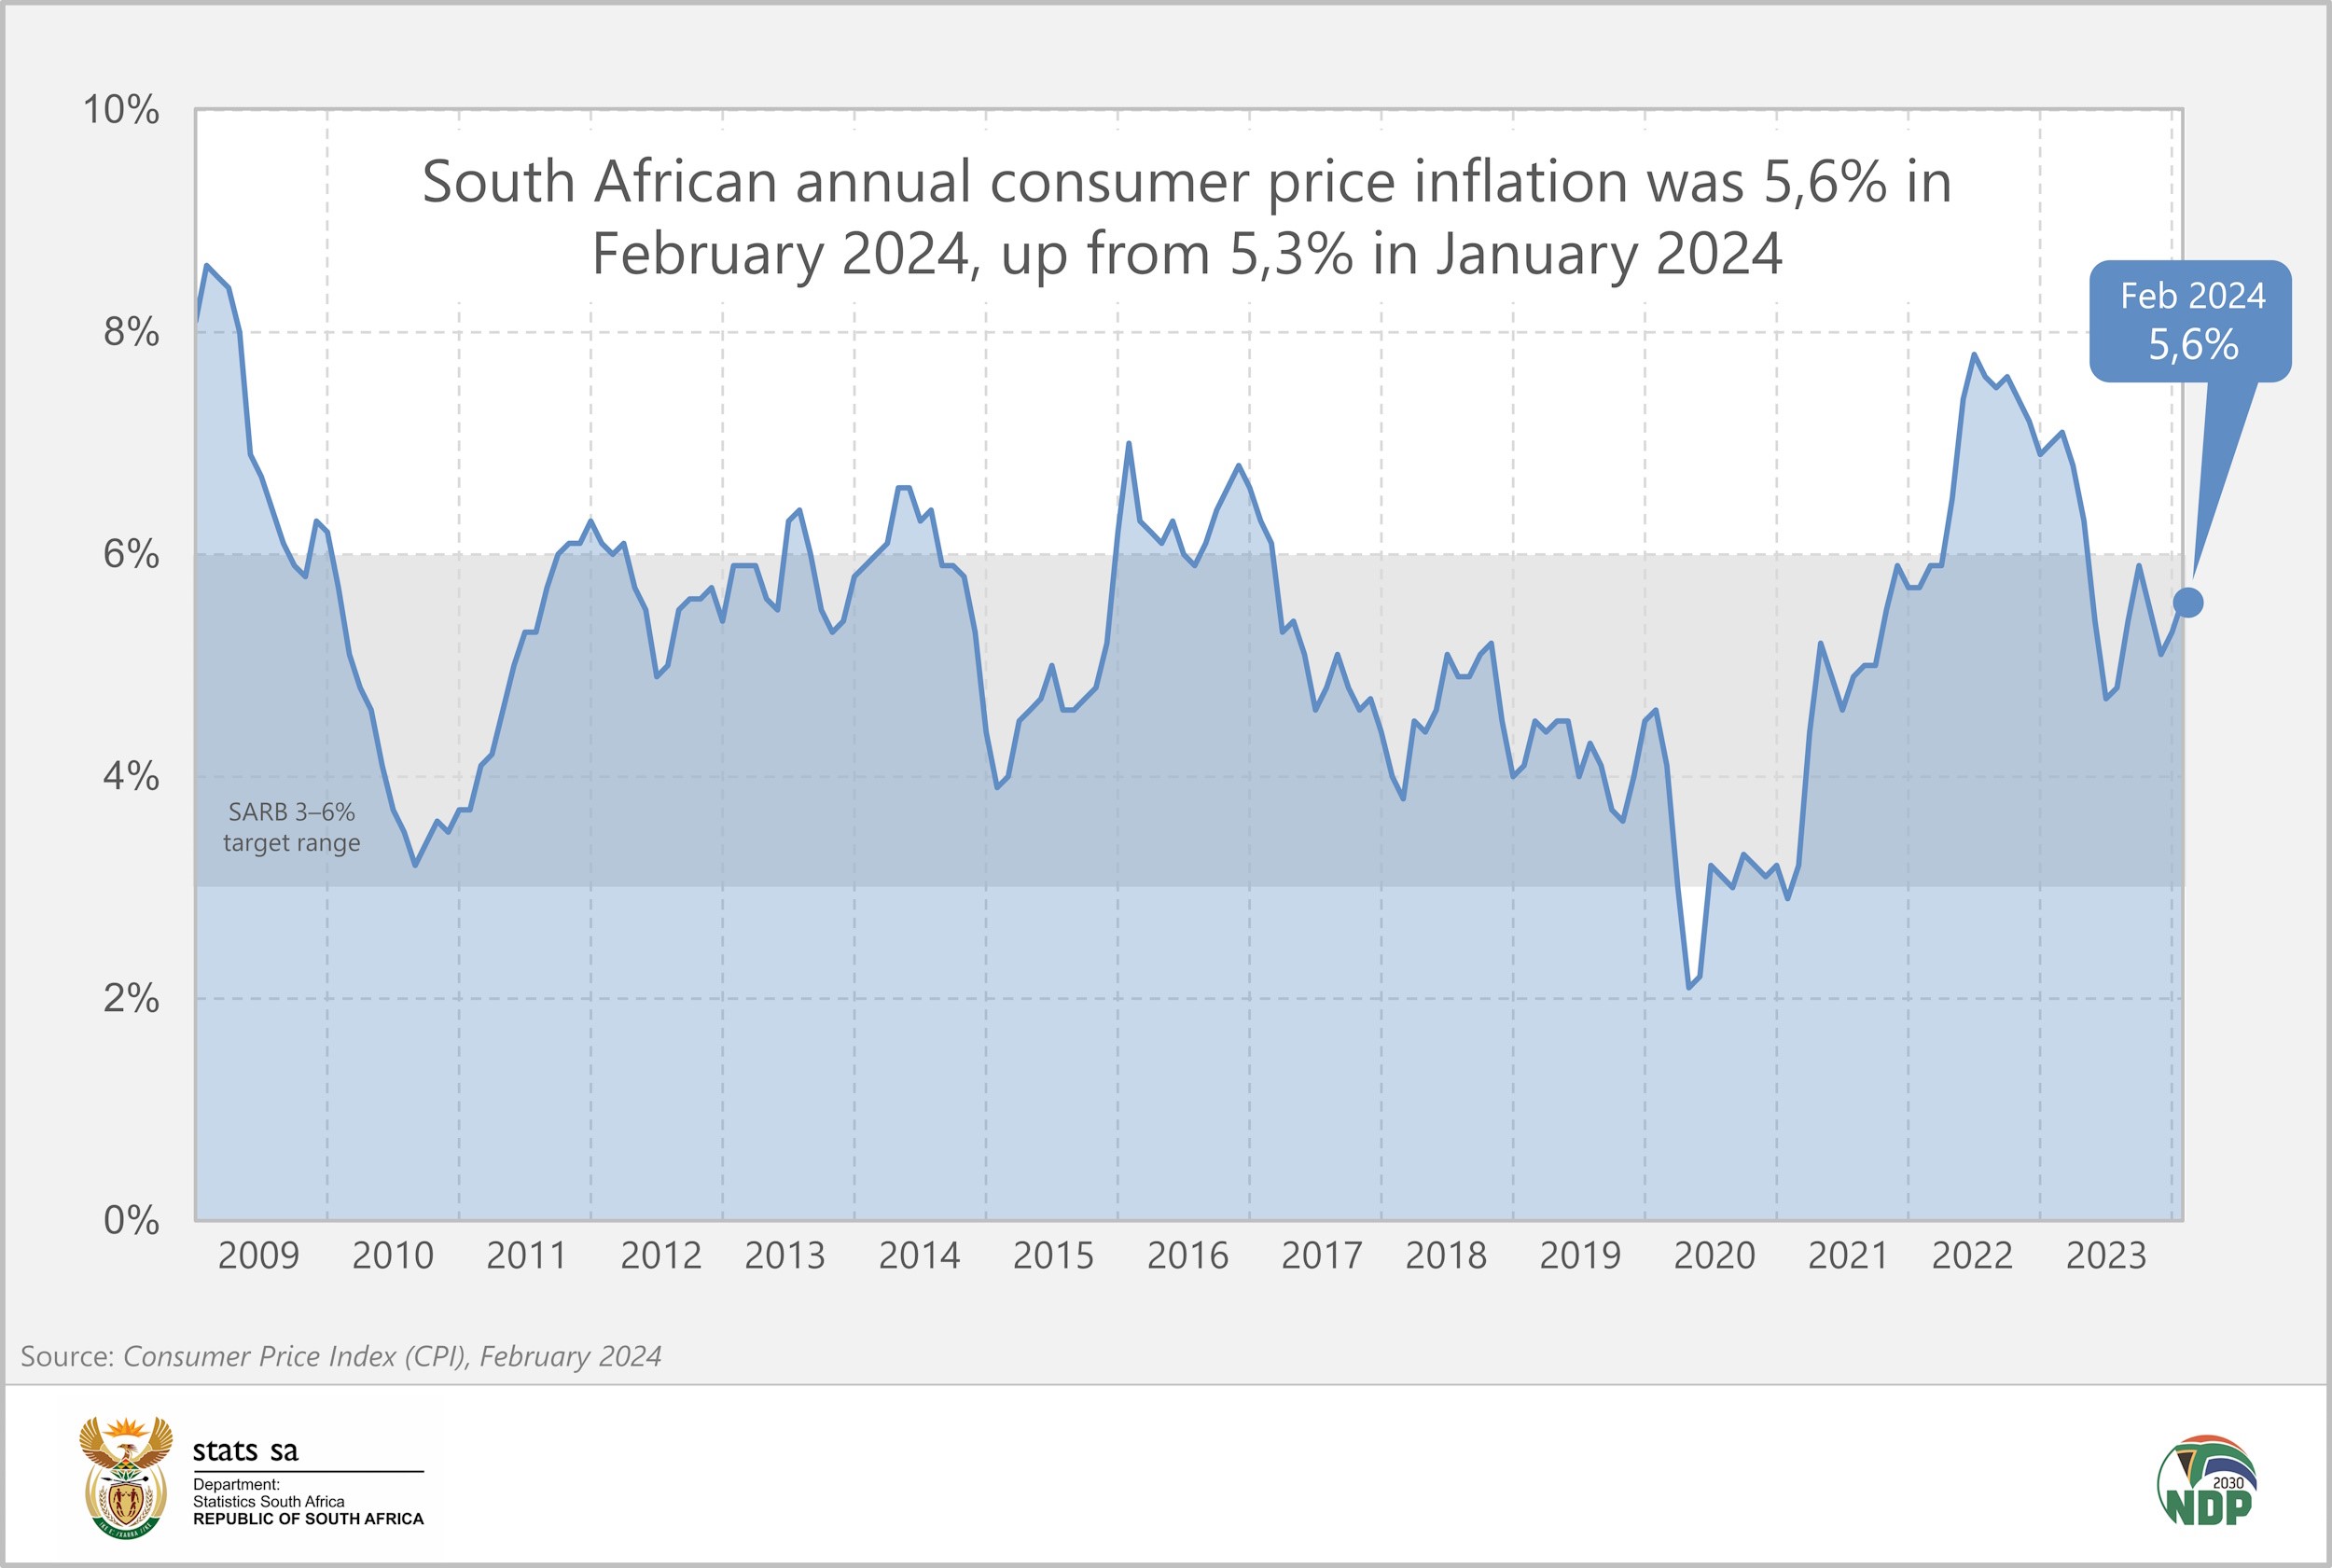
Inflation heats up for a second consecutive month
Annual consumer inflation quickened in February, rising to 5,6% from 5,3% in January and 5,1% in December. Product categories that drove much of the upward momentum include housing & utilities, miscellaneous goods & services (most notably, insurance), food and non-alcoholic beverages (NAB) and transport.
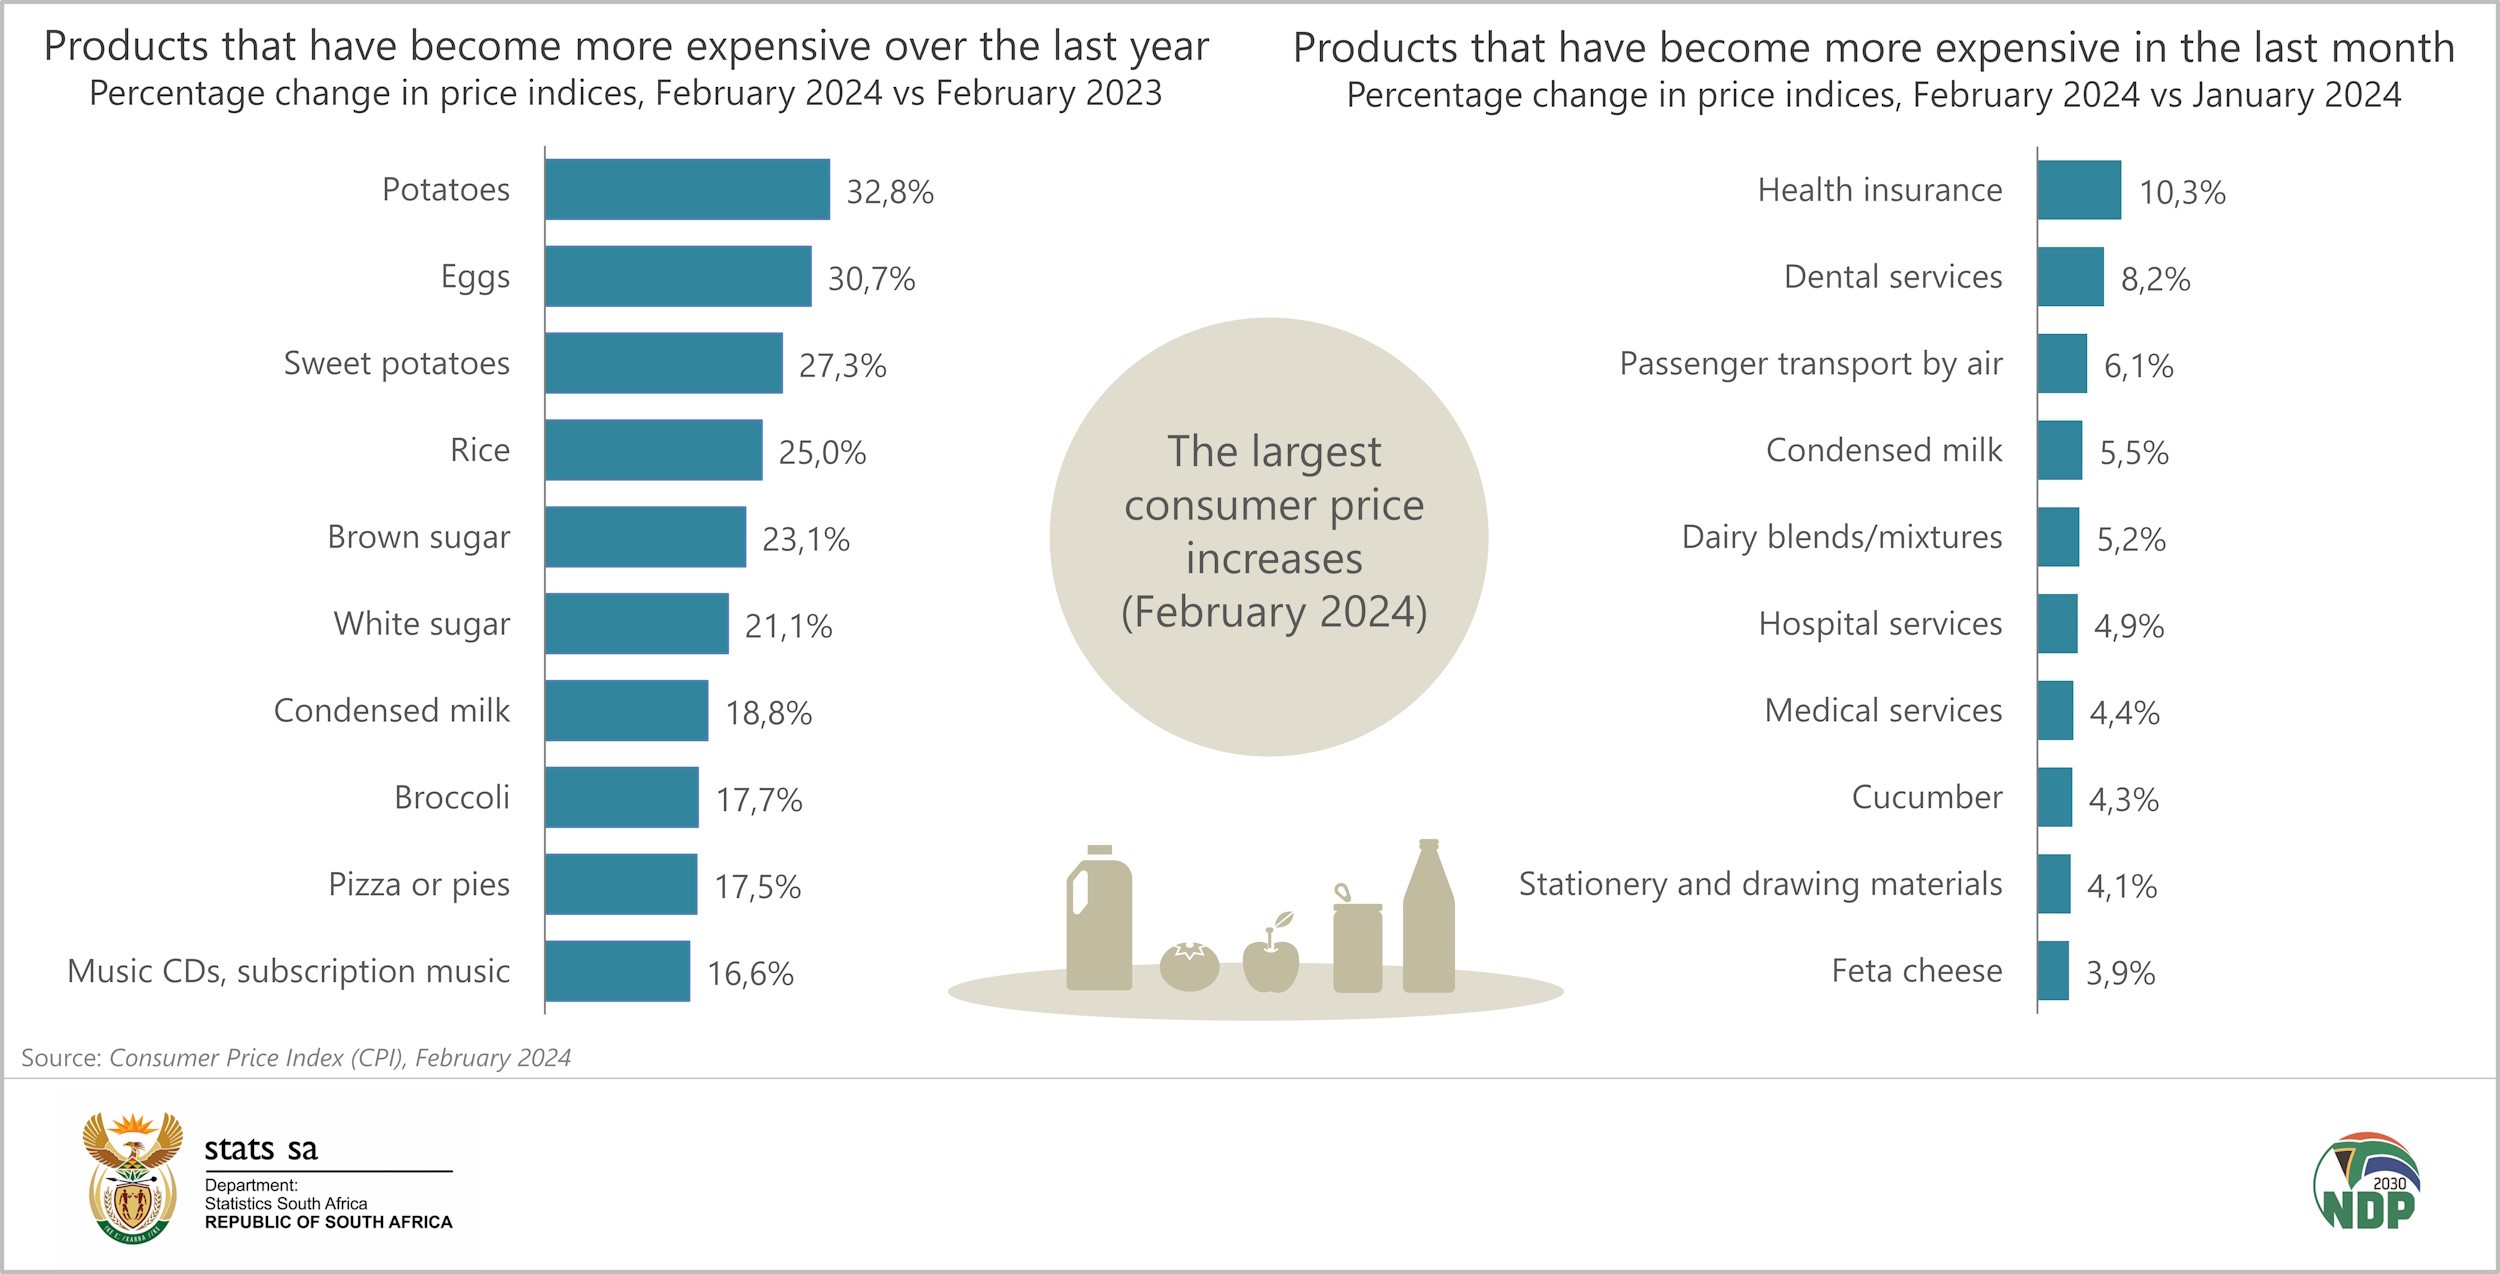
A 10,3% month-on-month increase in medical aid premiums (in the miscellaneous goods & services category) took the annual rate for health insurance to 12,9%. Premiums for all types of insurance have increased by 9,5% over the past year.
Inflation for food & NAB slowed to 6,1% in February. Most categories recorded lower annual rates, except for hot beverages and oils & fats. The rate for hot beverages was driven higher by annual price increases for instant coffee (up 12,1%), black tea (up 10,1%) and Rooibos tea (up 8,1%).
The rate for oils & fats remained in negative territory, mainly due to a 12,9% annual decline in the price of sunflower oil. However, the fall in prices did not extend to peanut butter, which has increased in price by 14,0% since February 2023.
The lingering impact of rising egg prices continue to affect the milk, eggs & cheese category, with eggs 30,7% more expensive than a year ago. Although the current average price of a tray of six eggs (R25,48) is down from its peak in December 2023 (R25,85), it is higher than the February 2023 price tag (R21,13).
Annual rice inflation increased further to 25,0% in February from 23,8% in January. A bag of rice (1 kg) would have set you back R31,83 in February, sharply up from R23,54 a year ago. Pizza & pies – also classified with rice in the bread & cereals category – have seen sharp price increases too, rising by 17,5% in the 12 months to February.
Not all was bad news in the bread & cereals category, however. Several products are cheaper than a year ago, including bread flour (down 5,7%), rusks (down 2,7%), ready-mix flour (down 2,2%), pasta (down 2,1%) and macaroni (down 0,5%).
The transport category registered an annual increase of 5,4%, driven higher mainly by increases in vehicle and fuel prices.
The graphs below show the products that recorded the most significant annual and monthly price increases in February. Prices for health insurance, as well as for private-sector medical practitioners and hospitals, are surveyed once year in February.1
Download the February 2024 CPI statistical release and Excel files with indices and average prices here. The archive is available here.
1 See Table F in the statistical release for the complete survey schedule.
Similar articles are available on the Stats SA website and can be accessed here.
For a monthly overview of economic indicators and infographics, catch the latest edition of the Stats Biz newsletter here.