

The SESE is a household-based sample survey conducted every four years. The survey collects detailed information about non-VAT registered businesses, most of which are in the informal sector.
Highlights
Table 1: Individuals running informal businesses, 2001–2013
|
2001 |
2005* |
2009 |
2013 |
2001 |
2005 |
2009 |
2013 |
|
|
Thousand |
Per cent |
|||||||
| By sex |
2 258 |
1 668 |
1 144 |
1 517 |
100,0 |
100,0 |
100,0 |
100,0 |
| Women |
1 370 |
925 |
557 |
677 |
60,7 |
55,5 |
48,7 |
44,6 |
| Men |
888 |
743 |
587 |
840 |
39,3 |
44,5 |
51,3 |
55,4 |
| By number of business |
2 258 |
1 668 |
1 144 |
1 517 |
100,0 |
100,0 |
100,0 |
100,0 |
| 1 business |
2 217 |
1 610 |
1 125 |
1 490 |
98,2 |
96,5 |
98,3 |
98,3 |
| 2 businesses |
38 |
56 |
7 |
26 |
1,7 |
3,4 |
0,6 |
1,7 |
| 3 businesses |
3 |
1 |
12 |
– |
0,1 |
0,1 |
1,0 |
0,0 |
| Start of business operations |
2 258 |
1 668 |
1 144 |
1 517 |
100,0 |
100,0 |
100,0 |
100,0 |
| Less than a year ago |
559 |
299 |
244 |
308 |
24,8 |
17,9 |
21,3 |
20,3 |
| 1 but less than 3 years ago |
749 |
560 |
290 |
358 |
33,2 |
33,6 |
25,3 |
23,6 |
| 3 but less than 5 years ago |
403 |
352 |
187 |
268 |
17,8 |
21,1 |
16,3 |
17,7 |
| 5 but less than 10 years ago |
288 |
249 |
214 |
278 |
12,8 |
14,9 |
18,7 |
18,3 |
| 10 or more years ago |
249 |
207 |
208 |
298 |
11,0 |
12,4 |
18,2 |
19,6 |
| Don’t know |
9 |
2 |
1 |
6 |
0,4 |
0,1 |
0,1 |
0,4 |
* The 2005 SESE estimates have not yet been adjusted to reflect the new population benchmarks.
In 2001 as many as 2,3 million people were running informal businesses. The number decreased to 1,5 million in 2013. And over 95% of the owners of such businesses had only one business. Informal businesses are predominantly run by black Africans, persons aged 35–44 years, and those with the lowest levels of education.
Figure 1: Financial record-keeping by persons running informal businesses, 2013
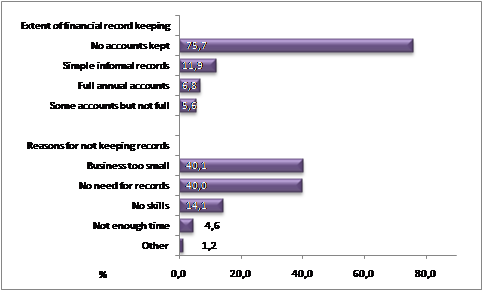
Figure 2: Education profile of persons running informal businesses, 2013
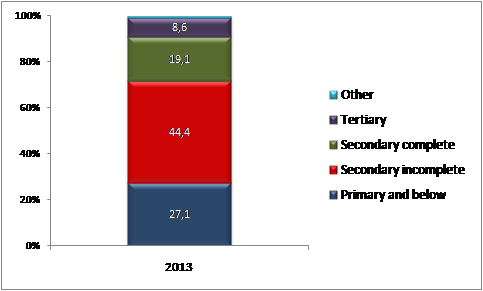
In 2013, most people running informal businesses did not keep financial records for their business and this is likely to be associated with their education profile which indicates that as many as 71,5% had an education level lower than matric (Figure 1 and Figure 2).
In 2013, the proportion of the working-age population running informal businesses was highest in Limpopo (6,3%), Mpumalanga (6,1%), Gauteng (5,0%) and KwaZulu-Natal (4,7%). And as many as 25,3% of such businesses were run from the owner’s dwelling in a separate space and an additional 21,3% were also run from the owner’s dwelling but in the family space. As many as 28,3% of people running informal businesses had no electricity at their business; 33,2% only had a pit latrine while as many as 8,0% had no toilet facilities available for their business. This suggests that many are survivalist in nature.
The main reason why people started informal businesses was due to unemployment. This was reported by 60,6% of persons in 2001 and by 69,2% in 2013. In every province, except Gauteng and Northern Cape, over the period 2001 to 2013 and reflecting the effects of the global recession – there was an increase in the proportion of people who stated unemployment as the main reason for starting informal businesses. Most businesses were in the Trade industry – ranging from 1,6 million (69,6%) in 2001 to 0,8 million (54,4%) in 2013.
Figure 3: Source of money to start informal businesses, 2001-2013
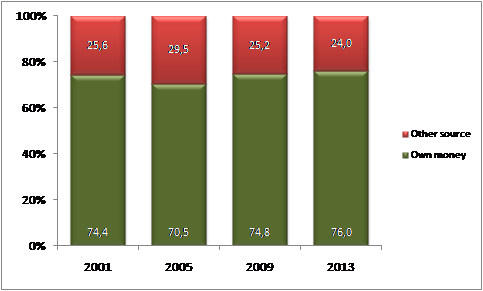
Figure 4: Source of borrowed funds for starting informal businesses, 2001- 2013
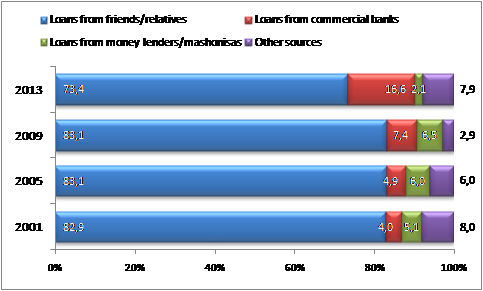
The vast majority of people who started informal businesses used their own money to do so (over 70,0%). Among those who did not use their own money, most borrowed from friends and relatives. The proportion that did so declined from 82,9% in 2001 to 73,4% in 2013 but this was accompanied by an increase in the proportion who were able to get loans from commercial banks over the same period from 4,0% to 16,6% (Figure 4). As many as 79,1% of persons running informal businesses did not have a bank account for their business. And over 90% had no credit facilities, no asset finance or mortgage loans for their business operations.
Figure 5: Type of assistance needed by informal businesses, 2001 and 2013
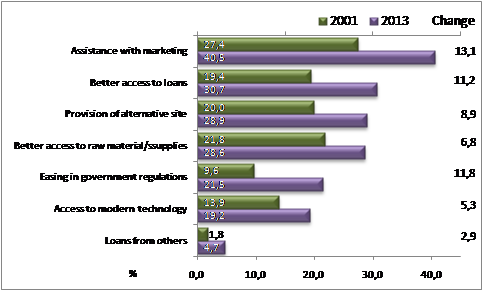
Figure 6: Turnover and net profits of informal businesses, 2001 and 2013
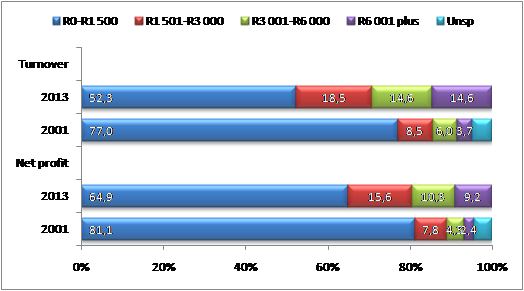
Assistance with marketing was the type of assistance most needed by people running informal businesses. The proportion needing this rose from 27,4% in 2001 to 40,5% in 2013. Turnover levels and profit margins are relatively small for most informal businesses. In 2013 as many as 52,3% had a turnover of R1 500 or below in the month prior to the survey and only 14,6% had sales above R6 000. Net profits for 64,9% of businesses were also low (at R1 500 or lower in the month prior to the survey) and only 9,2% of businesses made net profits above R6 000 (Figure 6).
For media enquiries contact:
Ms Kefiloe Masiteng
Deputy Director General: Population and Social Statistics, on (012) 310 2109
For technical enquiries contact:
Mr Peter Buwembo
Executive Manager: Labour Statistics, on (012) 310 8655