
Gender representation varies across the economy, with women more highly represented in some industries compared with others. But most interesting of all is that gender representation varies within industries.
Women currently occupy 44 of every 100 jobs in the South African workforce, according to the latest Quarterly Labour Force Survey (QLFS).1 The QLFS is the go-to source for data on an industry level, but to dig a bit deeper we turn to Stats SA’s series of structural industry surveys. These detailed statistical reports2 cover financial and employment data for the formal business sector; that is, for businesses that are registered for value-added tax (VAT).
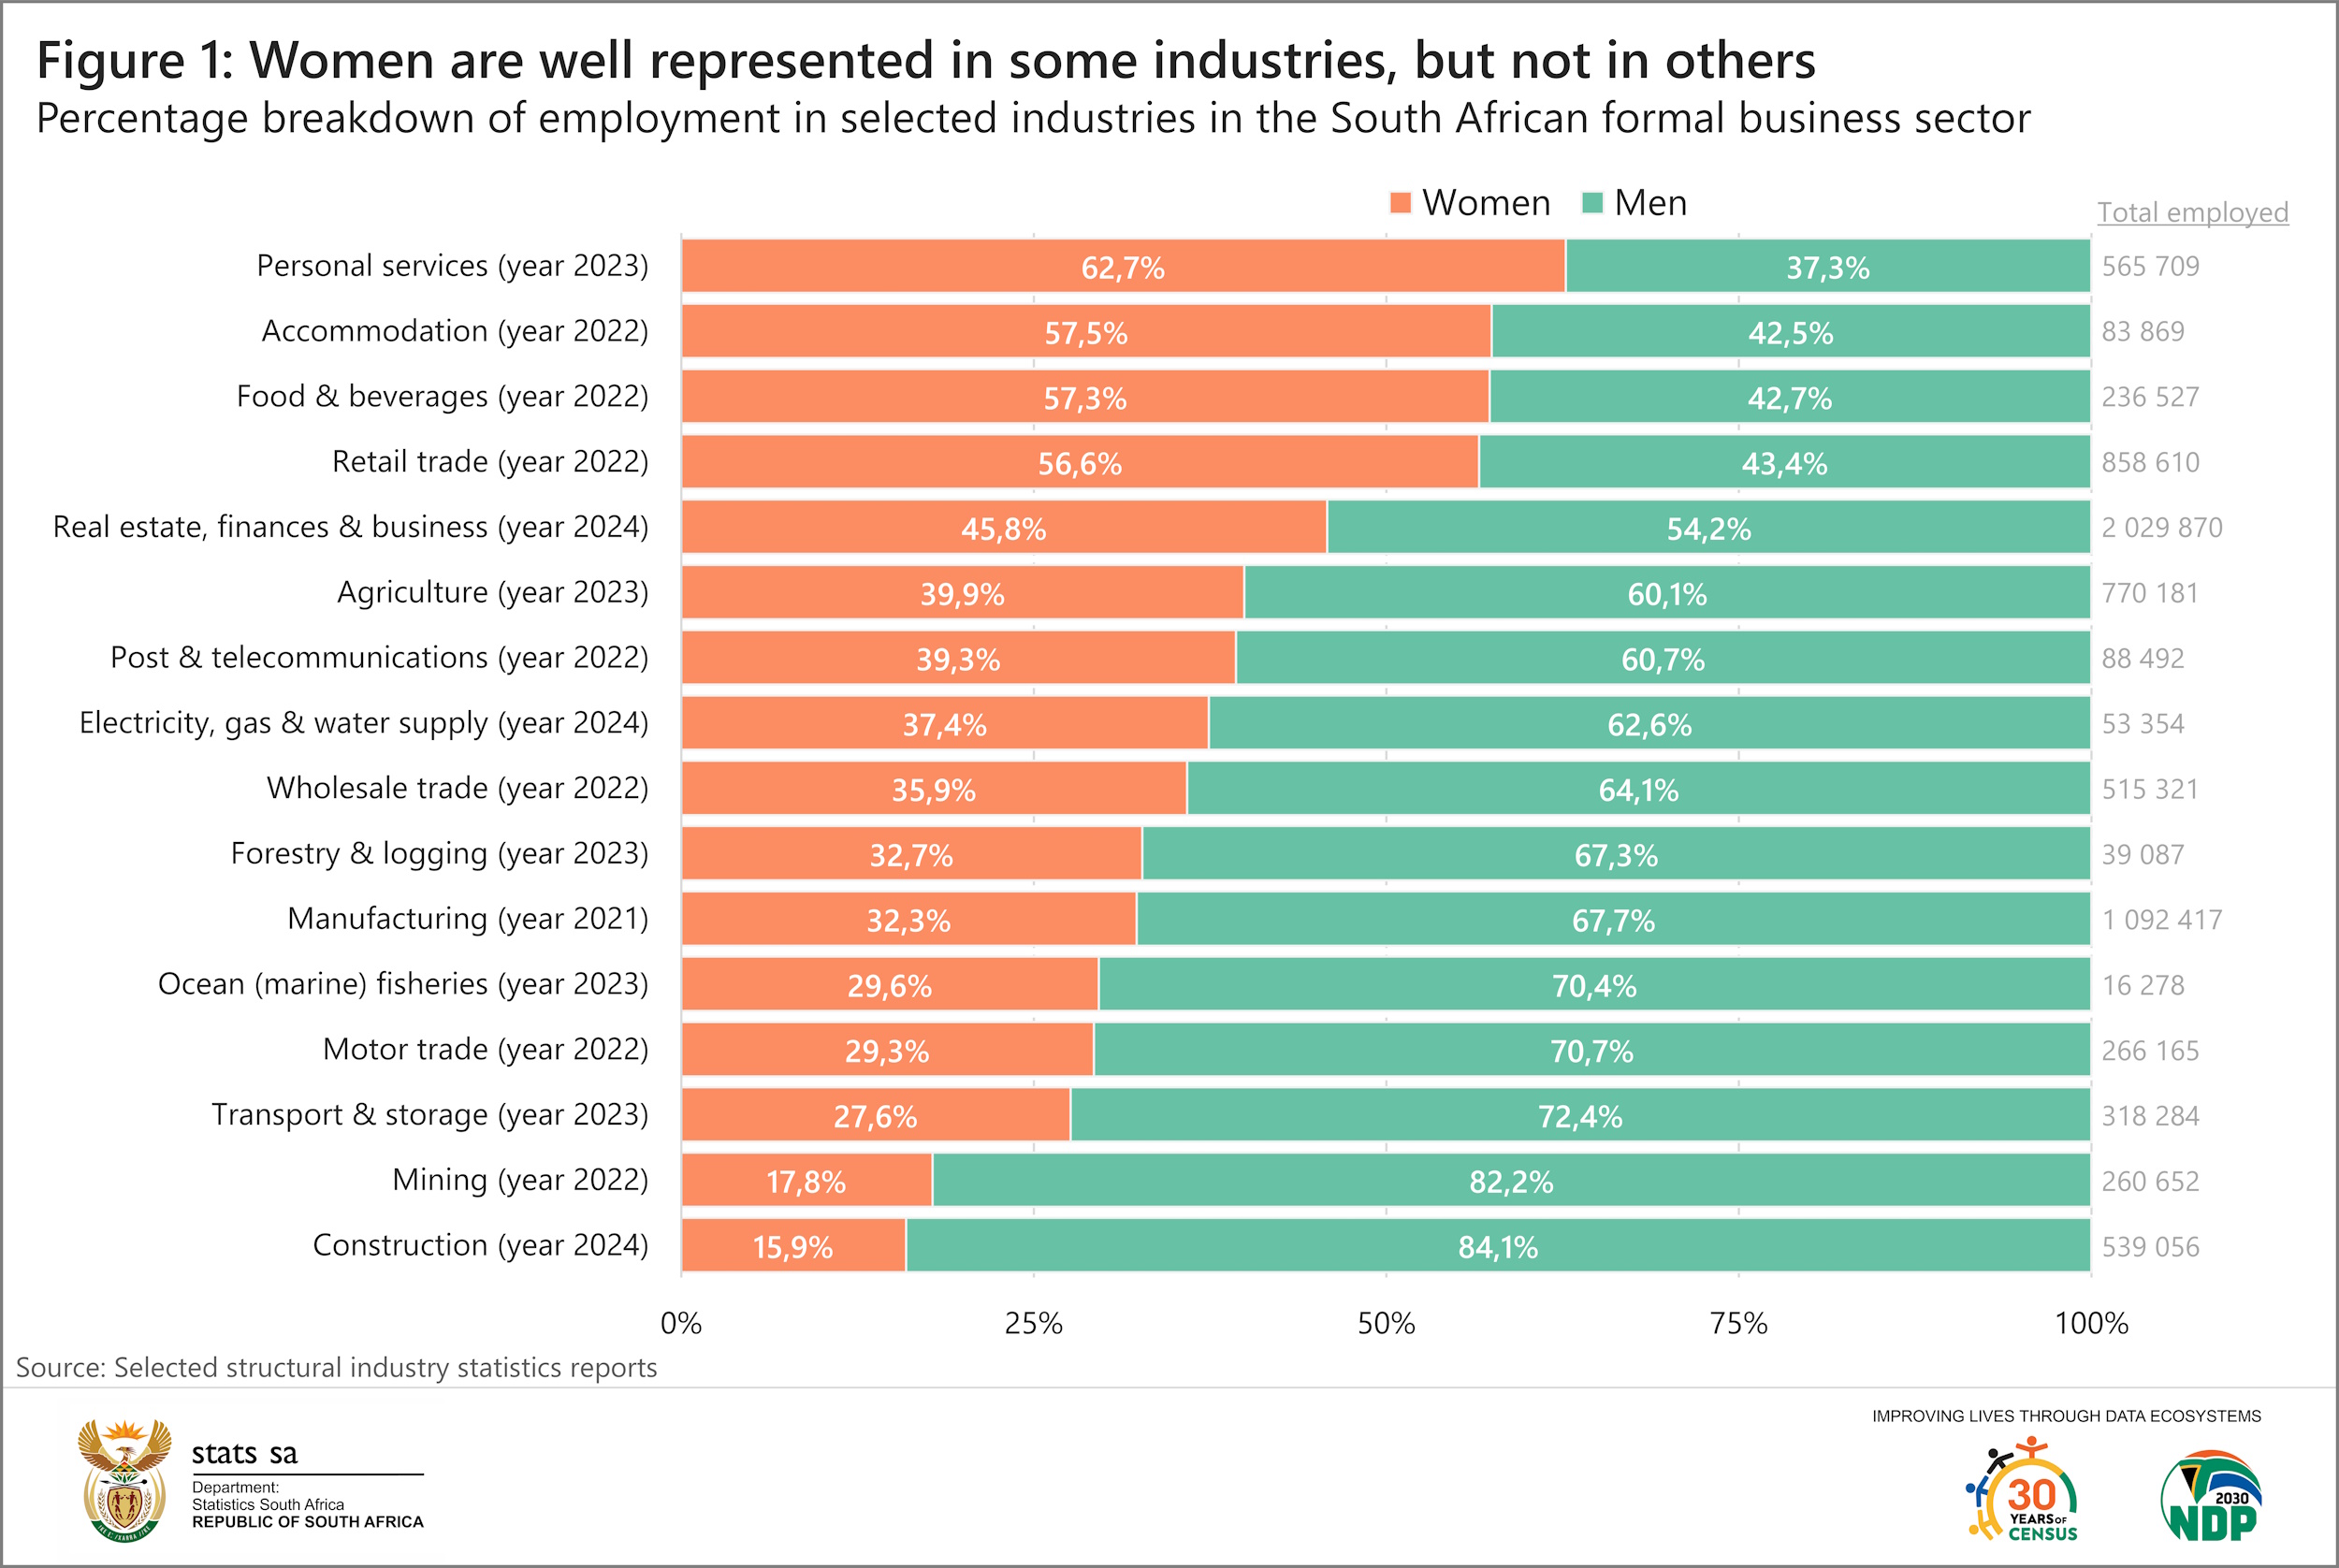
A bird’s-eye view shows that women account for more than half of employment in personal services, accommodation, food & beverages and retail trade. Female representation is the lowest in construction, mining,3 transport & storage and motor trade (see Figure 1 below).
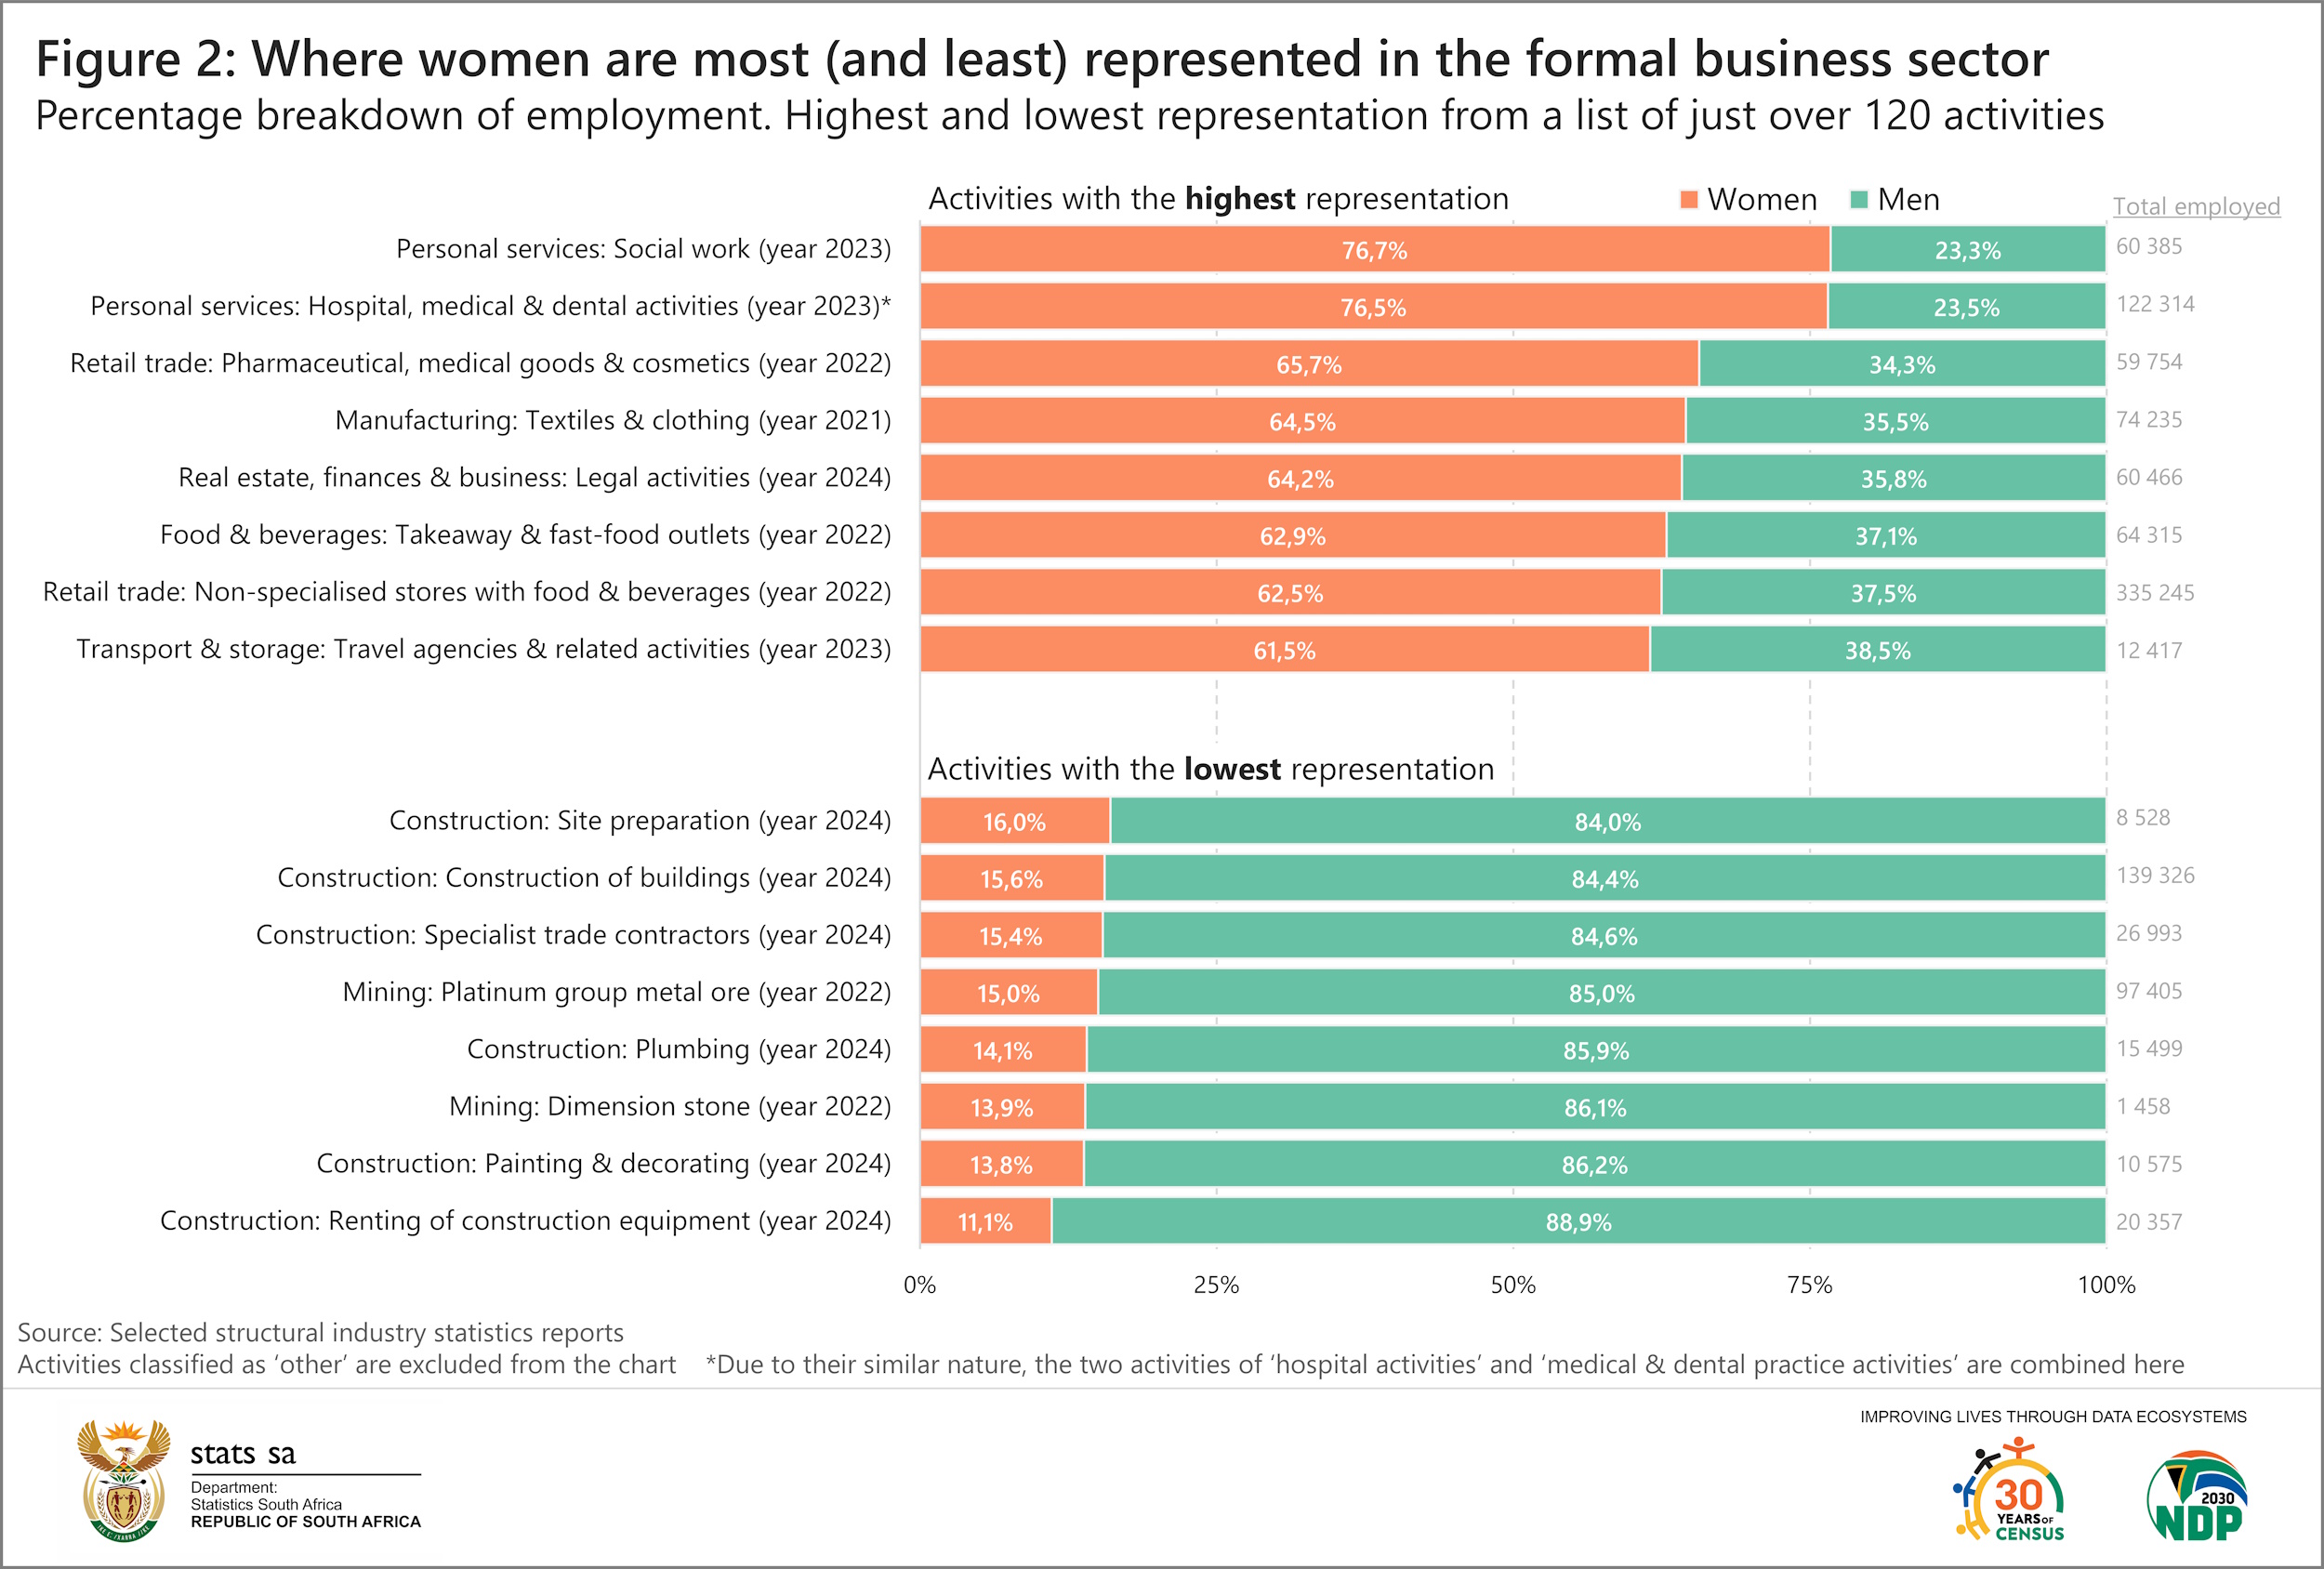
The key advantage of the structural industry data is that it allows us to tease apart and explore each industry in more detail. Data exist for 123 activities across 14 of the 16 industries listed above. Figure 2 below shows the activities with the highest and lowest levels of female representation. More than 70% of jobs in social work and hospital, medical & dental activities were occupied by women.4
On the other end of the scale, renting of construction or demolition equipment in the construction industry recorded the lowest percentage, followed by painting & decorating and mining of dimension stone.
We can go one step further with the analysis. Figure 3 below plots all activities according to the percentage of persons employed who are women. Activities appearing on the right side of the chart have a higher share of women in employment, in contrast to those on the left.
Each industry exhibits its own unique pattern. Activities in personal services, for example, are widely spread out, stretching from 36,2% (sporting activities) to 76,7% (social work). Activities in construction, on the other hand, are clustered tightly at the lower end of the scale. This shows that the lack of representation in construction is a broader characteristic of the industry as a whole.
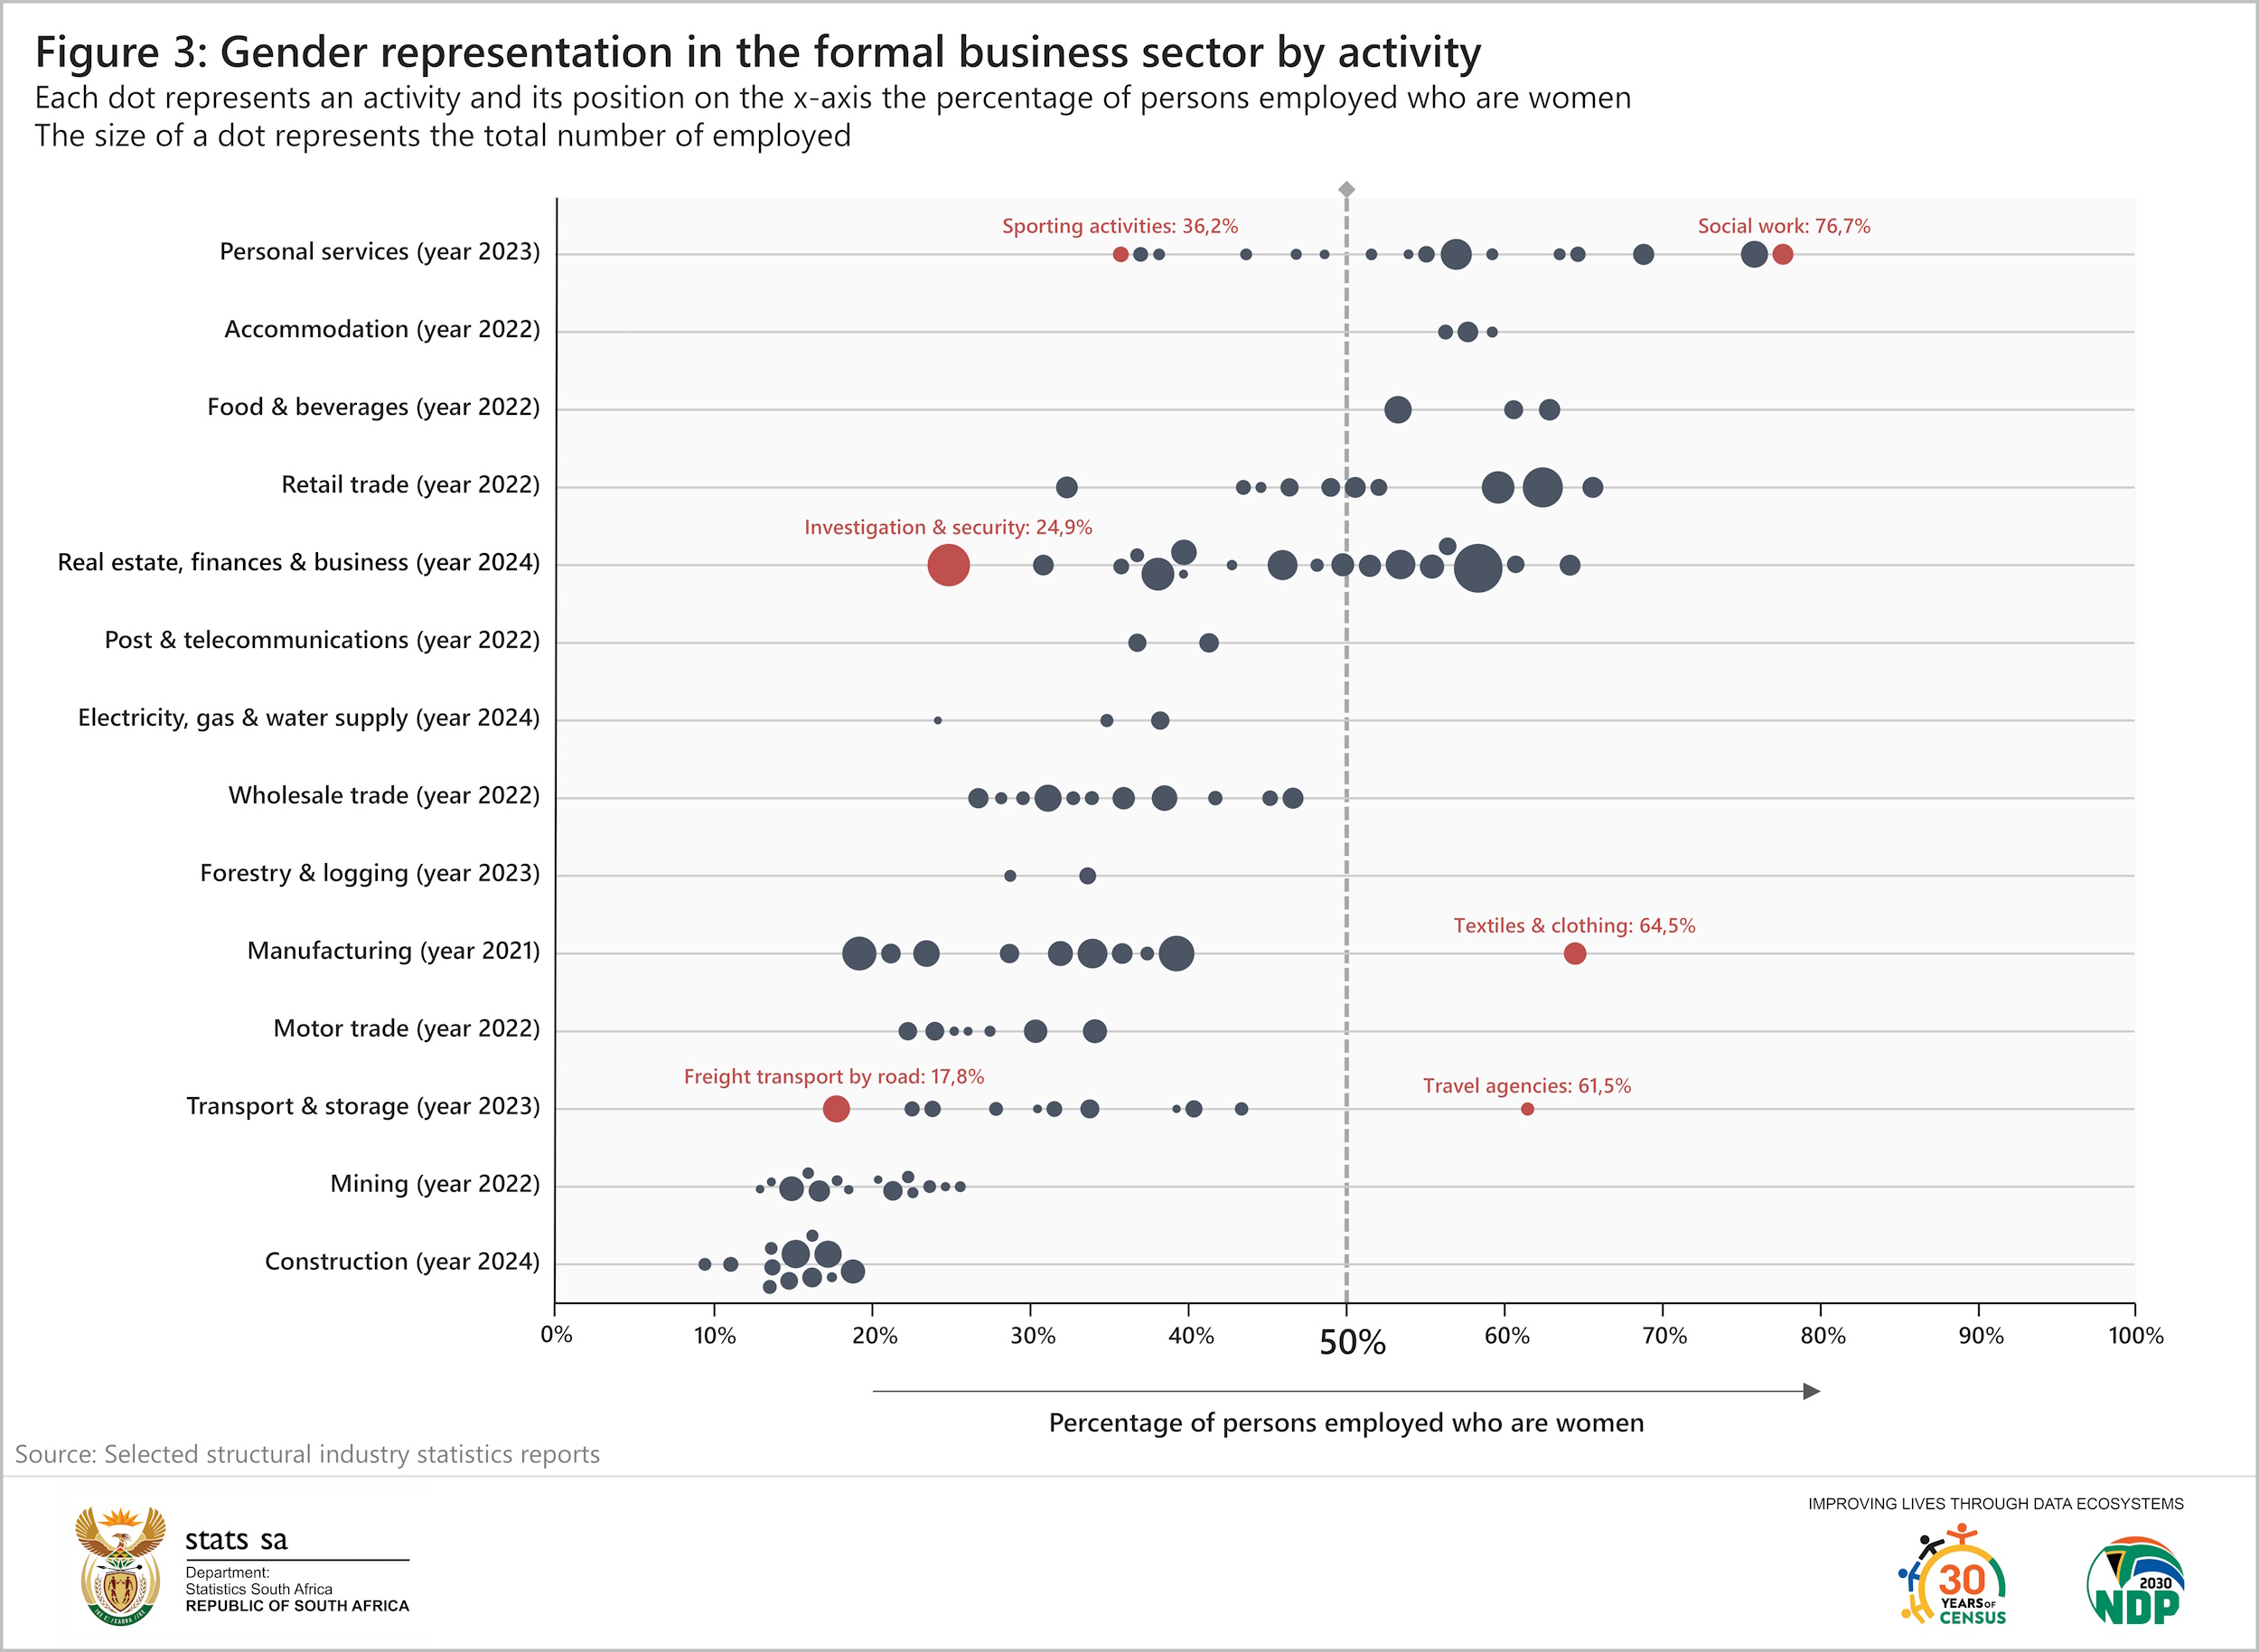
Another interesting takeaway from Figure 3 is the two outliers in manufacturing and transport & storage. Although women are broadly underrepresented across both industries, they occupy more than 60% of jobs in textiles & clothing (manufacturing) and travel agencies (transport & storage).
To summarise, what do the data above tell us about women’s representation in the formal business sector? Firstly, that representation differs across industries, with personal services recording the highest level of women’s representation and construction the lowest. Secondly, that representation varies within industries. Thirdly, an activity may diverge from the broader gender profile of its industry.
For more information, access the data from the following reports:
1 Quarterly Labour Force Survey (QLFS), 2nd quarter 2026, Table 3.1 (download here). The data show that women are more likely to be employed in sales and services, clerical occupations and domestic work (read here).
2 Note that the latest data from the structural industry surveys might not cover the same year. Due to the complexity and size of the surveys, updates are published every three to five years in a staggered cycle. This ensures that data are collected at a high level of detail, giving structural industry data an advantage over most other industry-related surveys.
3 The mining figures only include employees directly employed by the mines. Employees hired through labour brokers, subcontractors, and capital employees are excluded.
4 Due to their similar nature, the two activities of ‘hospital activities’ and ‘medical & dental practice activities’ were combined into a single entry in Figure 2 and Figure 3. Women occupied 77,1% of jobs in ‘hospital activities’ and 75,8% of jobs in ‘medical & dental practice activities’.
Similar articles are available on the Stats SA website and can be accessed here.
For a monthly overview of economic indicators and infographics, catch the latest edition of the Stats Biz newsletter here.