
Women Drive Divorce Filings as Marriages Continue to Decline in South Africa
South Africa is experiencing a profound shift in its marital landscape, with the latest data revealing not only a rise in divorce rates but also a steady decline in the number of marriages being registered.
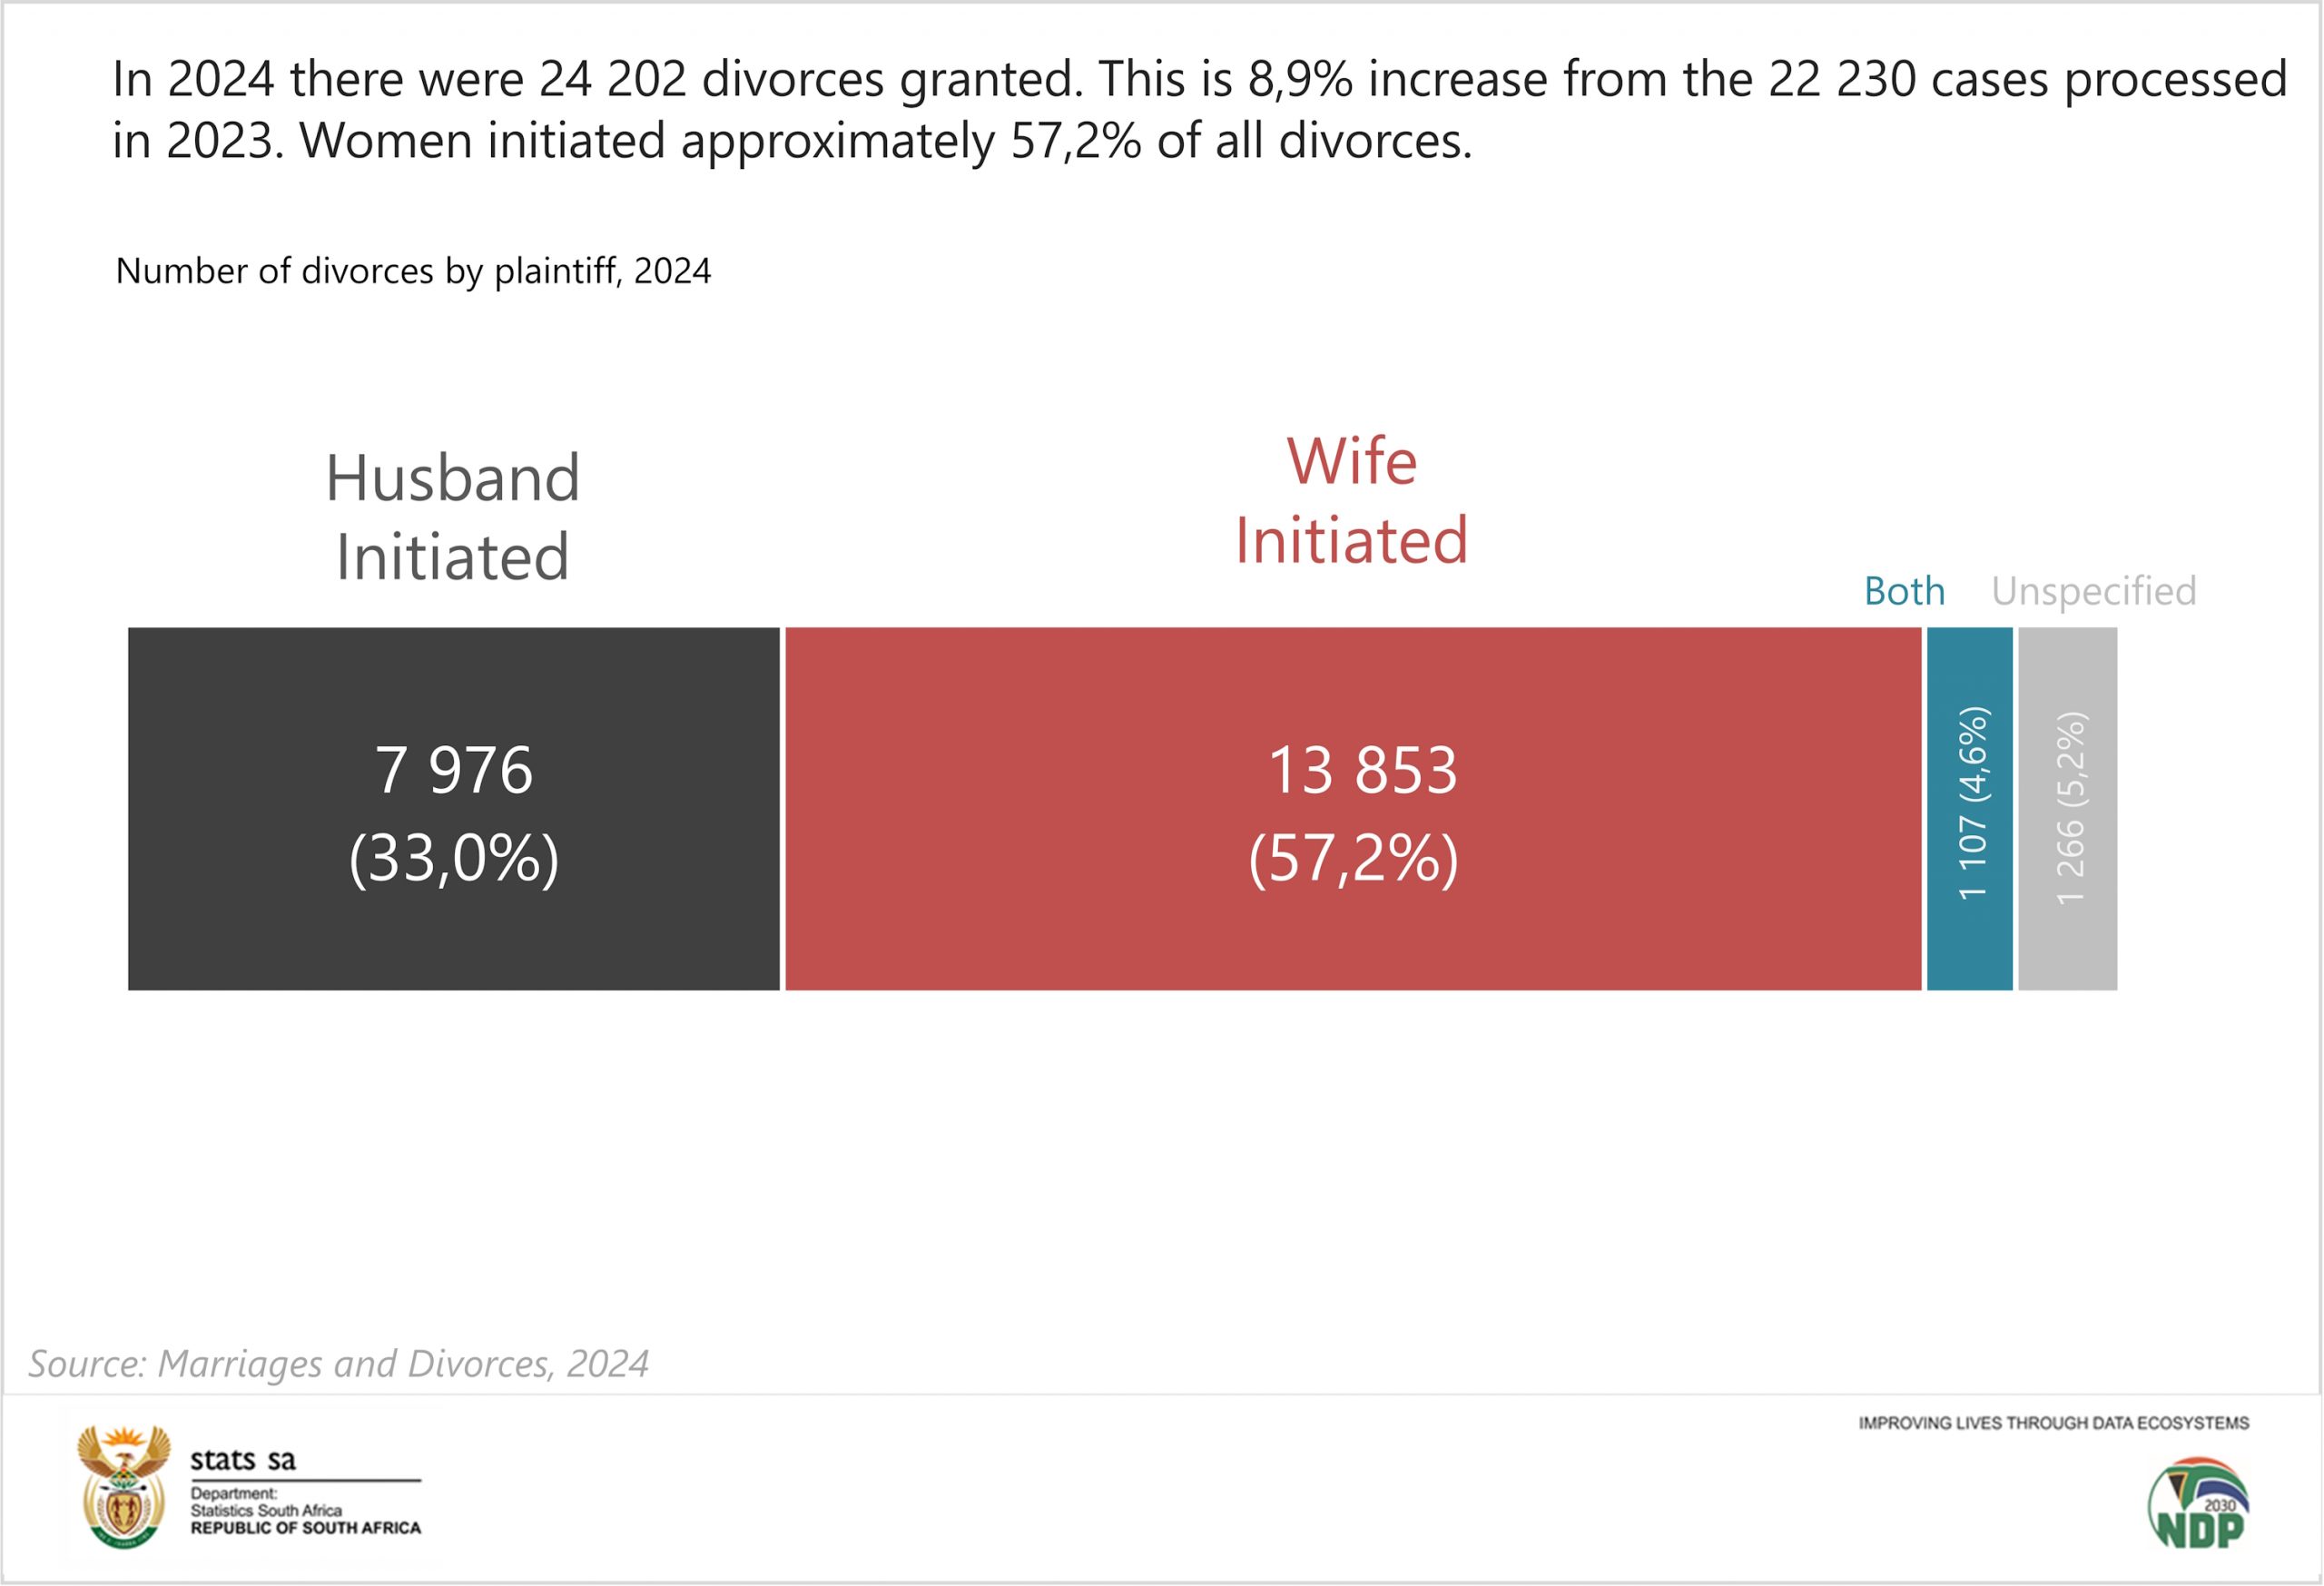
The new data shows a notable uptick in divorces and a clear trend: women are increasingly the ones initiating the end of the union. In 2024, a total of 24 202 divorces were granted across the country, an 8,9% increase from the 22 230 recorded in the previous year, signalling not only a rise in marital breakdowns but also deeper social changes within a constitutional democracy that has long championed gender equality. Within this growing number of cases, women remain the dominant initiators of divorce. According to the Marriages and Divorces 2024 report released by Statistics South Africa, wives filed for approximately 57,2% of all divorces granted in 2024. This trend, consistent in previous years, reflects a broader evolution in women’s autonomy and their access to legal avenues that protect their rights within marriage.
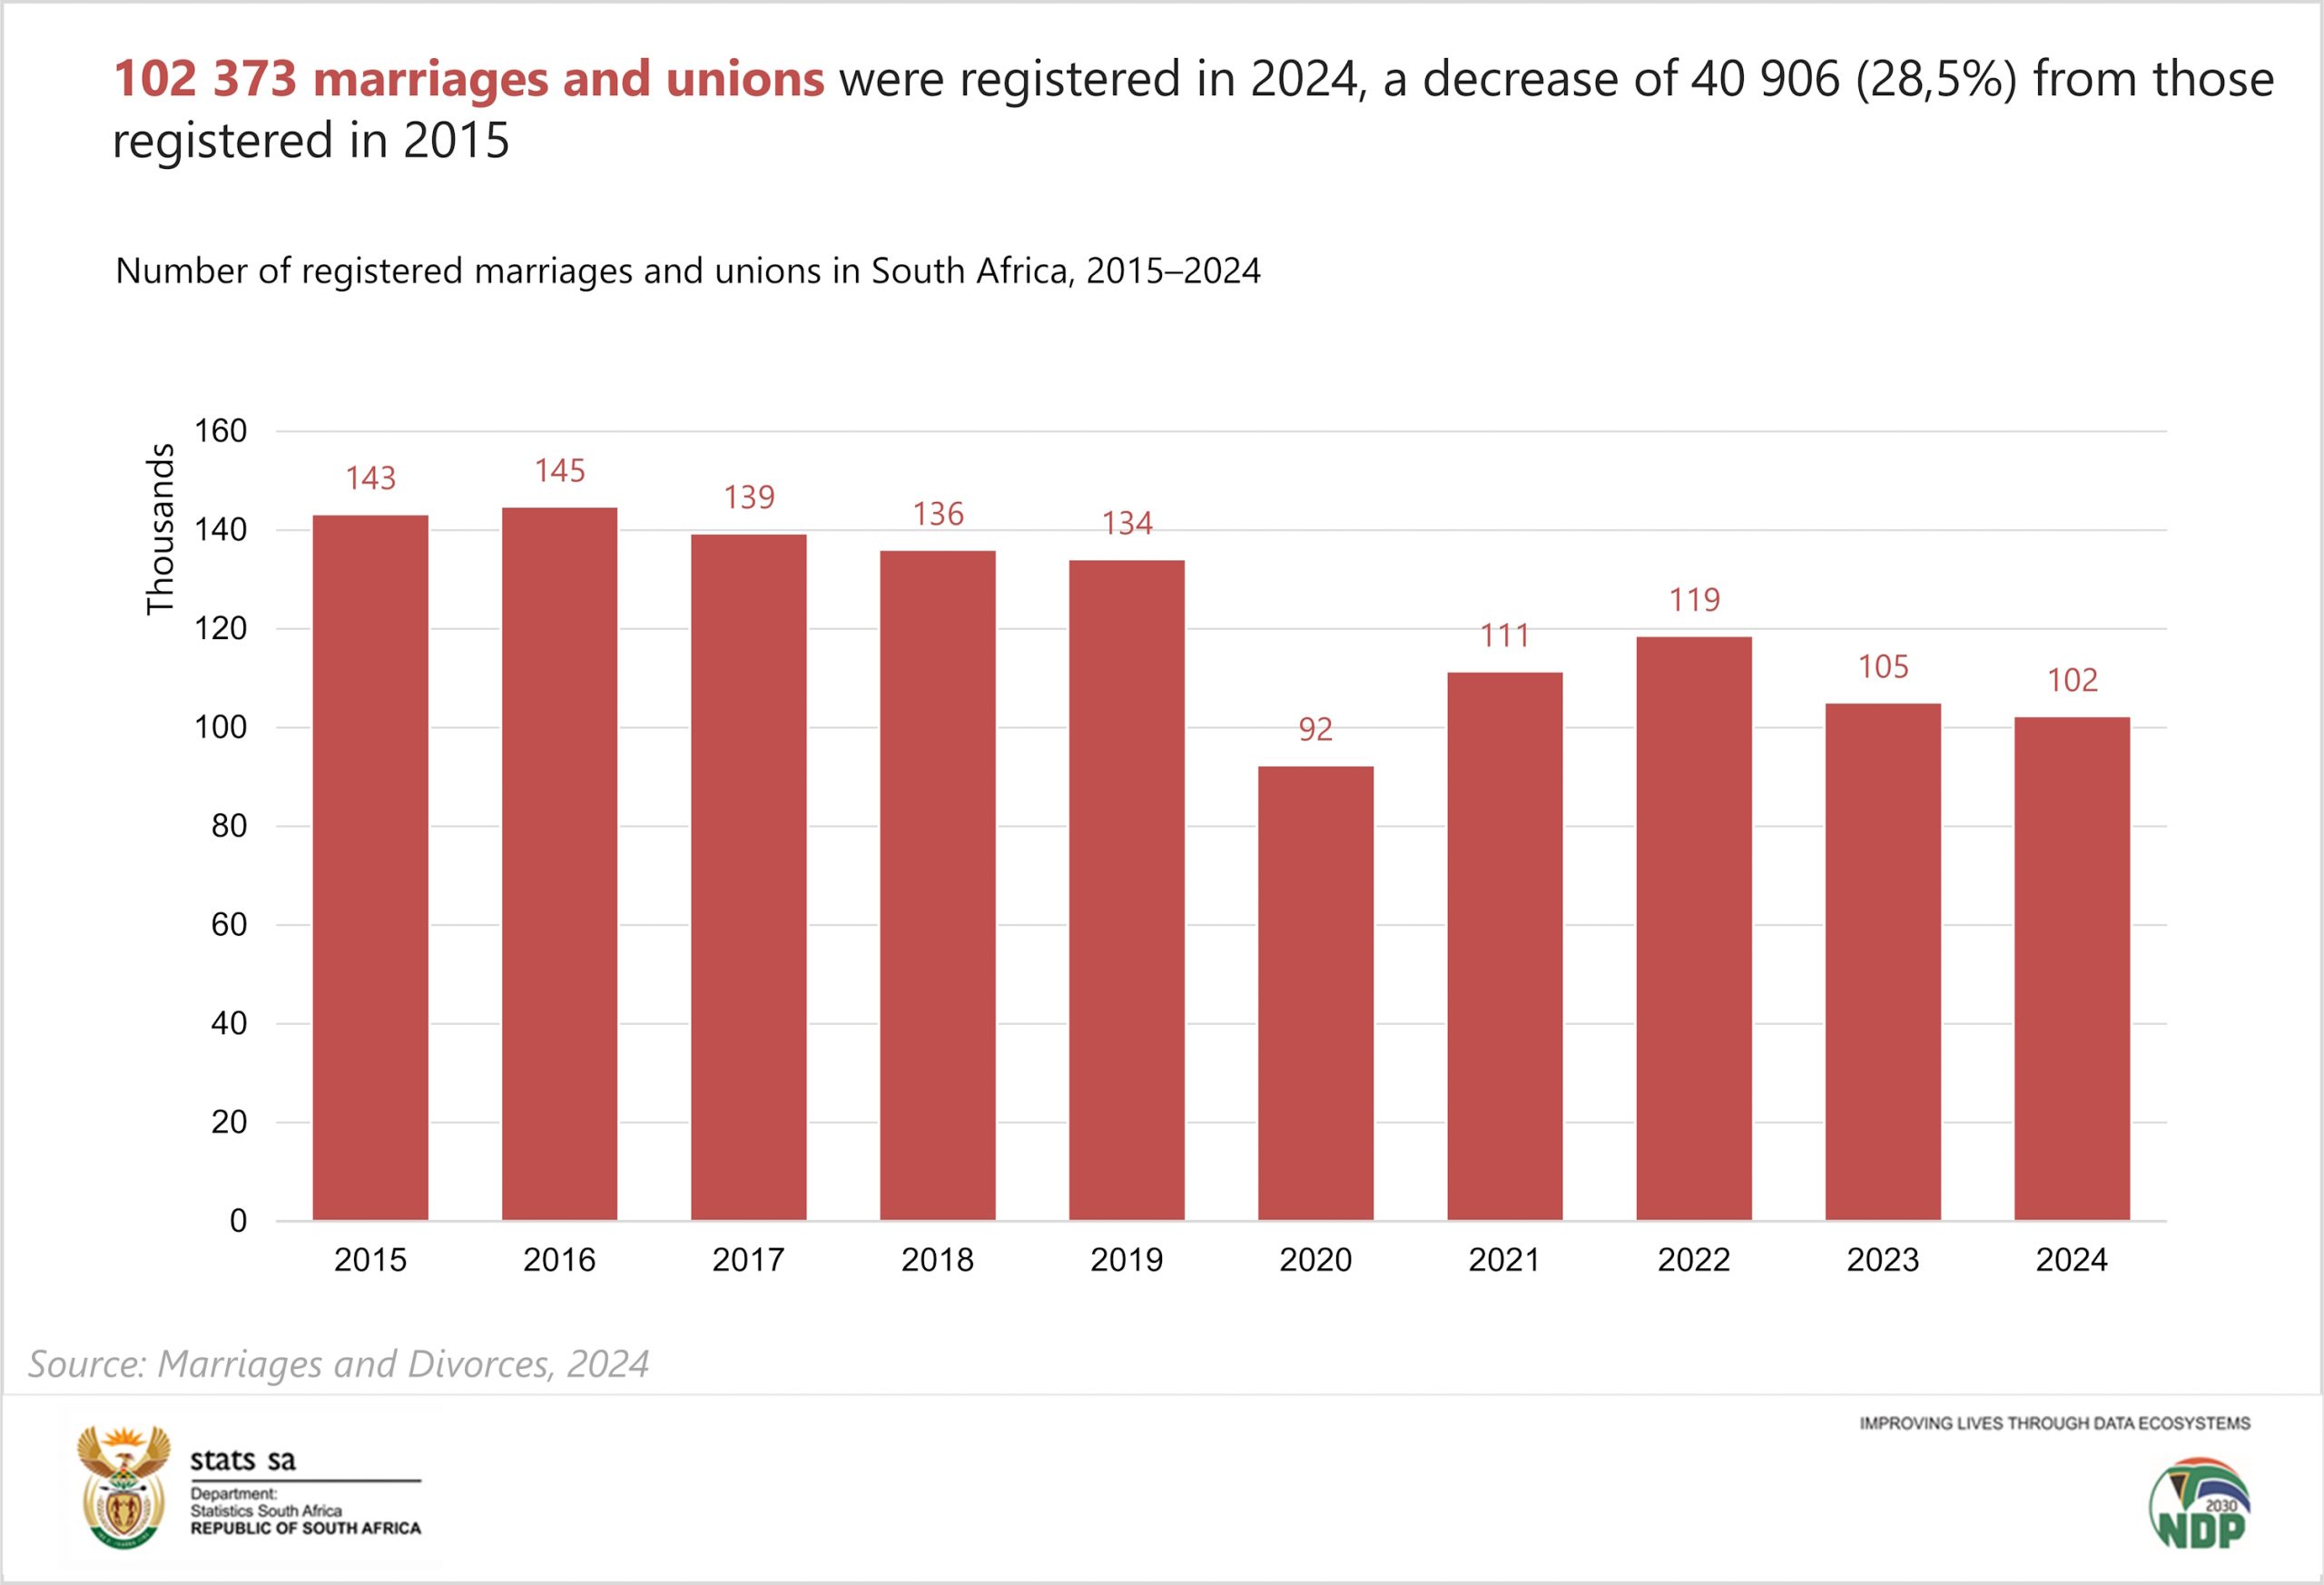
The country recorded 102 373 marriages and unions in 2024, marking a decrease of 2,6% from the 105 123 registered in 2023. More significantly, when compared to 2015, the decline becomes even more pronounced: marriages dropped by 40 906 over the decade, representing a 28,5% decrease. Civil marriages totalled 97 510 in 2024, which reflects a 1,8% decline from the 99 289 civil marriages registered in 2023. The data confirms a consistent downward trajectory in marriage registrations across the 10‑year period from 2015 to 2024, suggesting a structural and sustained shift in how South Africans approach long-term unions.
This long-term decline in marriages provides important context for understanding the rise in divorces initiated by women. The data shows that the 13 853 women-led divorce cases were distributed unevenly across the provinces. Gauteng accounted for the largest share, with 4 289 divorces initiated by wives, representing 31,0% of the national total. The Western Cape followed at 18,6% (2 579 cases), while KwaZulu-Natal contributed 13,8% (1 910 cases). Provinces such as the Eastern Cape and Limpopo recorded 1 127 (8,1%) and 1 053 (7,6%) cases respectively, while the Free State added 1 022 divorces (7,4%). North West registered 910 cases (6,6%), Mpumalanga 782 (5,6%) and the Northern Cape had the smallest share with 181 divorces, making up just 1,3% of the total.
A closer look at marital history shows that the majority of women filing for divorce were experiencing the end of their first marriage. In 2024, 89,1% of female plaintiffs had been married once before initiating divorce proceedings. Only 6,8% had been married twice, while fewer than one percent (0,7%) had been married more than three times. A small proportion, 3,5%, did not specify how many times they had been married.
Age remains a telling factor in the profile of women initiating divorce. The data indicates that 70,7% of women who filed for divorce were younger than their husbands, reaffirming traditional age patterns in South African marriages. In contrast, 16,5% of female divorcees were older than their spouses, while 7,1% were of the same age. These age dynamics intersect with the broader trend of couples divorcing later in life. Median ages for male and female divorcees have steadily increased over the past five years: between 2020 and 2024, the median age for male divorcees rose from 45 to 46 years, while women saw an increase from 41 to 42 years. The upward shift suggests that individuals are entering marriage later and spending more years together before choosing to end the relationship.
The age distribution of female divorcees further highlights this pattern. The highest number of divorces in 2024 occurred among women aged 40 to 44 years, with 4 906 cases representing 20,3% of all female divorcees. Those aged 35 to 39 followed closely with 4 775 divorces, accounting for 19,7%. At the other end of the spectrum, only 133 divorces representing 0,5%, involved women younger than 25.
Economic participation also plays a role in understanding divorce trends. In 2024, 10 804 of the women who filed for divorce were employed, making up 44,6% of the total. The highest proportions were found among women working in professional, semi-professional and technical occupations. These were followed by those in managerial and administrative roles, accounting for 8,4%, and women in clerical and sales positions at 7,9%. Access to income and professional stability can expand a person’s capacity to make decisions that serve their own interests, including leaving relationships that are no longer working for them.
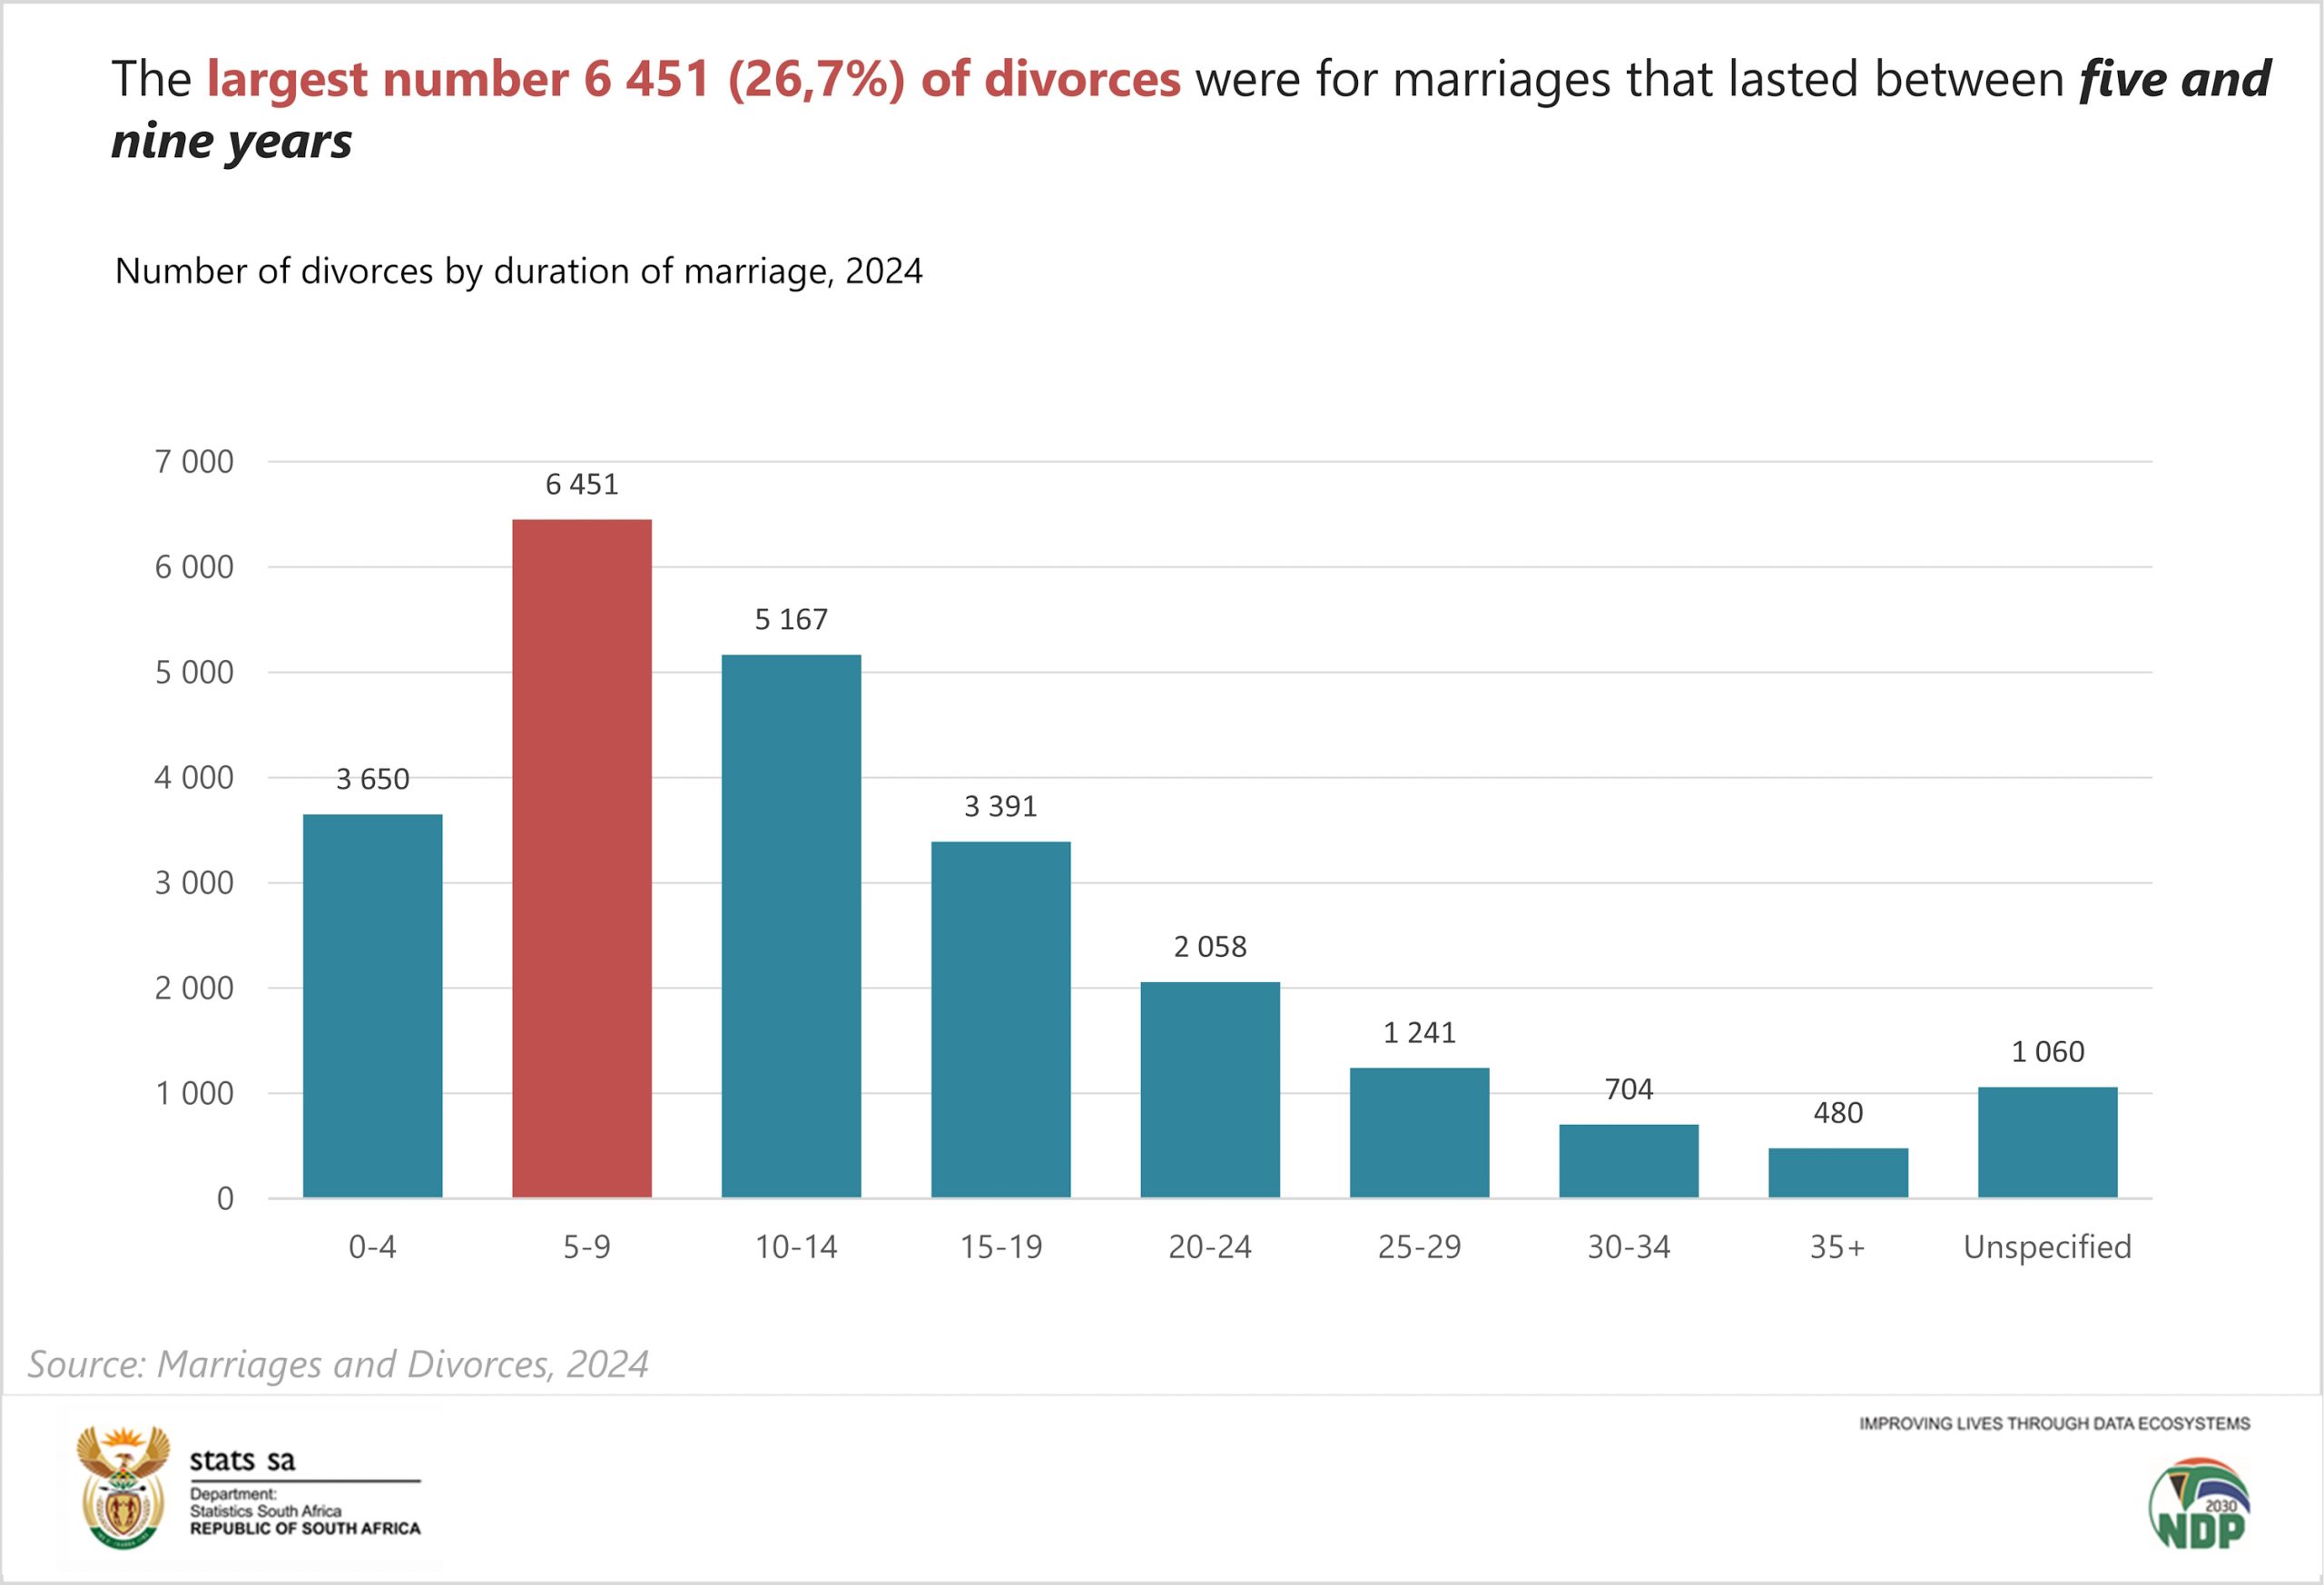
Marriage duration offers another perspective on the stability of relationships. The largest share of divorces—6 451 cases, or 26,7%—occurred in marriages that had lasted between five and nine years. This was followed by marriages of 10 to 14 years, which accounted for 5 167 divorces (21,3%). Another 3 650 divorces (15,1%) were granted to couples married for less than five years. Overall, four in every ten divorces granted in 2024—10 101 cases, representing 41,7%—involved marriages that had lasted less than a decade.
Taken together, the steady decline in marriages and unions since 2015 and the rise in divorces initiated by women tell a coherent story about social change. Fewer people are marrying than a decade ago; those who do marry tend to do so later; and more women are exercising the freedom to choose relationship outcomes that best serve their well‑being. In practical terms, that means having the authority and means to decide whether to stay or leave.
For more information, download the full report here.