
Debt in the formal business sector
Debt can quickly become a curse if businesses take on more than they can handle. The most recent financial data from Stats SA covers debt in the formal business sector, highlighting industries that might be more at risk, with a particular focus on small enterprises.
Businesses borrowed less in 2024
Total debt (i.e. liabilities) in the formal business sector amounted to R9,8 trillion in 2024, according to the latest Annual Financial Statistics (AFS) survey.1 This was 0,7% lower than 2023’s reading, representing the first decline in debt since the beginning of the AFS time series in 2005.
In rand terms, three of the nine AFS industries recorded a fall in liabilities in 2024. The business services industry experienced the largest decrease, followed by construction and manufacturing. The other AFS industries borrowed more, with the transport, storage & communication industry recording the largest increase. Liabilities can be long-term (e.g. long-term loans and amounts owed on leases) or short-term (e.g. bank overdrafts and trade payables).
The debt-to-assets ratio
On its own, a single rand value doesn’t provide a complete story of how debt may be affecting a business. A more nuanced picture emerges if the value of liabilities is compared to or set against another line item. Financial ratios are useful in this regard. The AFS statistical release provides several financial ratios, four of which are related to debt.
One of these is the debt-to-assets ratio. This ratio is calculated by dividing total liabilities by total assets and expressing the result as a decimal. A ratio of 1 or higher indicates that a business relies heavily on debt to finance its assets. Assets can be long-term in nature (e.g. property, plant & equipment and investments) or held for relatively short periods of time (e.g. cash and inventory).
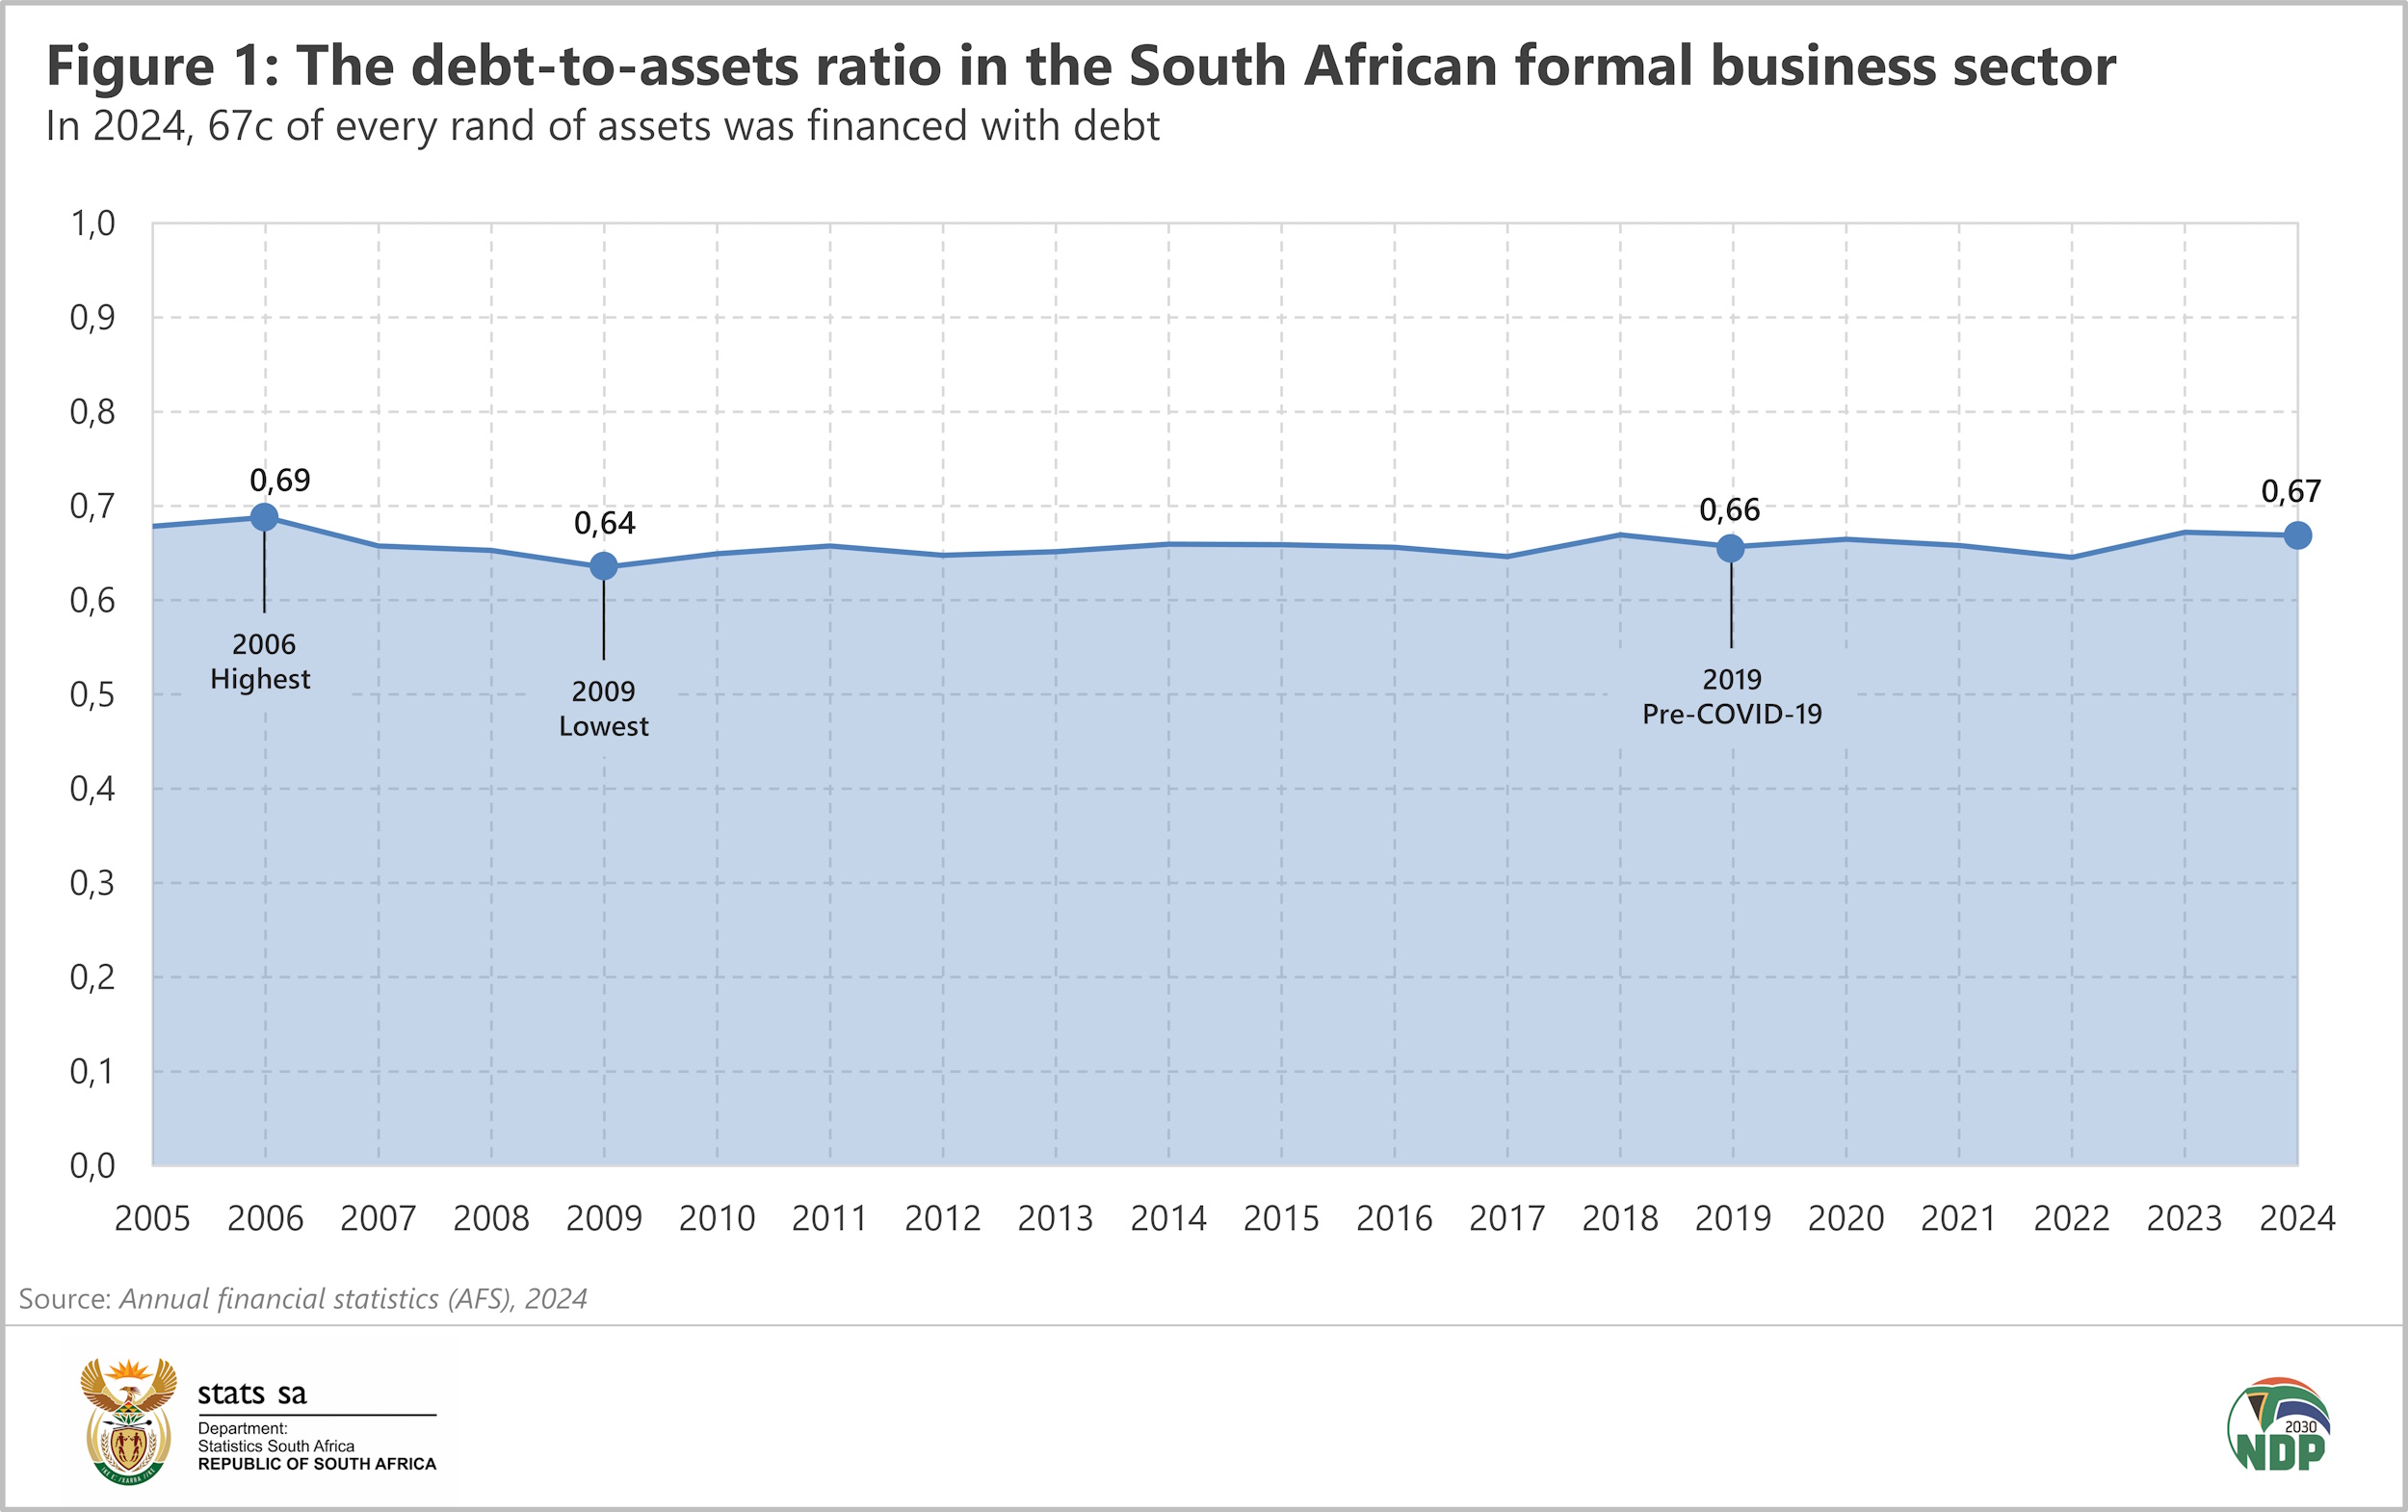
A rise in the debt-to-assets ratio may be a red flag, indicating increased vulnerability to debt. As shown by Figure 1 below, over the last two decades the debt-to-assets ratio for the formal business sector (as measured by the AFS) has remained relatively stable, fluctuating within a tight range of 0,6‒0,7. In 2024, the ratio was 0,67 (i.e. 67% of formal business assets were financed with debt that year).
The ratio was 0,66 in 2019 before the COVID-19 pandemic, slightly lower than in 2024. In Figure 2, three AFS industries experienced a rise in the ratio over this period. The business services industry registered the largest increase, followed by mining & quarrying and manufacturing. Construction recorded the largest decrease, followed by electricity, gas & water supply; personal services; and transport, storage & communication.
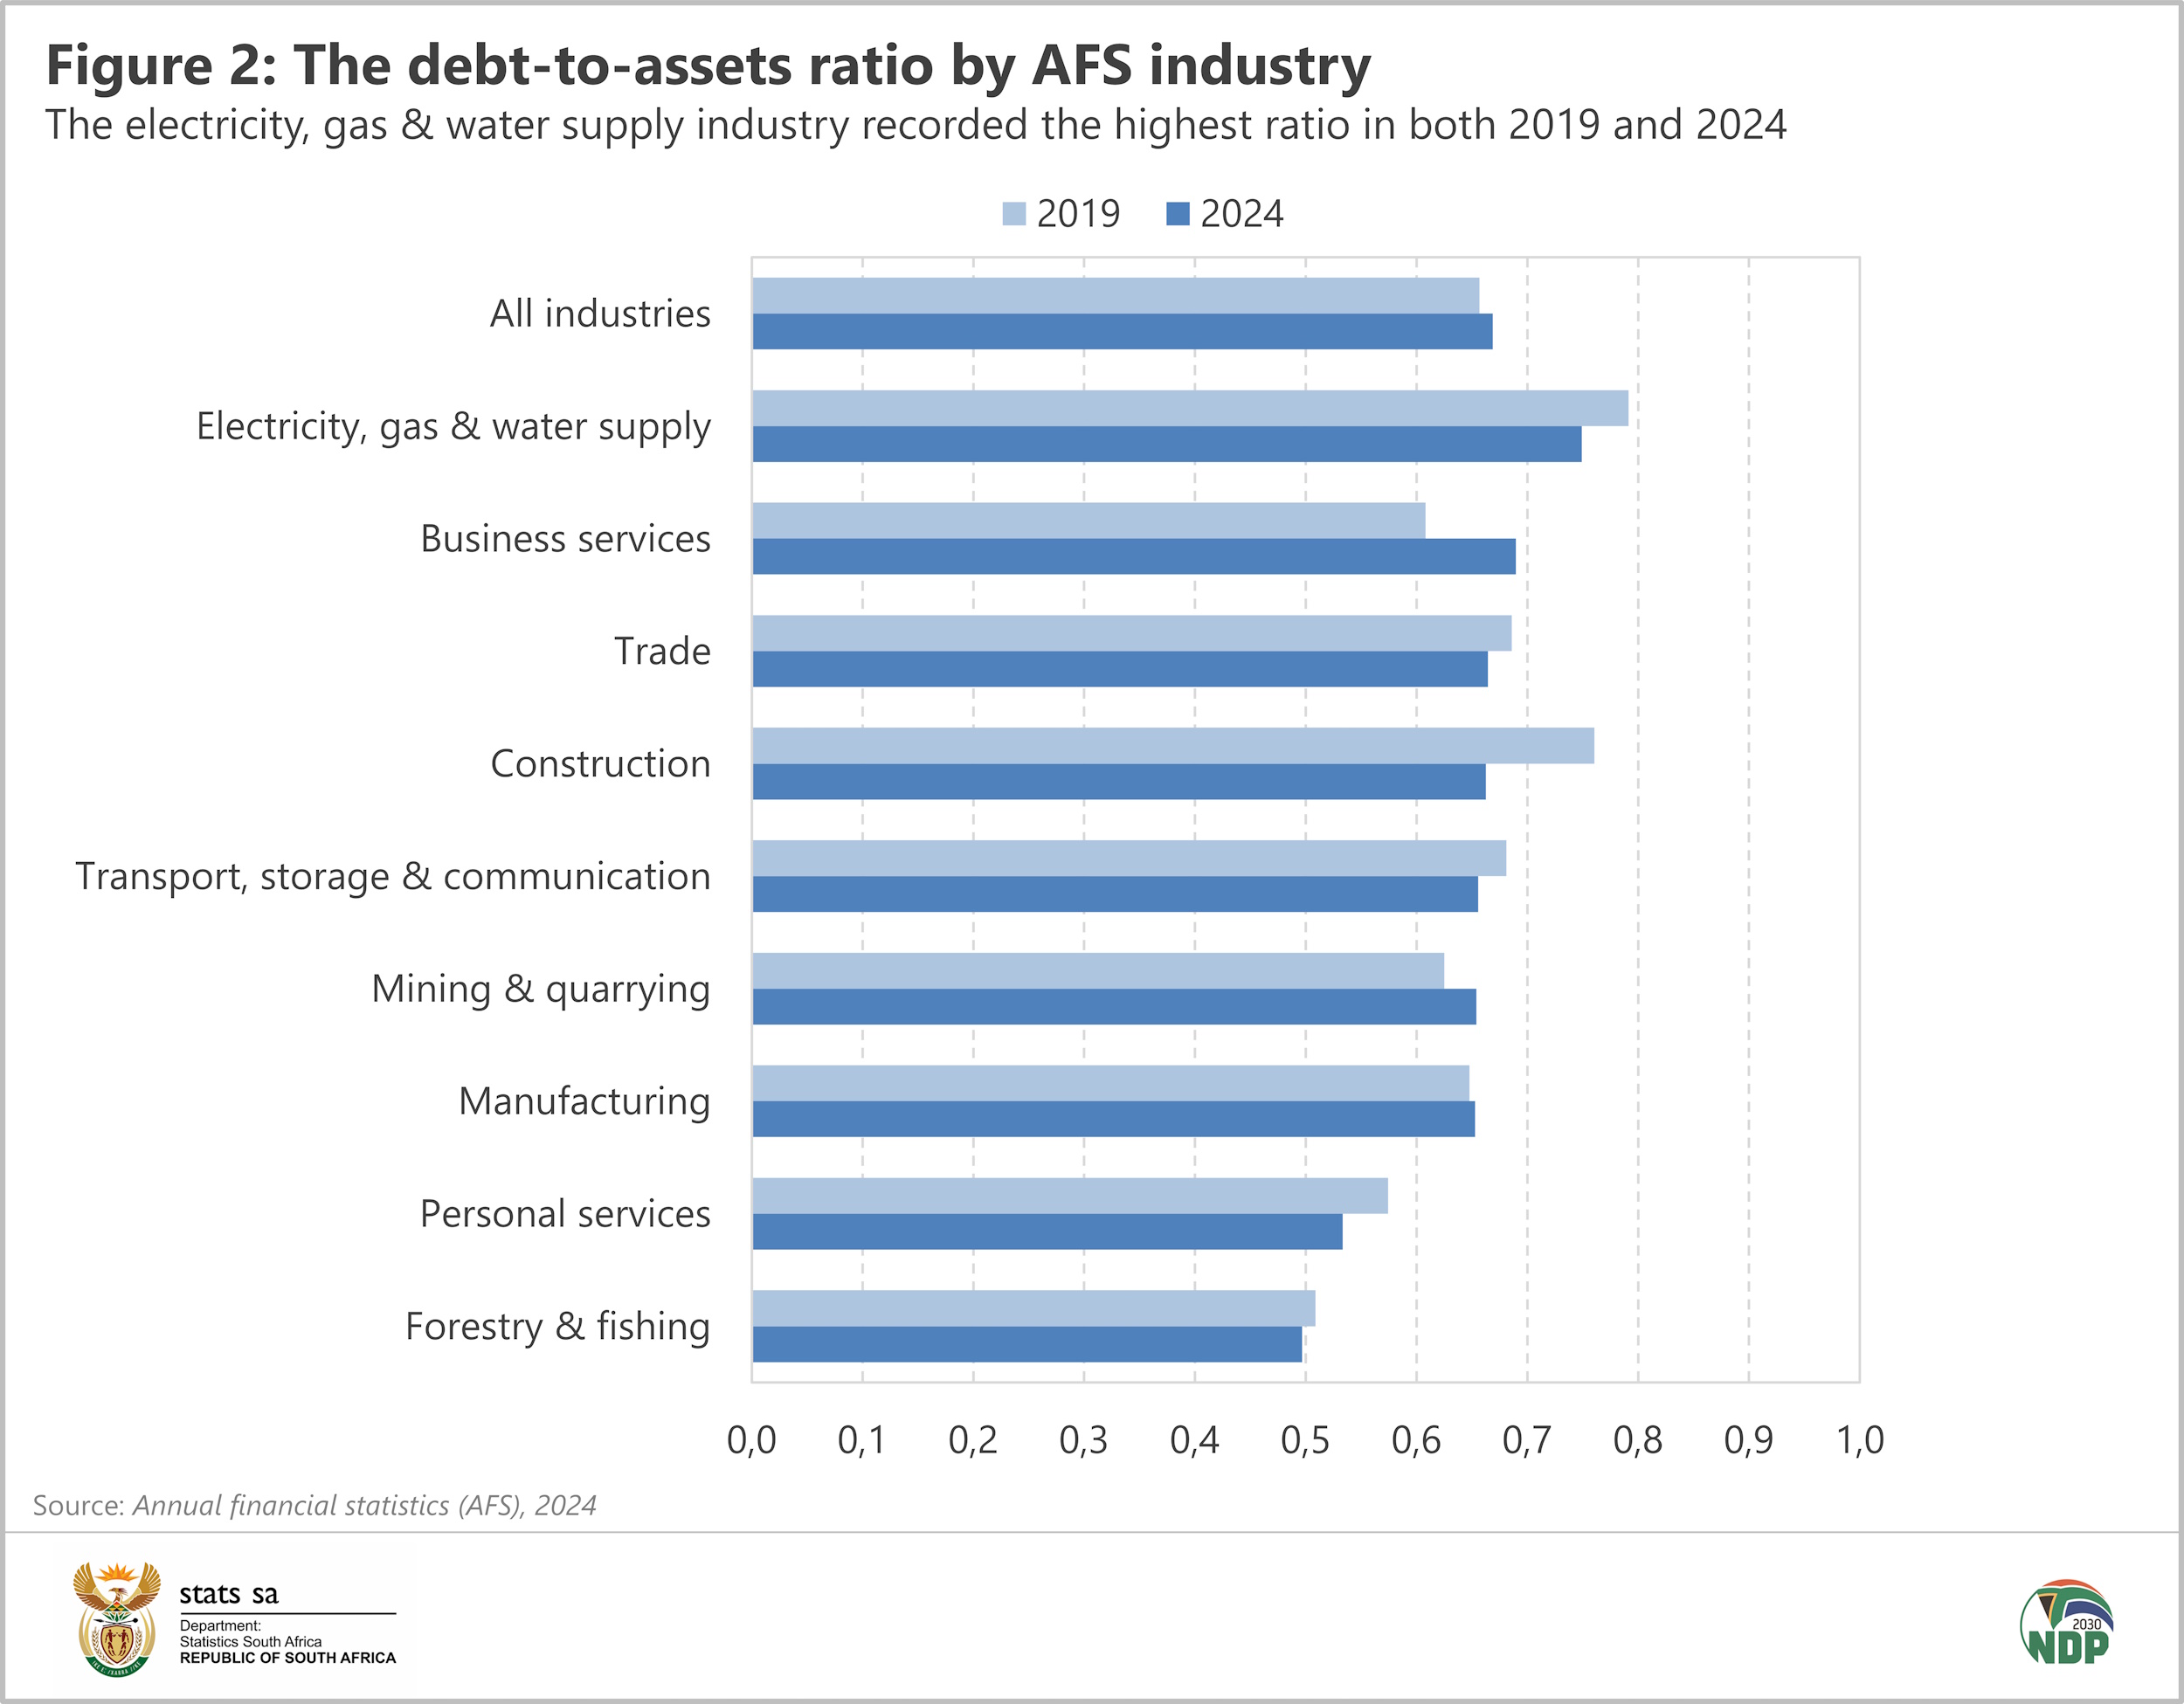
Electricity, gas & water supply had the highest ratio in both 2019 and 2024. The forestry & fishing industry recorded the lowest ratio during the referenced period.
Exploring the data for small enterprises
The AFS provides data for large, medium and small enterprises. In 2024, small enterprises posted a debt-to-assets ratio of 0,68, slightly higher than 0,67 recorded for the total formal business sector. Small enterprises in electricity, gas & water supply, and mining & quarrying recorded ratios greater than 1, as seen in Figure 3. Liabilities exceeded assets in these two cases.
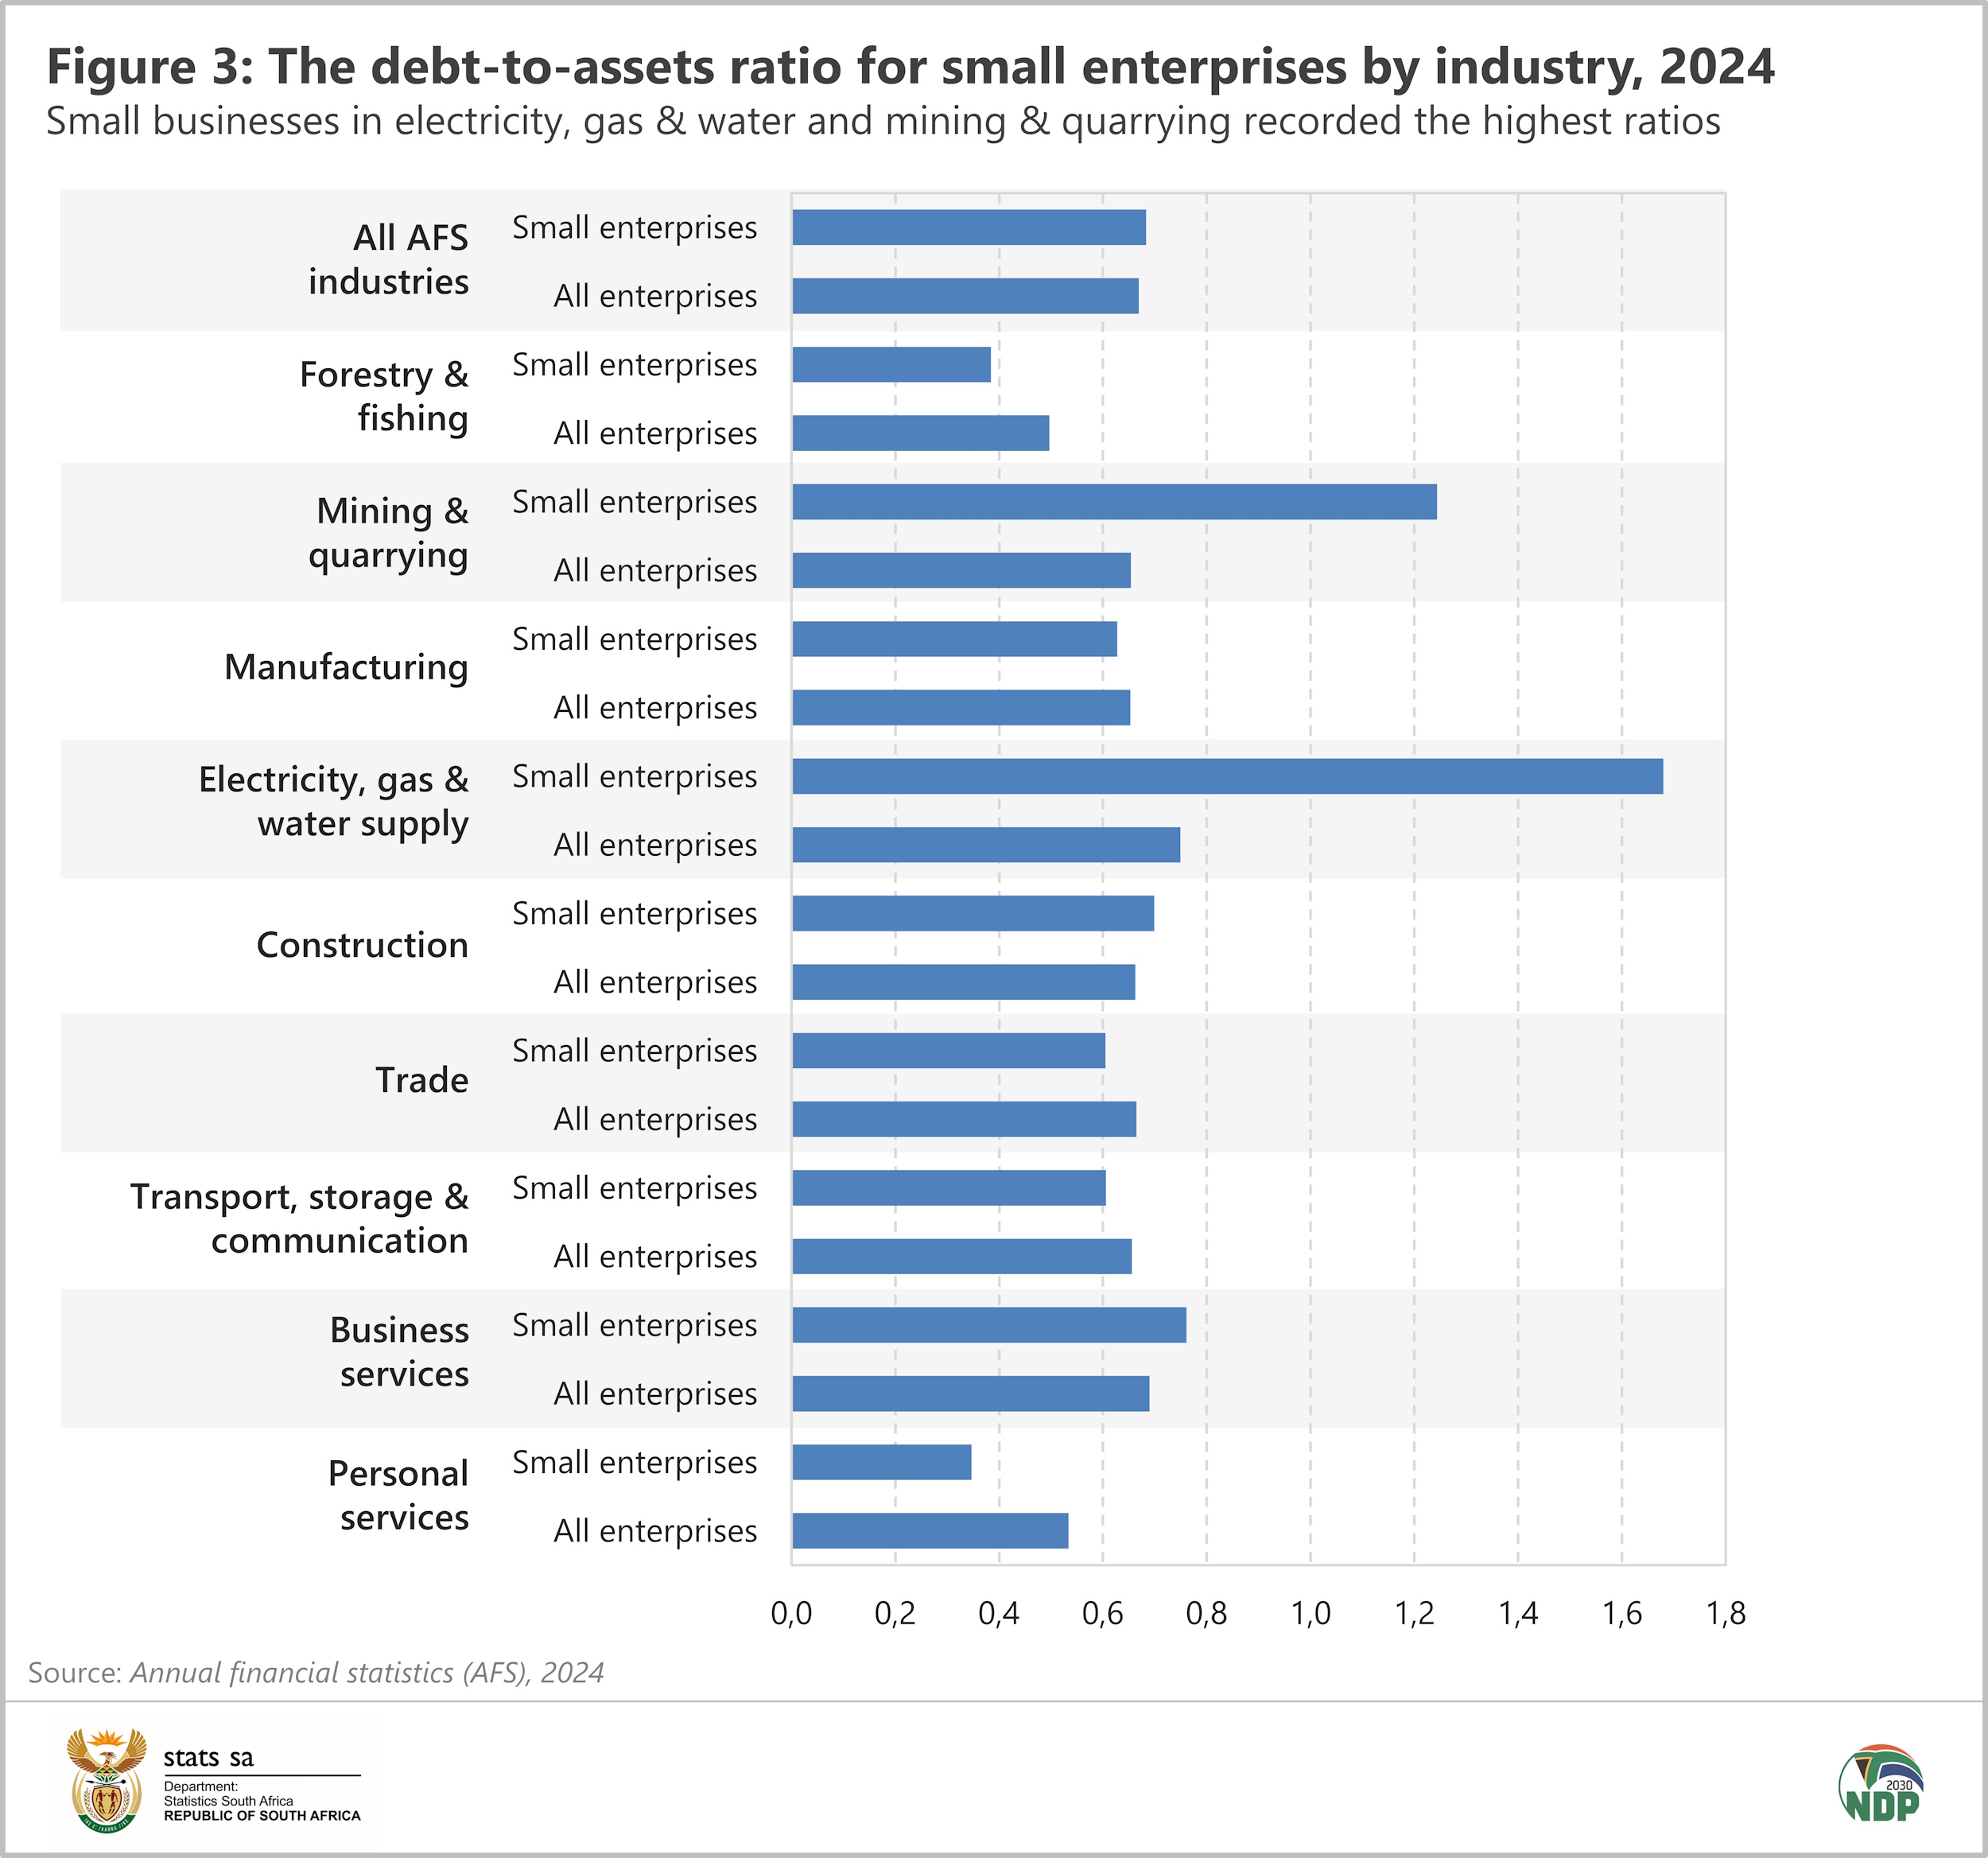
Figure 4 shows a breakdown of the types of liabilities and assets that small enterprises hold. The larger the contribution of a line item, the darker the colour. If we consider all AFS industries, long-term investments accounts for 37% of total assets held by small enterprises. On a more granular level, property, plant & equipment is the largest asset type in five industries, with the notable exception of business services where long-term investments dominate.
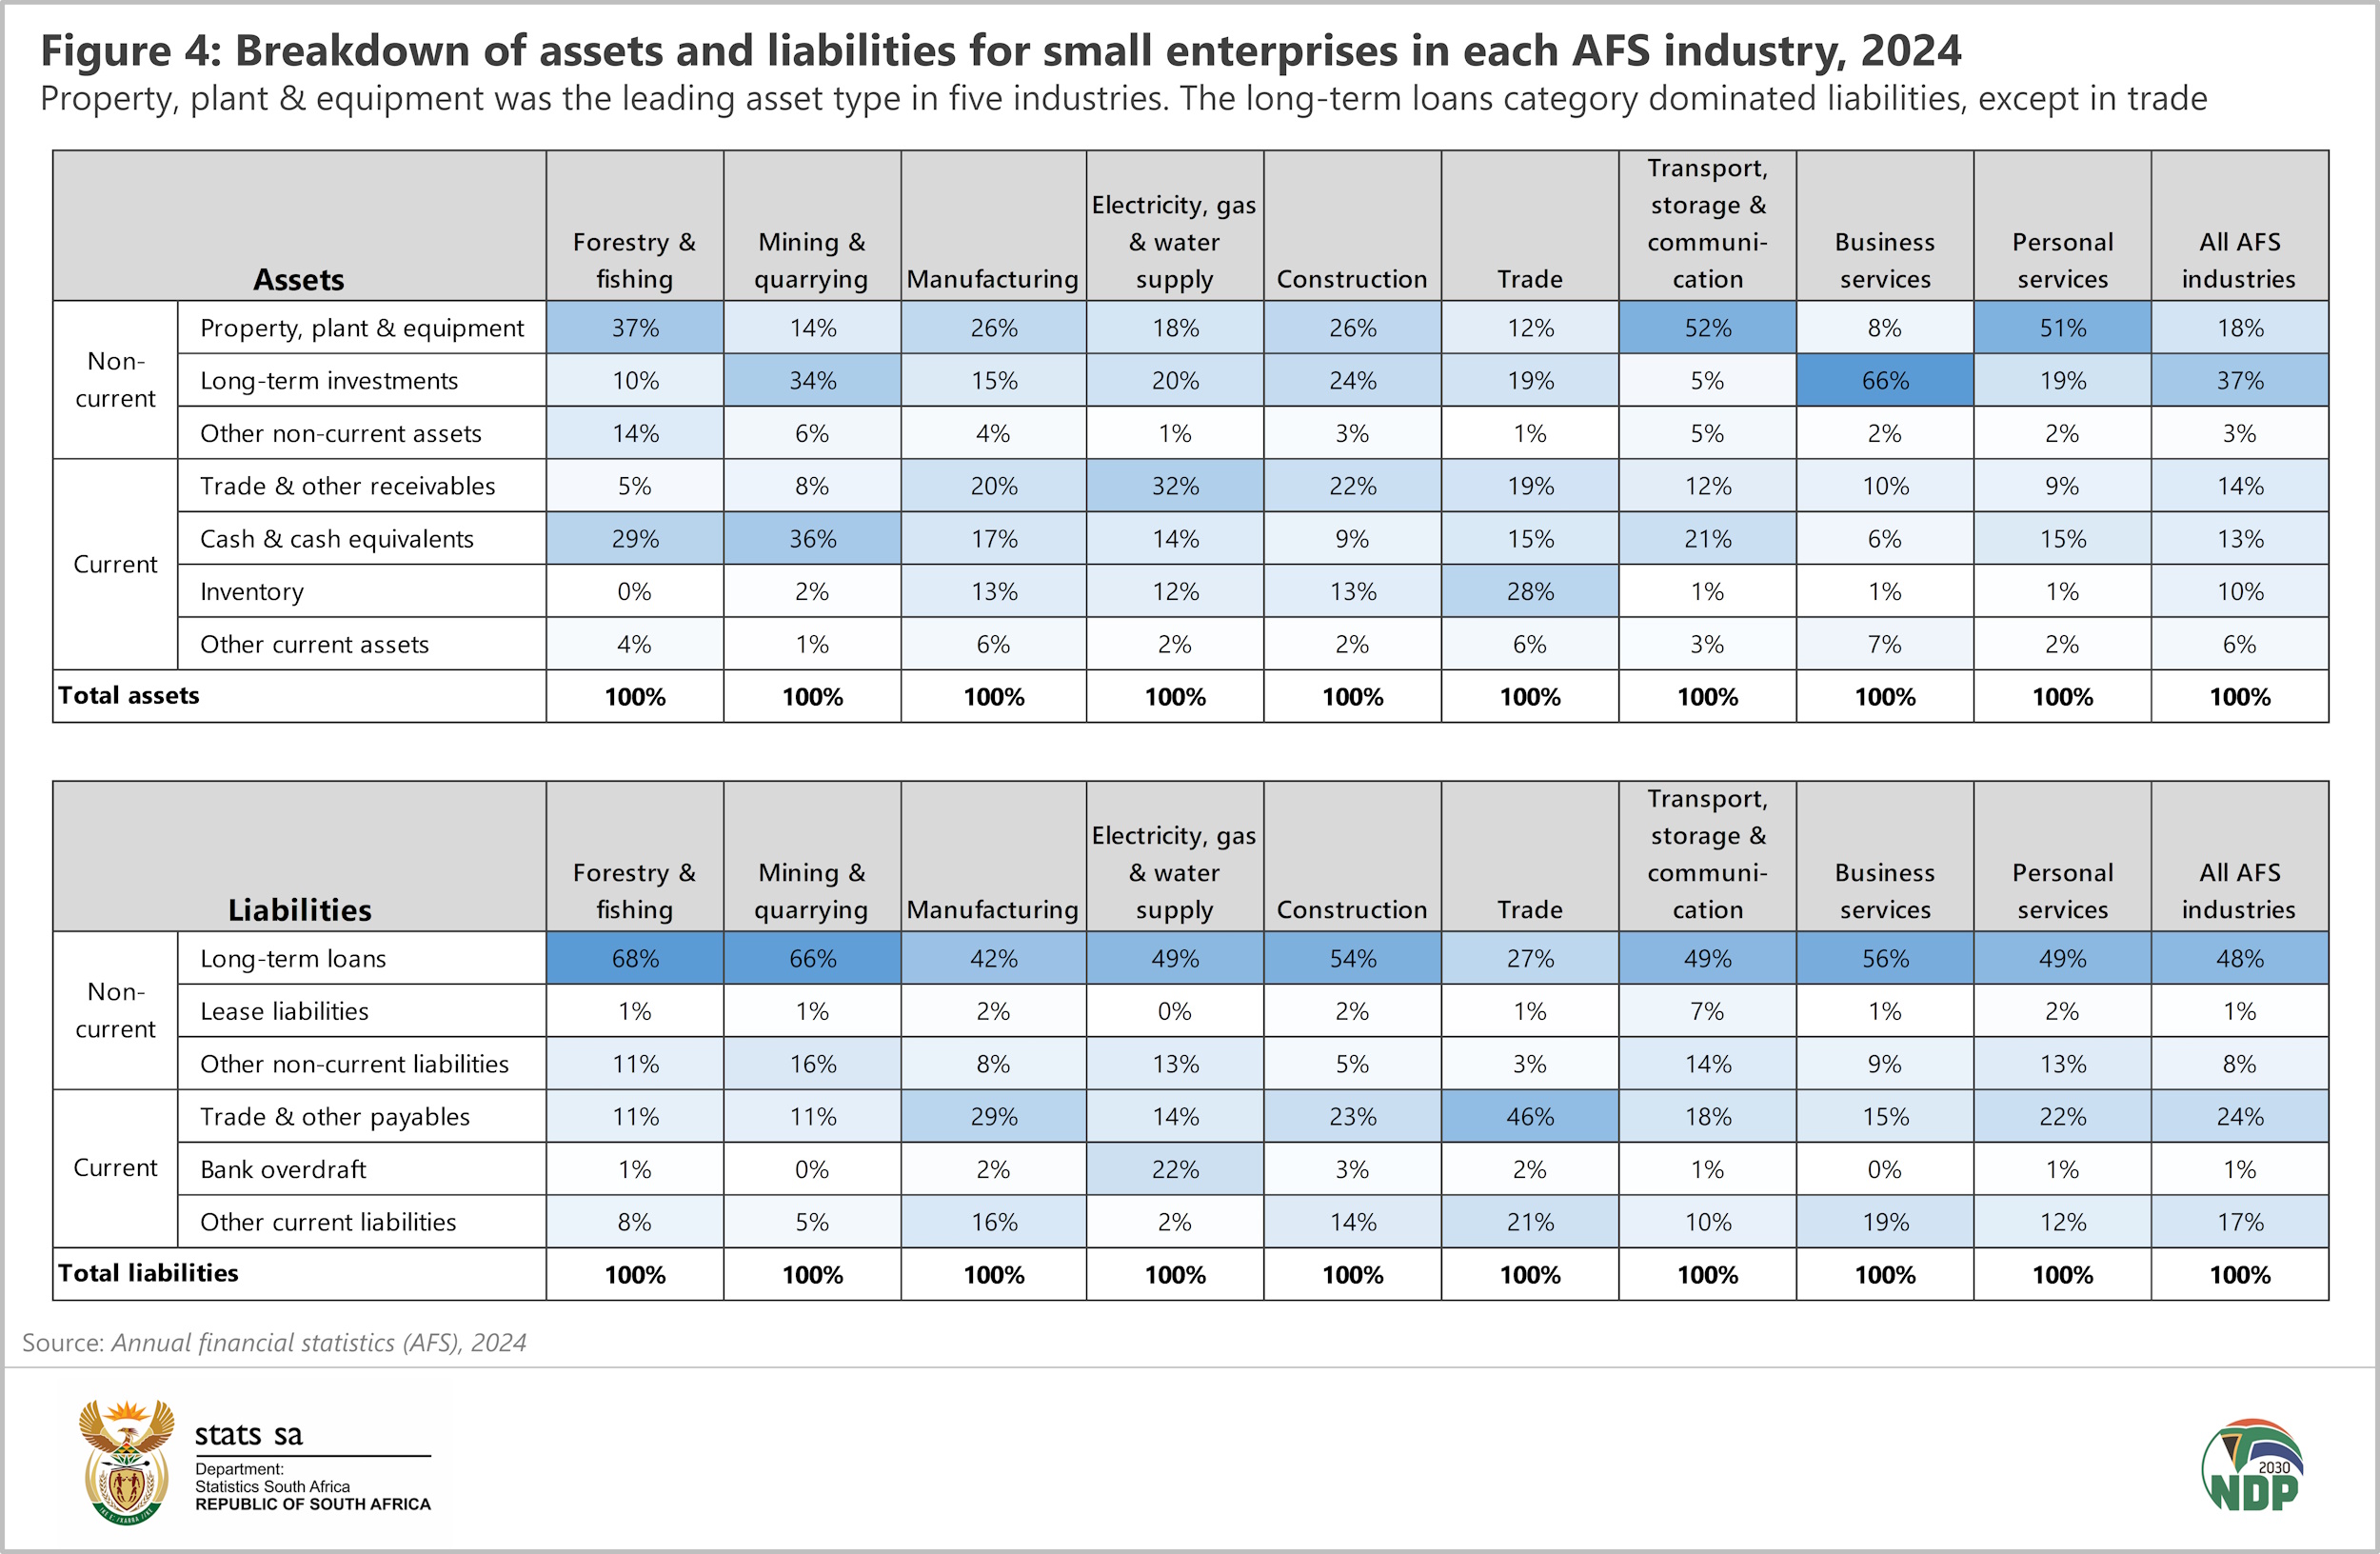
Most industries recorded long-term loans as their largest liability, except for trade where trade & other payables account for 46% of the total. Trade & other payables include amounts owed to suppliers for goods and services already received but not yet paid for.
As previously mentioned, small businesses in mining & quarrying and electricity, gas & water supply recorded a debt-to-assets ratio higher than 1. Long-term loans were the dominant form of debt in both these industries. For mining & quarrying in particular, long-term loans account for two-thirds of total liabilities. Bank overdrafts formed the second largest category in electricity, gas & water supply, accounting for 22%.
1 The AFS survey measures the financial health and performance of each industry, providing information on turnover, purchases, employment cost and capital expenditure. The report sources data from the financial statements of enterprises (i.e., private businesses and public corporations) and, in turn, is an important source for estimating annual gross domestic product (GDP). The AFS excludes agriculture and hunting; general government and educational institutions; and financial intermediation, pension funding, insurance and business services not elsewhere classified. The survey reference period for the latest AFS (i.e. AFS 2024) covers the financial years of enterprises ending on any date between 1 July 2023 and 30 June 2024.
To summarise, the debt-to-assets ratio is one of several that can provide a picture of the extent of debt in a company or industry. Although there has been little change in the debt-to-assets ratio over the last two decades for the formal business sector as a whole, industry-specific data shows electricity, gas & water supply recording the highest ratio in 2024. Small businesses in electricity, gas & water supply and mining & quarrying held more liabilities than assets.
For more information, download the Annual Financial Statistics (AFS), 2024 statistical release and Excel data here.
Similar articles are available on the Stats SA website and can be accessed here.
For a monthly overview of economic indicators and infographics, catch the latest edition of the Stats Biz newsletter here.