

Each city develops its residential landscape in its own, unique way. Do town planners opt to spread a city outward with more free-standing homes, upward with high-density housing, or a combination of both? Stats SA’s latest ten-year review of private sector building statistics1 provides clues on the types of residential patterns forming in metropolitan municipalities.
The City of Cape Town was the most active metropolitan municipality during the period 2014 to 2023, recording the highest number of new residential units overall.2 The metro saw the completion of the most dwelling houses (i.e. free-standing homes) and flats. The City of Johannesburg recorded the most townhouses (clustered houses), with 20 899 units built over this period (Figure 1).
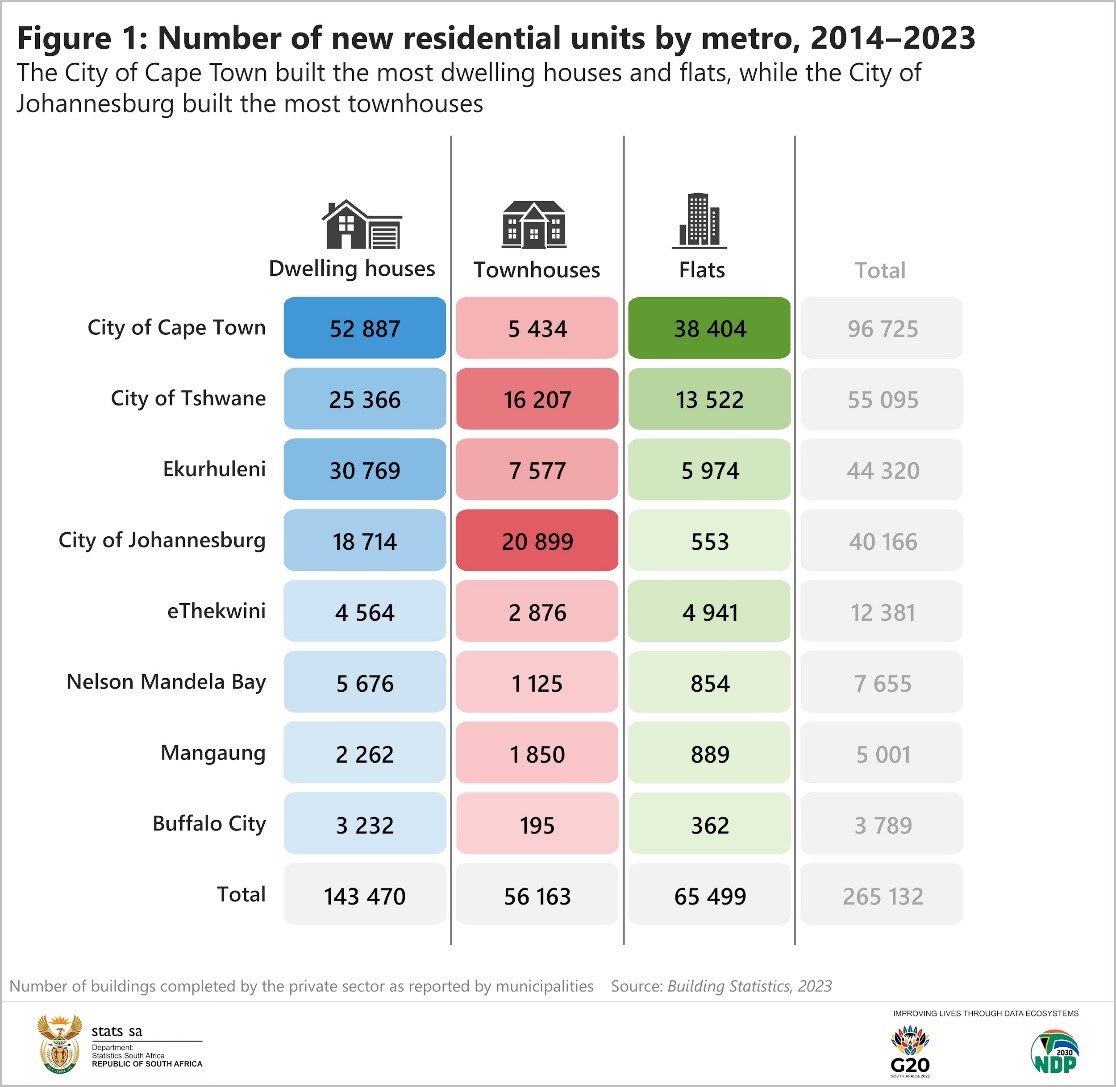
The City of Tshwane, the country’s administrative capital, registered the second highest number of flats and townhouses.
The housing priorities of each metropolitan municipality becomes clearer in Figure 2. Dwelling houses remain a popular choice. The bulk (85%) of new residential units in Buffalo City, for example, were dwelling houses, with less focus on townhouses and flats. Development in Nelson Mandela Bay and Ekurhuleni also focused heavily on dwelling houses, indicating that these metropolitan municipalities are building out rather than up.
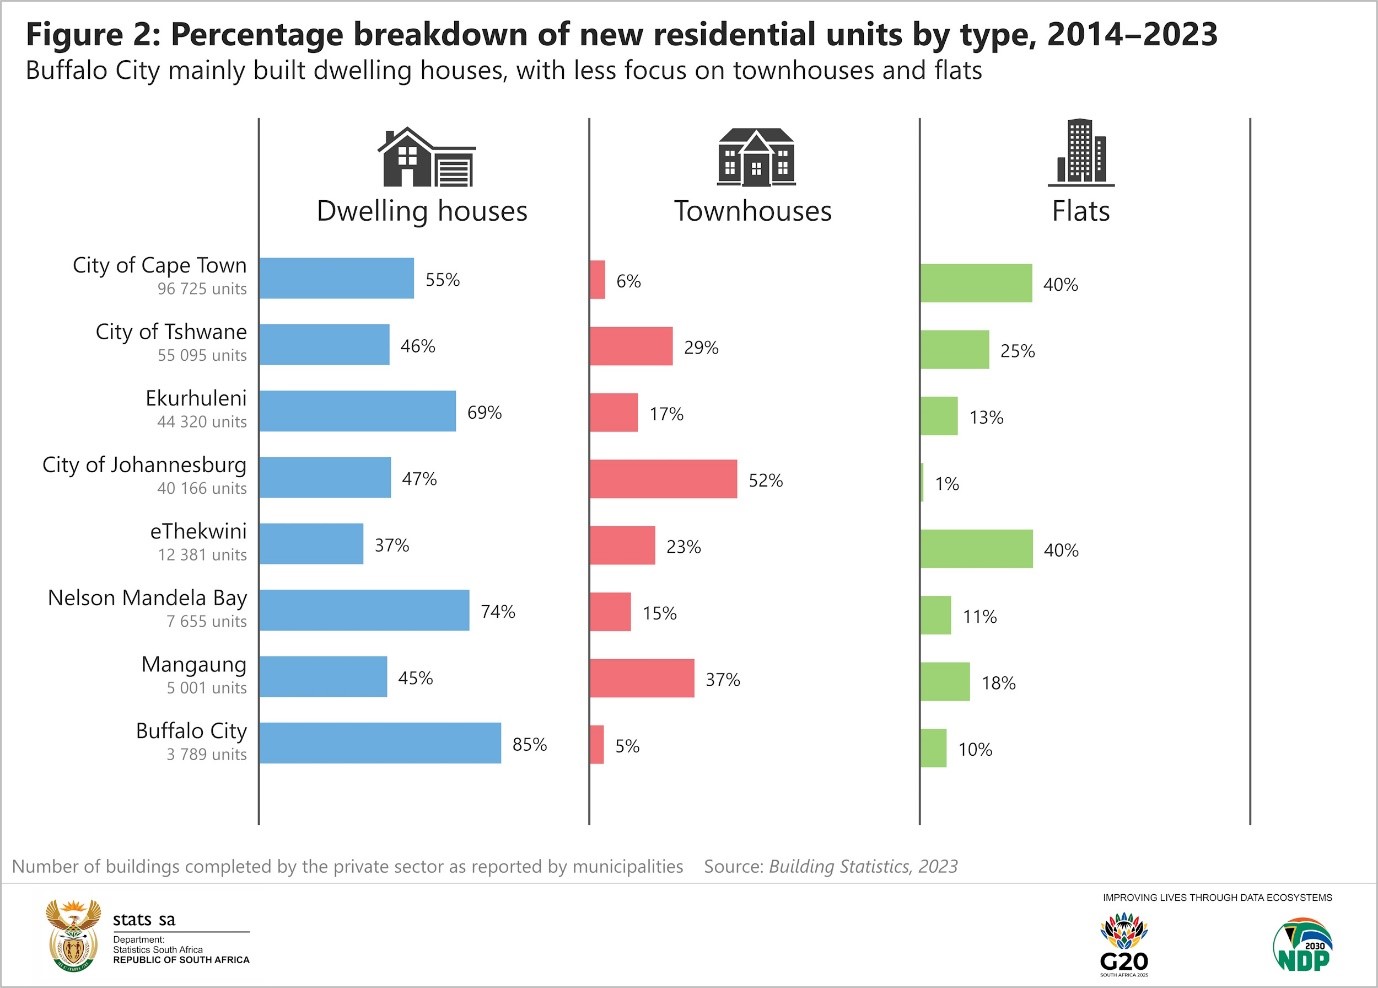
There was almost a half-and-half split between townhouses and dwelling houses in the City of Johannesburg. Townhouses also accounted for a notable share of new residential units in Mangaung and the City of Tshwane.
Strikingly, flats don’t seem to be popular in the City of Johannesburg, accounting for only 1% of new residential units. In contrast, flats accounted for 40% of new residential units in both the City of Cape Town and eThekwini.
The data tells a richer story if it’s plotted as a time series. Figure 3 highlights four metropolitan municipalities, providing a snapshot of some of the patterns in the data. The City of Cape Town witnessed a shift in residential development from dwelling houses to flats.
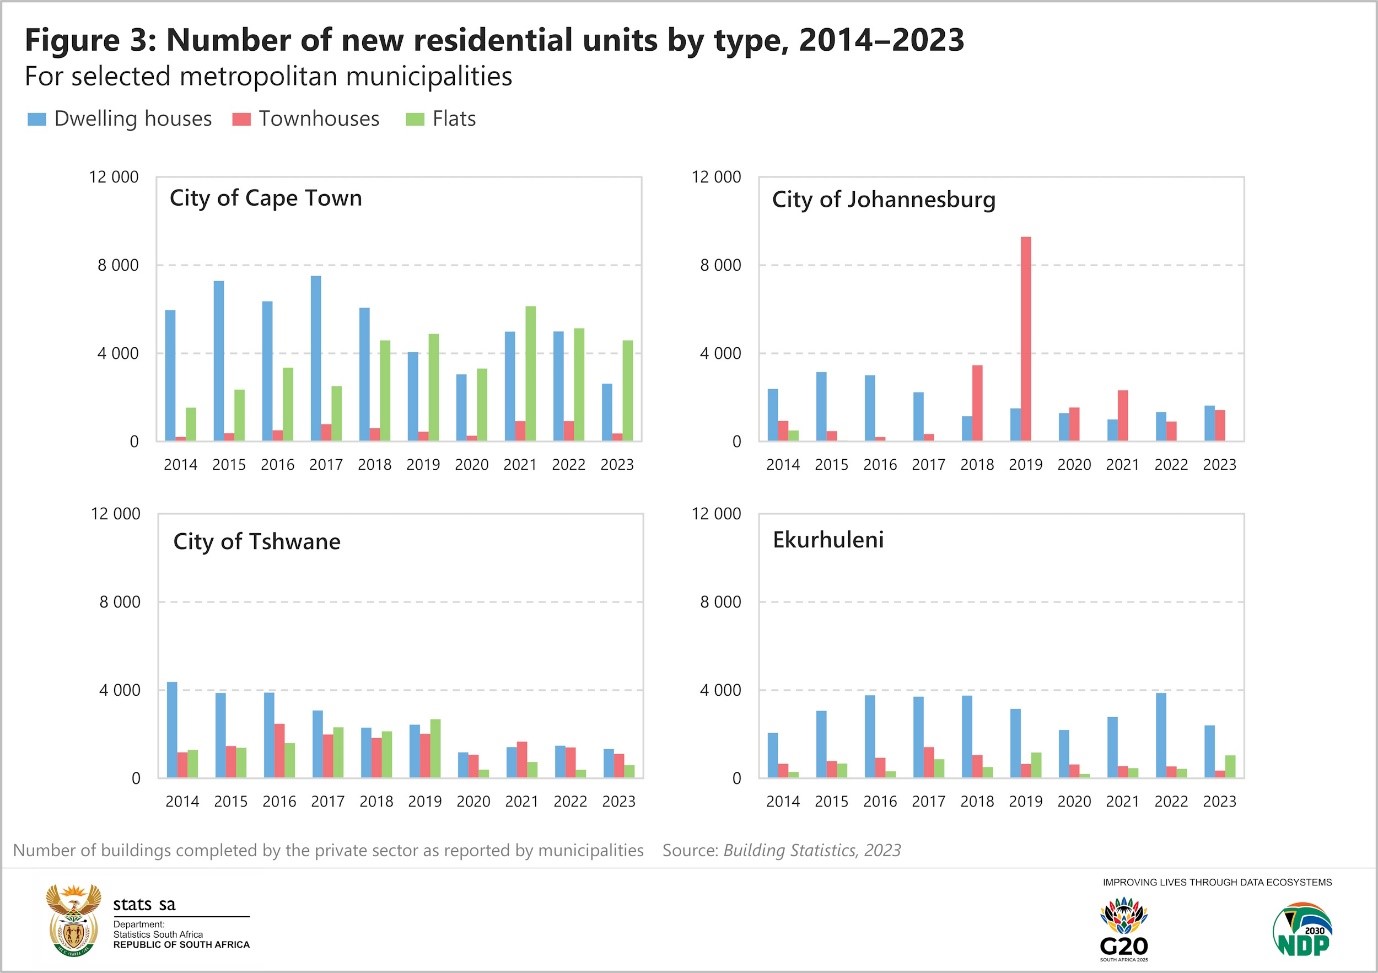
What is interesting about the City of Johannesburg is the spike in the number of completed townhouses in 2019. Since 2018, townhouses have accounted for a sizable share of private-sector residential development in the municipality.
The City of Tshwane witnessed a more equal mix of the three types in 2018 and 2019. Since the COVID-19 pandemic, however, overall development has struggled to return to pre-2020 highs.
The pattern in Ekurhuleni shows the dominance of dwelling houses across the decade.
For more information, download the Building statistics, 2023 statistical release and municipal data (in Excel) here.
1 The building statistics release only includes data from the private sector. Public-sector developments are excluded.
2 The analysis in this article only considers dwelling houses, townhouses and flats. It excludes data for other types of residential buildings such as boarding houses, hostels, institutions for the disabled and tourism accommodation (e.g. hotels, motels, guest-houses, holiday chalets, bed-and-breakfast accommodation and casinos).
Similar articles are available on the Stats SA website and can be accessed here.
For a monthly overview of economic indicators and infographics, catch the latest edition of the Stats Biz newsletter here.