

If you want to know what matters to the government, look at its budget. An analysis of audited financial statements for 705 government institutions highlights South Africa’s fiscal priorities.
General government spent R2,4 trillion in 2023/24,1 according to the latest Financial statistics of consolidated general government statistical release.2 The general public services category was the largest spending item, taking up 25% of total expenditure. This was followed by education (20%), social protection (15%) and health (12%).
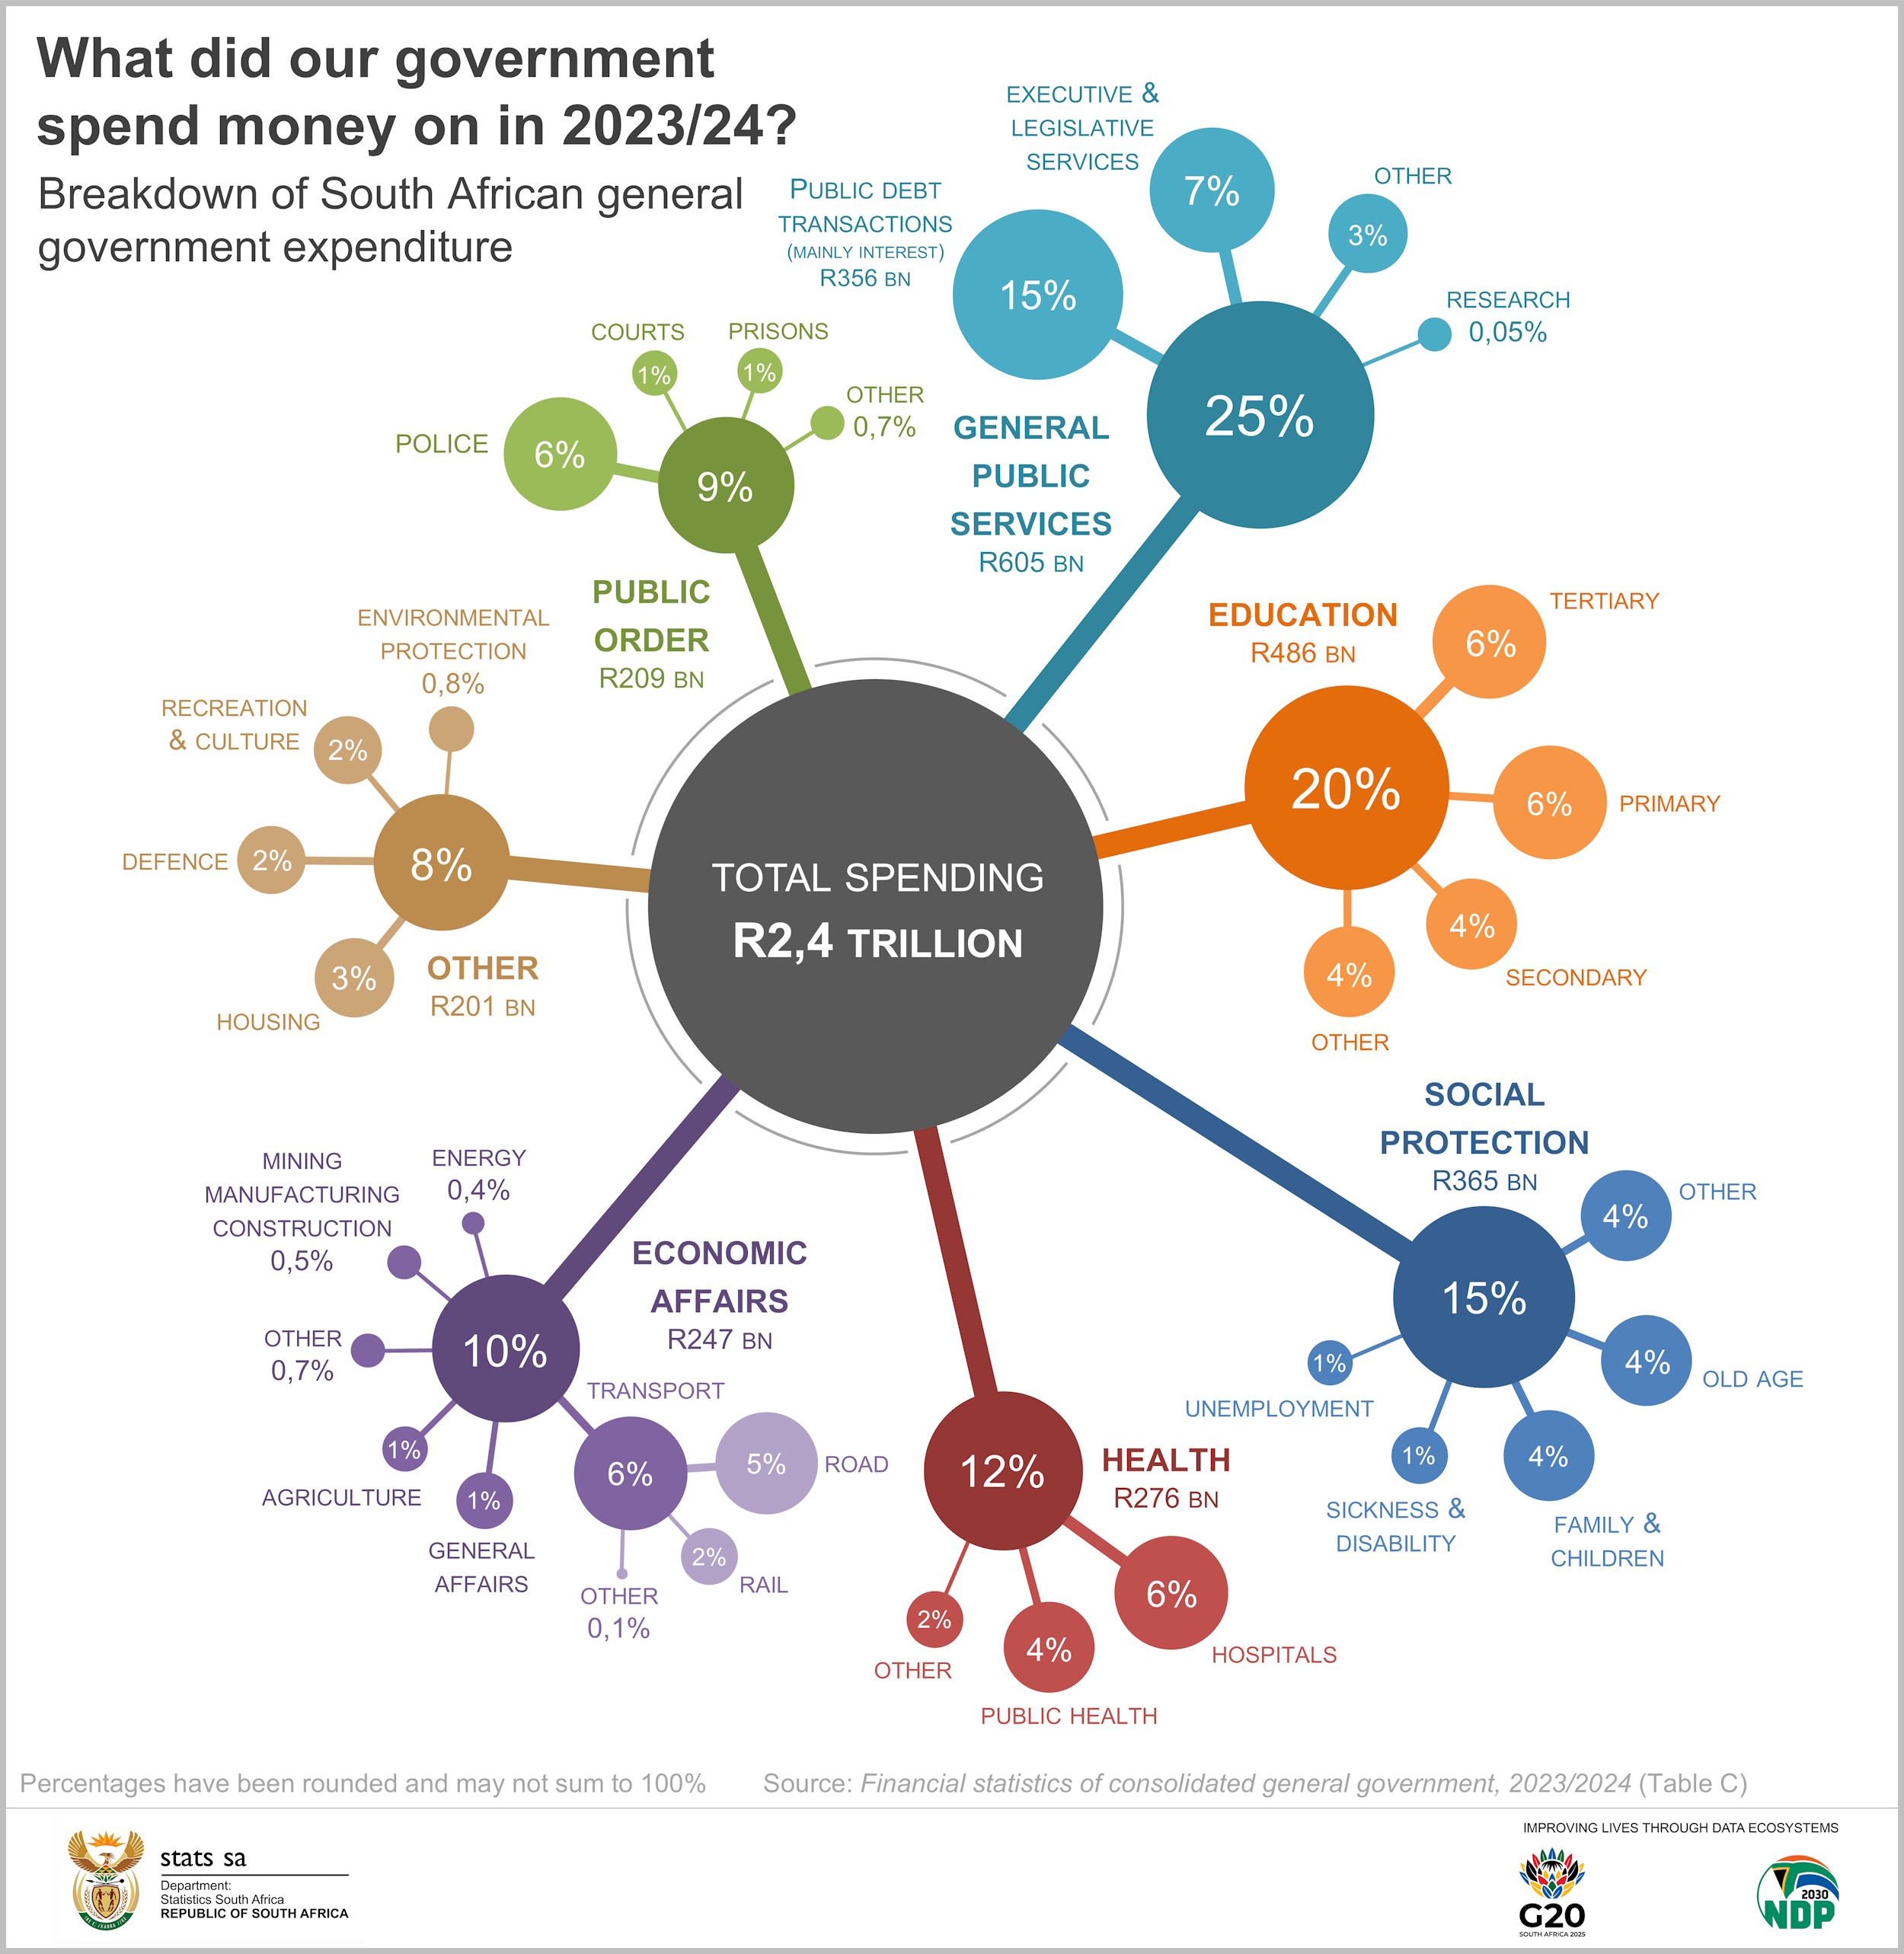
A closer inspection of general public services reveals public debt transactions as the significant cost driver. According to the National Treasury, the South African government held R5,3 trillion in gross loan debt in 2023/24.3 The costs related to servicing debt, which mainly includes interest payments on borrowings, amounted to R356 billion, or 15% of total spending (or to be more precise, 14,9%). Compared with other government priorities, the category of public debt transactions exceeded the amount allocated to health (R276 billion) and was almost on par with social protection (R365 billion).
The debt-servicing bill was the most significant contributor to the rise in expenditure in 2023/24. Government spending grew by a net R139,3 billion compared with the previous year. The matrix below shows the line items that increased expenditure (in orange/brown), and those that decreased it (in blue).
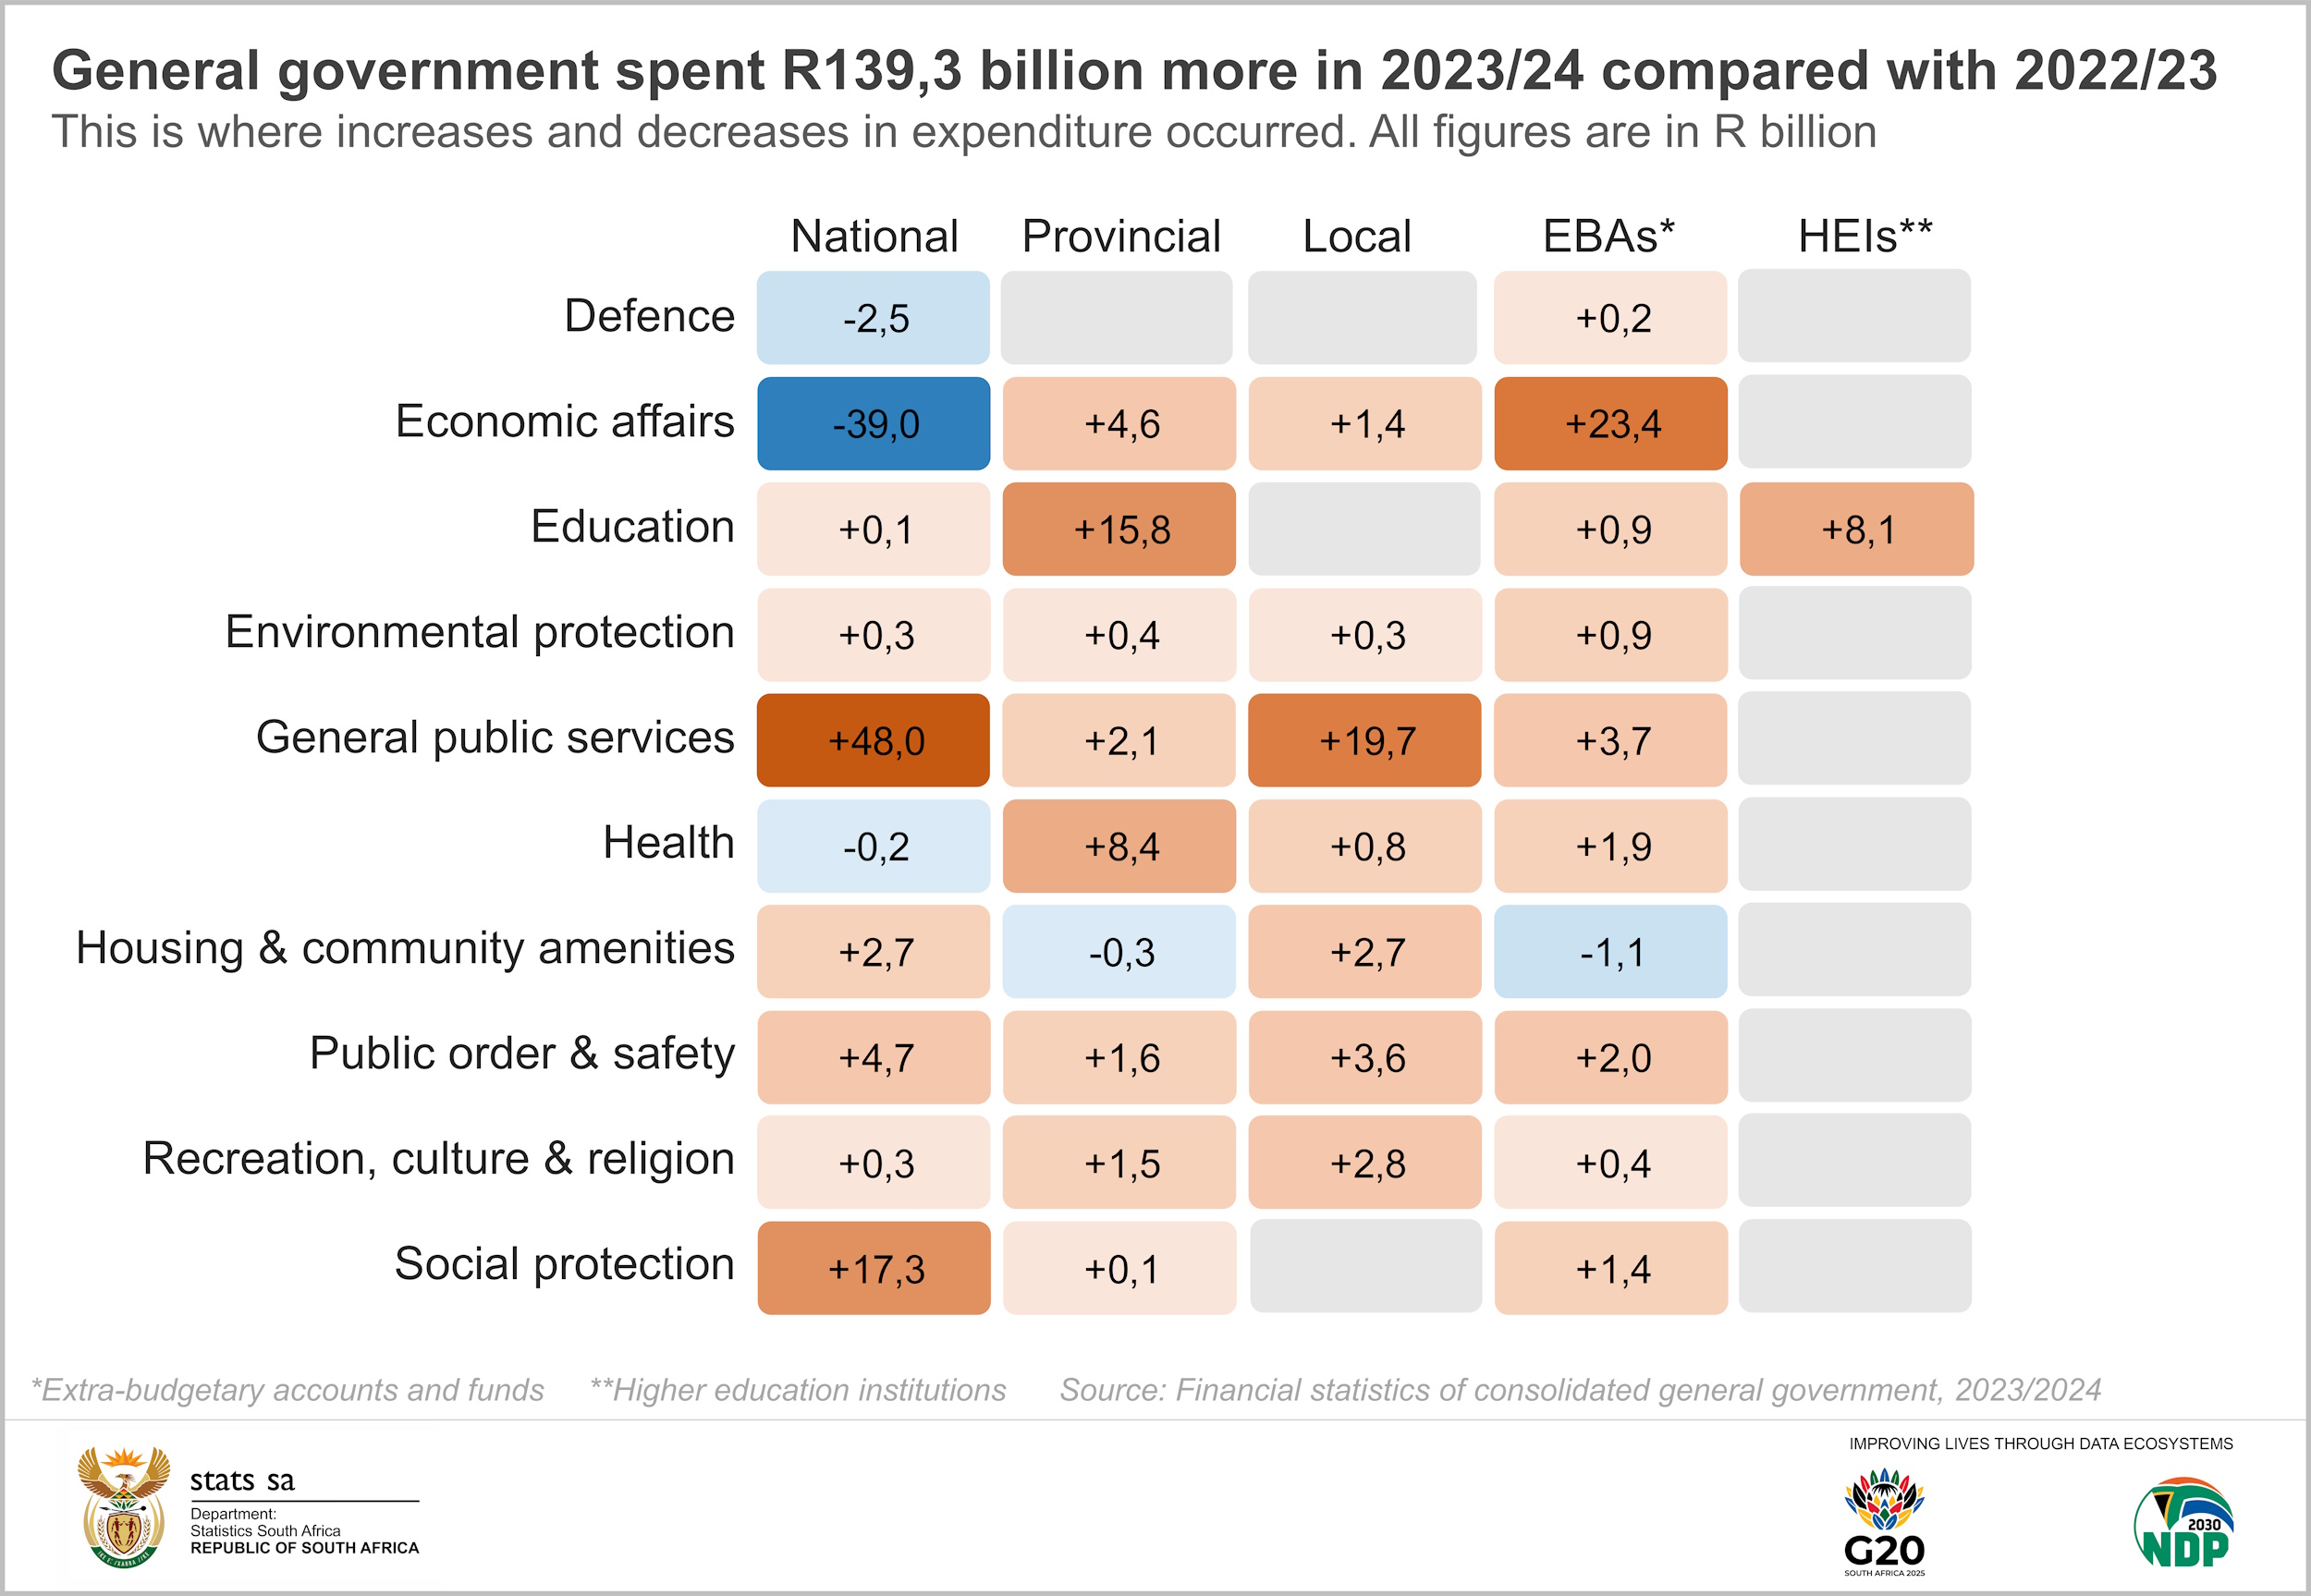
National government spending in the general public services category expanded by R48,0 billion, driven mainly by a R47,7 billion rise in public debt transactions.
Extra-budgetary accounts & funds registered a rise of R23,4 billion in economic affairs. This was mainly due to increased spending on railway and road transport. Local municipalities recorded an additional R19,7 billion in public services. The national government spent more on old age, family & children and disability grants, contributing to the rise of R17,3 billion in social protection.
The largest decrease was recorded by the national government in economic affairs (R39,0 billion). The decline was mainly due to the base effect, following a once-off capital transfer to ESKOM the year before.
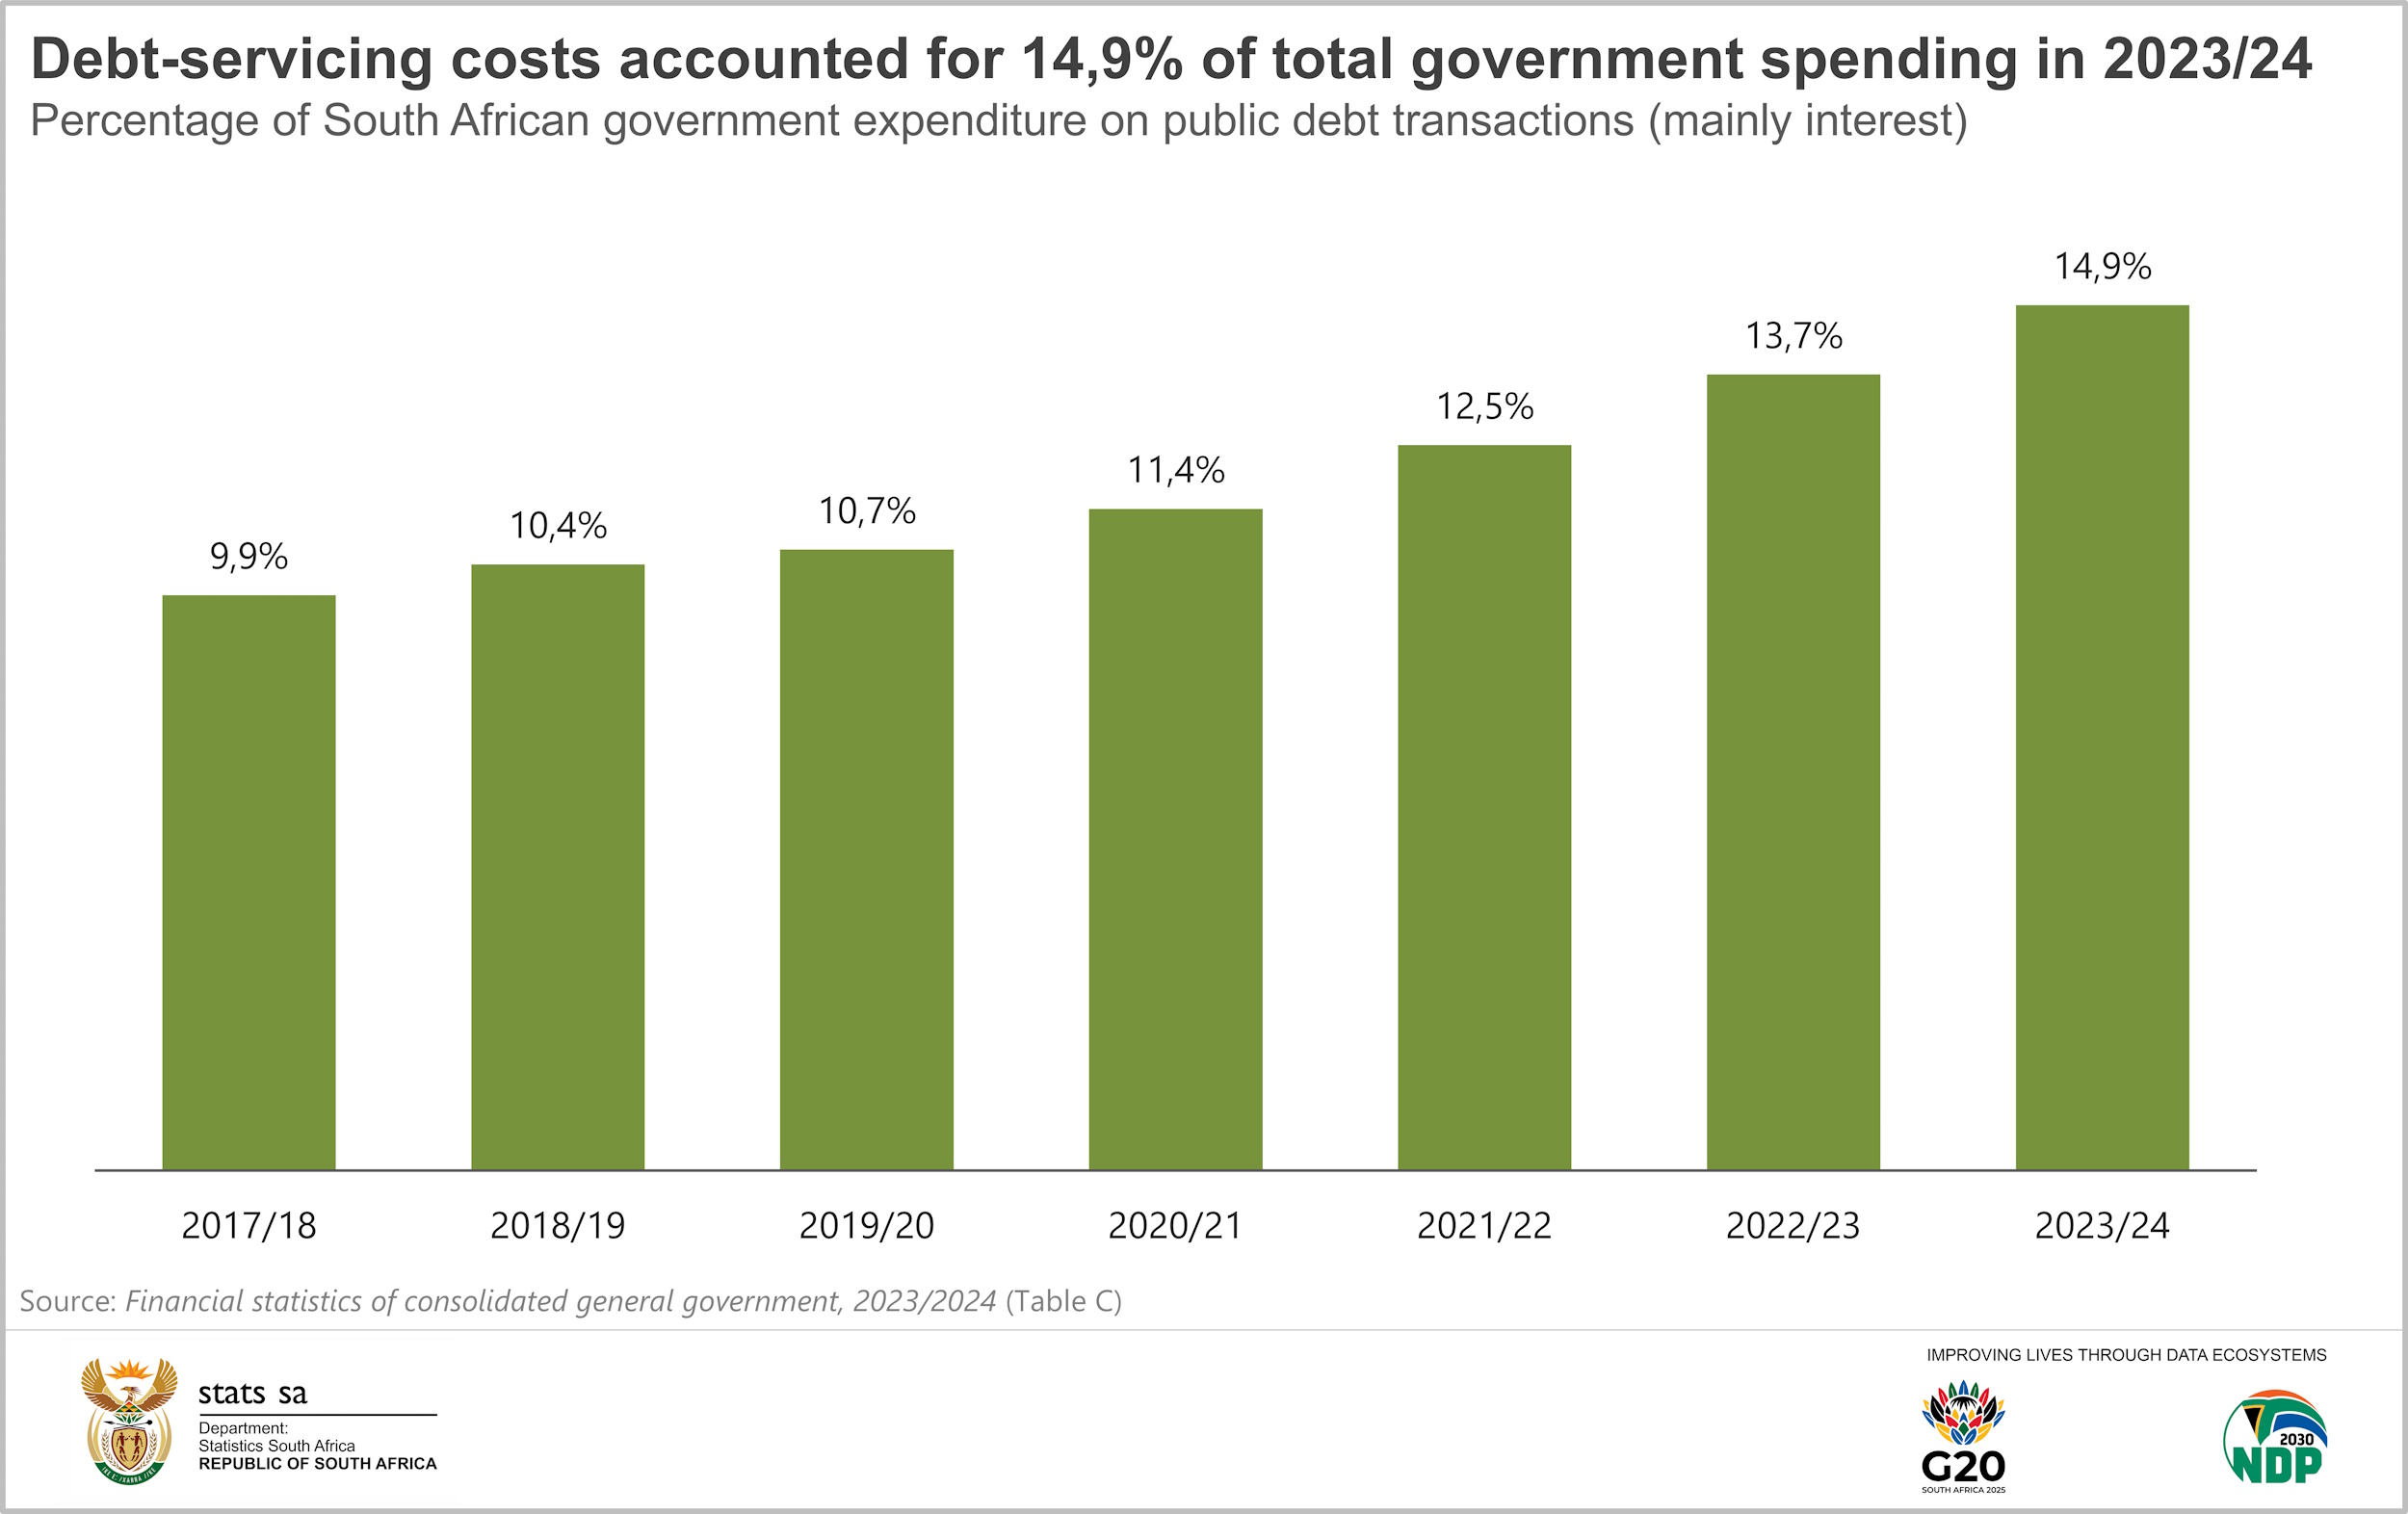
Revisiting public debt payments: the sharp rise in 2023/24 pushed its contribution to total spending higher from 13,7% in 2022/23 to 14,9%. A time series shows how the costs of servicing debt have progressively eaten away at the spending pie.
For more information, download the 2023/24 Financial statistics of consolidated general government statistical release and time series data here.
1 Total expenditure also includes capital expenditure.
2 When interpreting these figures, note that the data published in the Financial statistics of consolidated general government statistical release (a) are adjusted for the reference period 1 April – 31 March; (b) are converted from an accrual basis of recording to a cash basis of recording in order to compare across all levels of government; and (c) are classified according to the 2014 edition of the Government Finance Statistics Manual.
3 National Treasury. 2025 Budget Review, Table 7.7 (download here).