
Mighty oaks from little acorns grow
Forestry & logging is the second smallest of 16 industries covered by Stats SA’s structural industry surveys. To get a sense of scale, manufacturing – the biggest of the 16 – is 82 times larger if income is used as a measure.
Despite its relatively small size, forestry & logging produces essential raw materials used elsewhere in the economy. It also contributes to employment and income, according to Stats SA’s recent Forestry, logging and related services industry statistical report – the latest in the structural industry series.1
The industry as a generator of income
Forestry & logging generated income of R32,1 billion in 2023, up from R24,2 billion in 2019 (Figure 1). Although it is much smaller than manufacturing (R2,6 trillion)2, it is larger than the smallest of the 16 industries – ocean (marine) fisheries – which generated income to the value of R19,9 billion.3
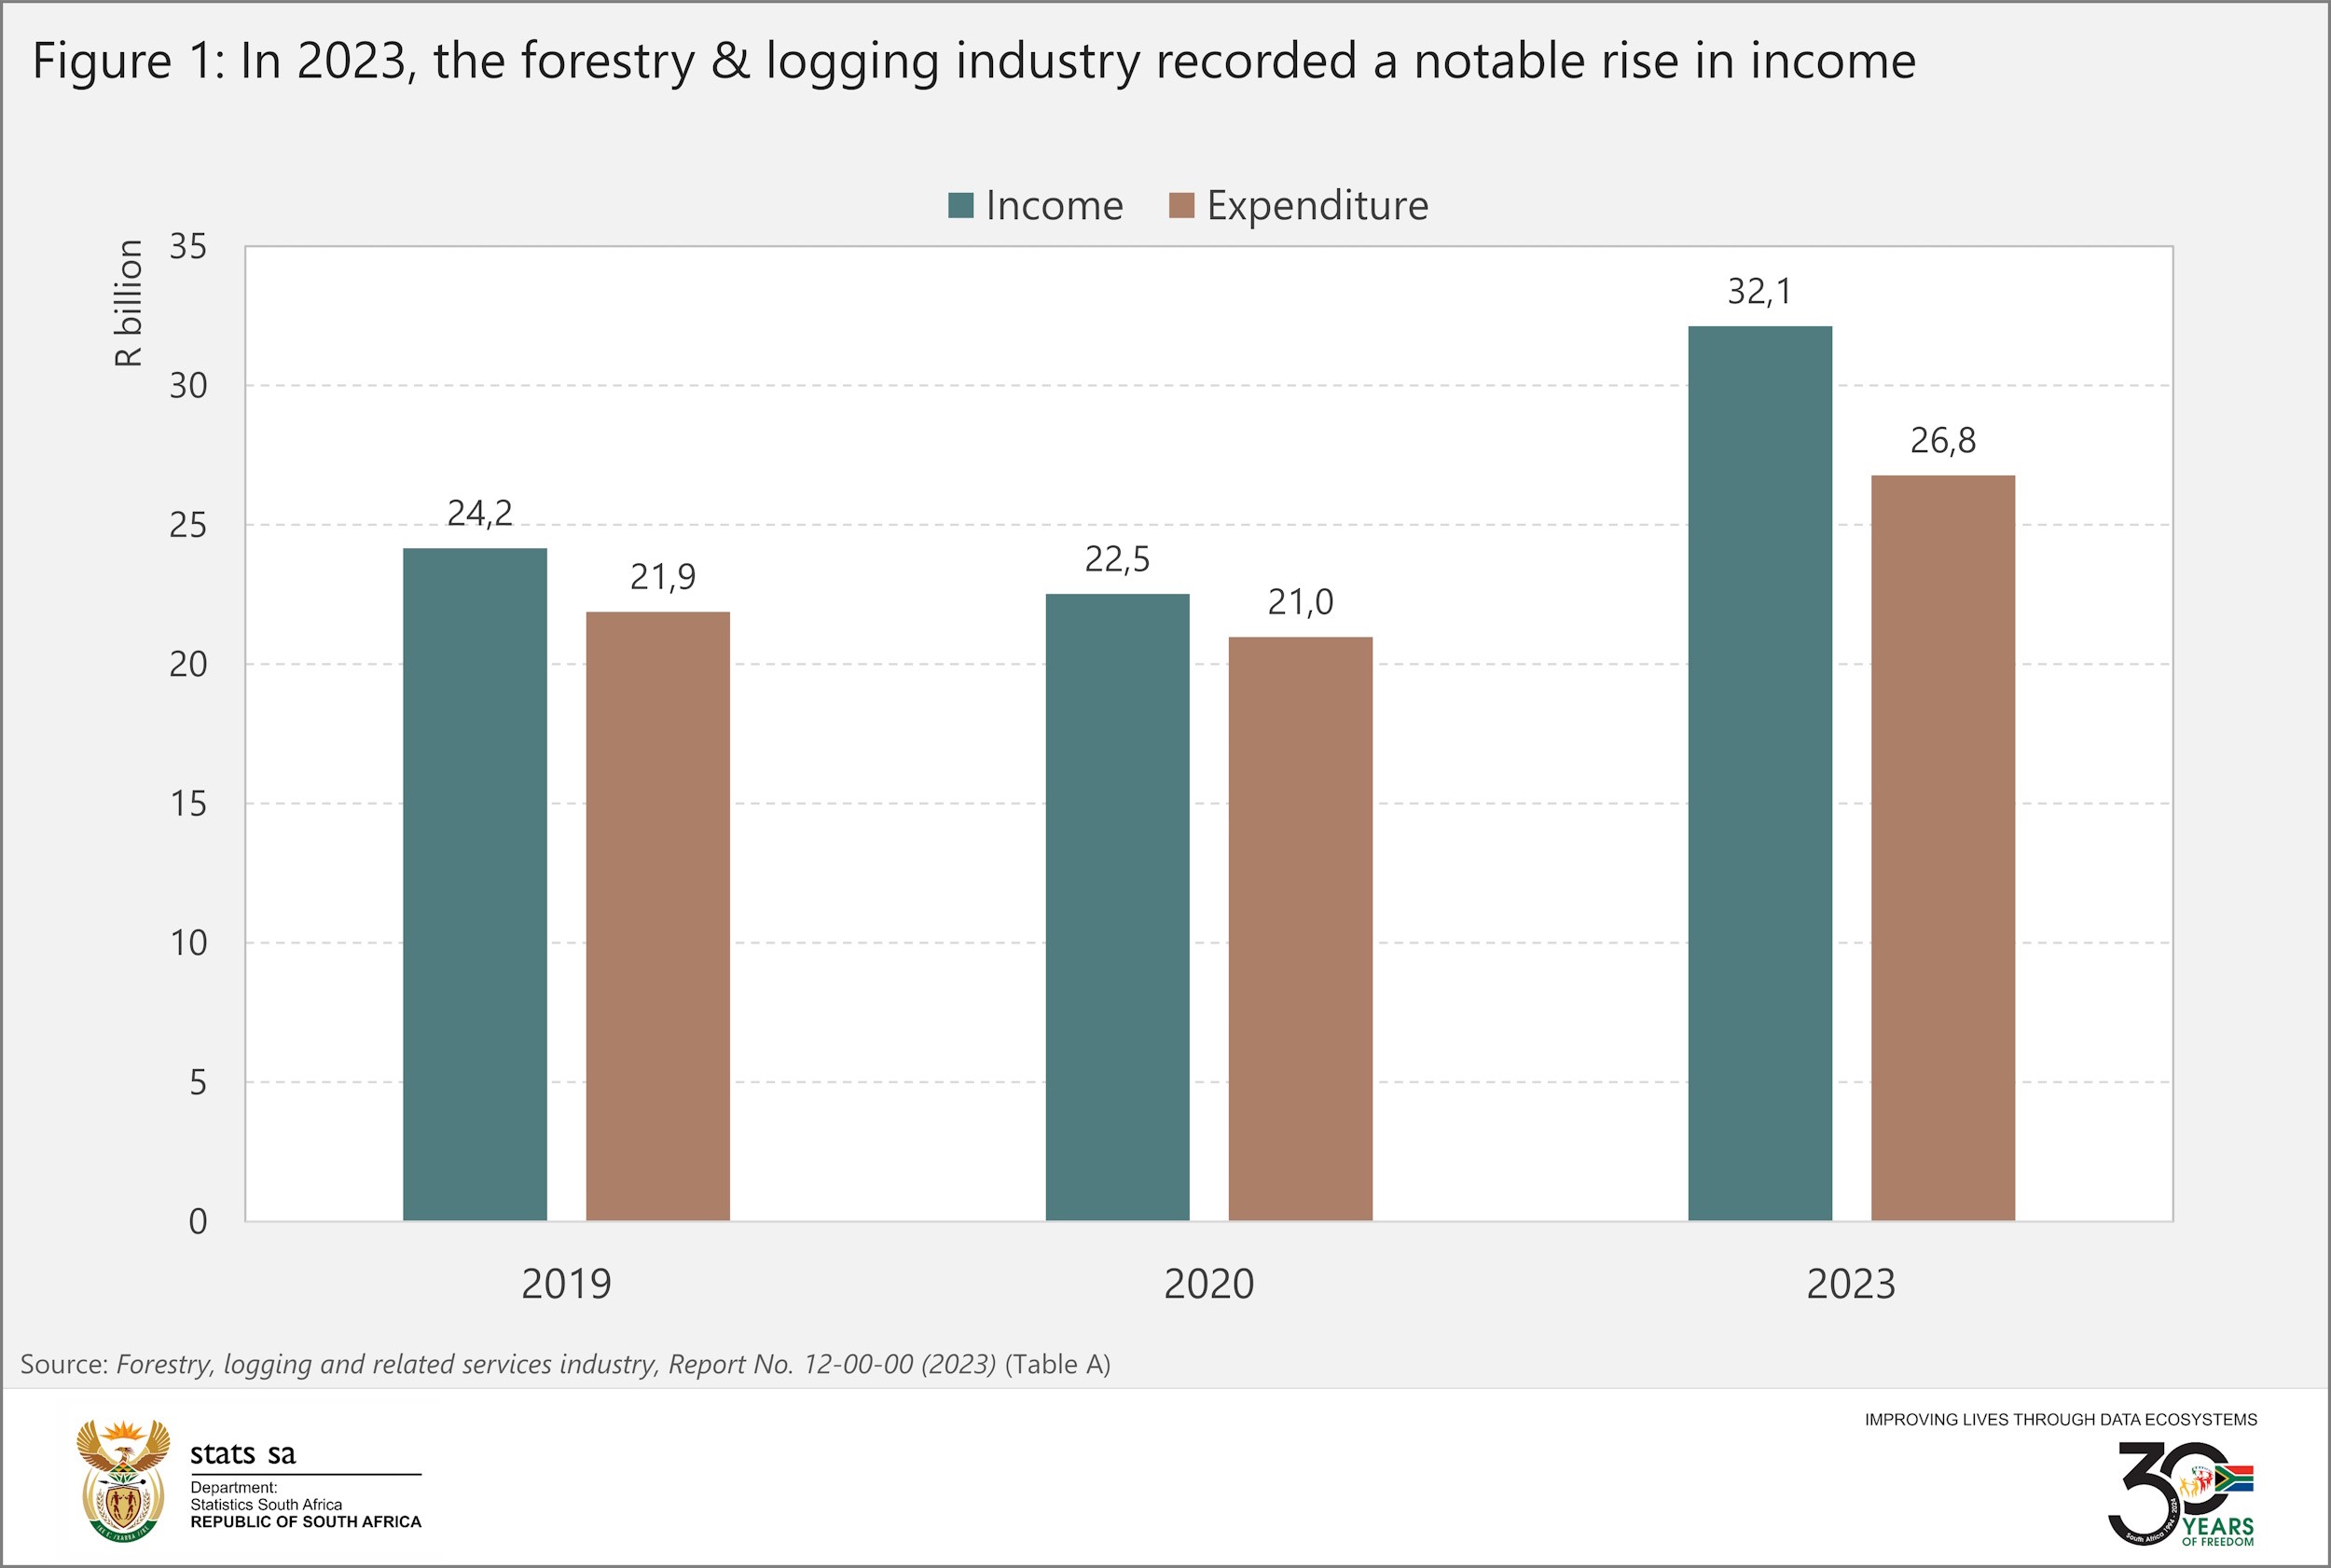
Forestry-related activities dominate the industry, generating R91 of every R100 of income in 2023. The remaining R9 was created by logging-related activities.
The industry as a source of employment
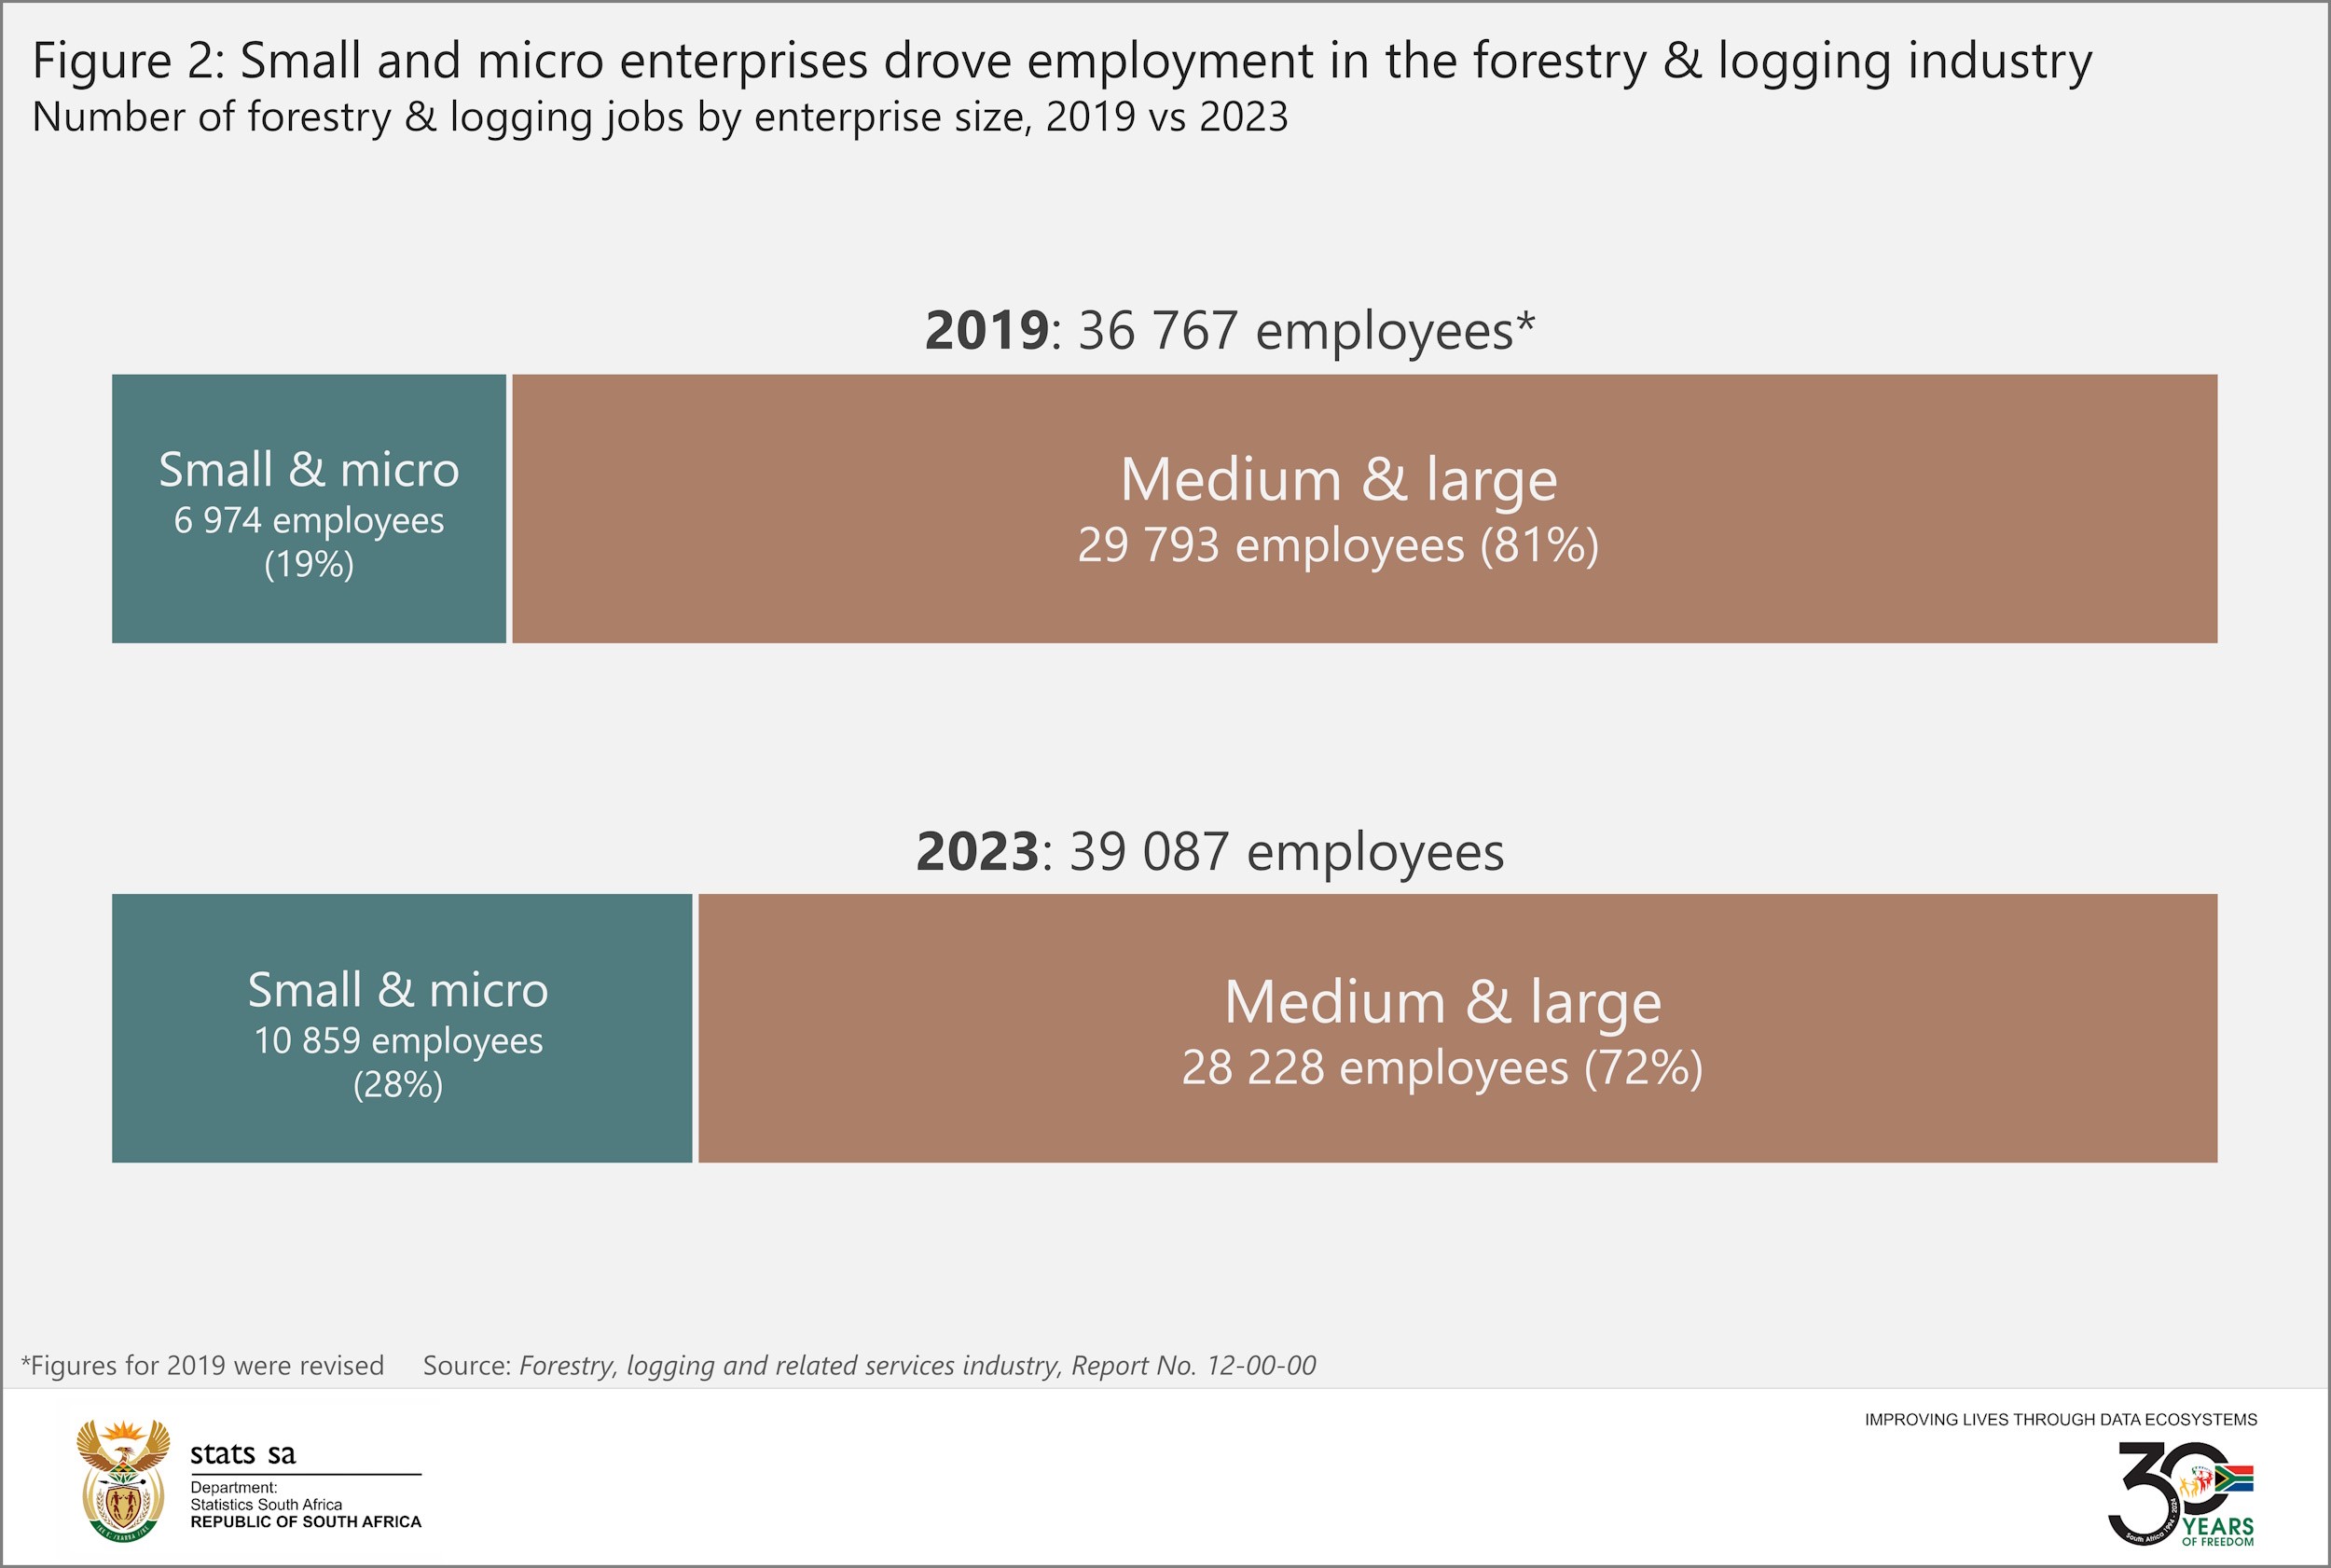
With unemployment a stark reality in South Africa, any industry creating jobs – however small – deserves recognition. Forestry & logging has made modest gains, growing its workforce from 36 767 individuals in 2019 to 39 087 in 2023.
Small and micro enterprises drove this increase. If we compare with other industries, forestry & logging is dominated by large and medium enterprises.4 Despite this, small and micro enterprises created 3 885 jobs in the 2019–2023 period. Medium & large enterprises lost 1 565 employees (Figure 2). This pushed the employment contribution of small and micro enterprises up from 19% in 2019 to 28% in 2023.
Forestry & logging jobs are concentrated in two provinces. KwaZulu-Natal is home to half of those employed, while a further 43% are in Mpumalanga.
The industry as a provider of raw material
Forestry & logging provides crucial inputs to sectors further along in the supply chain. Agriculture, manufacturing, construction and mining are the largest industrial users of wood materials, according to Stats SA’s latest supply and use tables (SUTs).5 In this context, wood materials include sawn and rough wood, boards, panels, sheets, plaiting materials, boxes, cork and straw.
These industries use wood materials in their production processes, often to create other products. Manufacturing, for example, produces wood-related products and paper. This activity supported almost 100 000 jobs in 2021, generating R161,5 billion in income.6
Households and the informal sector also depend on wood as a resource, according to the SUTs.
Figure 3 shows the products that forestry & logging provides. Sales of goods accounted for 77% (or R24,8 billion) of total income in 2023. Sales were dominated by processed timber (sawmill products), followed by wood products and ‘other’ sales.
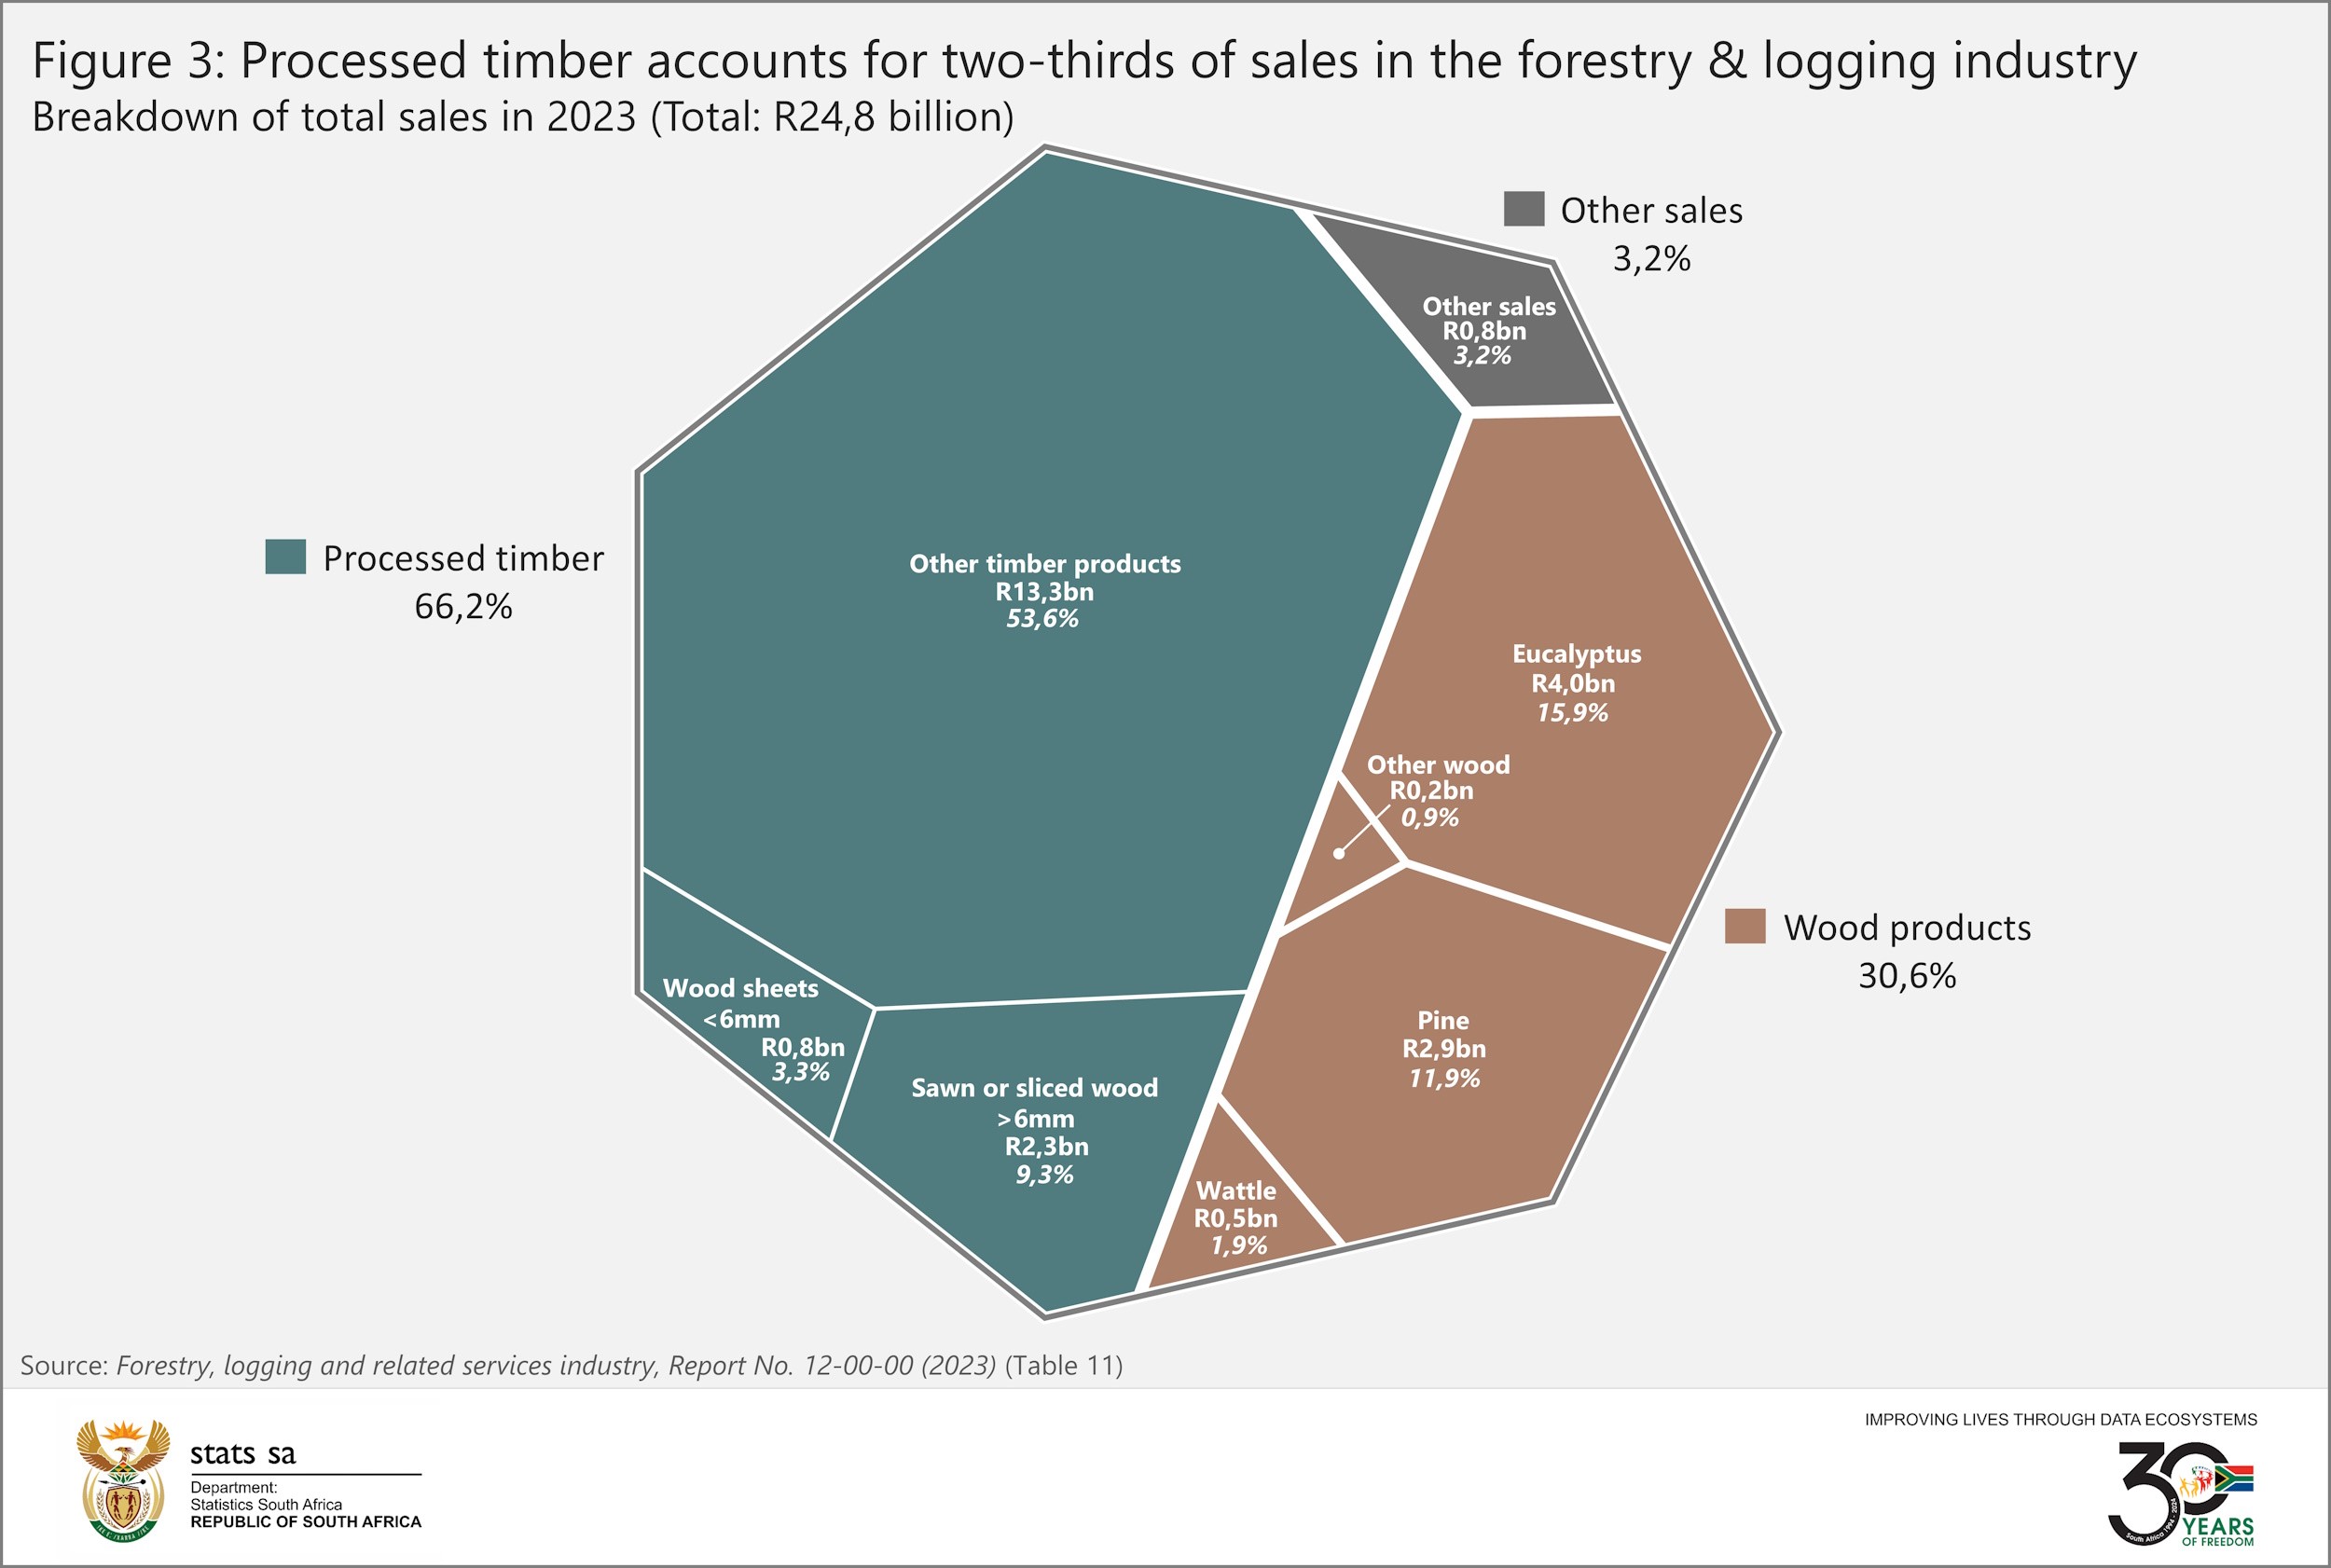
‘Other’ timber products, which accounted for just over half of total sales, mainly includes charcoal, sterilised wood pulp and paper. In terms of wood products, eucalyptus generated the most income, followed by pine and wattle. Drilling a little deeper into the report shows pulpwood as the dominant eucalyptus product, while saw logs is the main product produced from pine.
For more information, download the 2023 Forestry, logging and related services industry statistical report, Excel data and media presentation here.
1 Note: the report covers enterprises registered for value-added tax (VAT). Forestry & logging activities excludes manufacturing of wood products, publishing and printing.
2 Stats SA, Manufacturing industry: Financial, Report No.: 30-02-03 (2021) (Table A) (download here).
3 Stats SA, Ocean (marine) fisheries and related services industry, Report No. 13-00-01 (2023) (Table A) (download here).
4 Stats SA, Are South African industries dominated by a few firms? (Figure 3) [18 December 2024] (read here).
5 Stats SA, Supply and Use Tables 2020-2021 Excel file (download here).
6 Stats SA, Manufacturing industry: Financial, Report No.: 30-02-03 (2021) (Tables A and D) (download here).
Similar articles are available on the Stats SA website and can be accessed here.
For a monthly overview of economic indicators and infographics, catch the latest edition of the Stats Biz newsletter here.