
GDP weakens in the third quarter
After two consecutive quarters of growth, South African real gross domestic product (GDP) contracted by 0,2% in the third quarter (July–September) of 2023.1 The contributions to the performance of the economy were evenly spread between the industries on the production side of the economy. The contributions ranged from -0,3 of a percentage point to +0,1 of a percentage point.
Agriculture, manufacturing and construction disappoint
On the production (supply) side of the economy, five of the ten industries recorded weaker results, with agriculture, manufacturing and construction the biggest drags on growth (Figure 1).
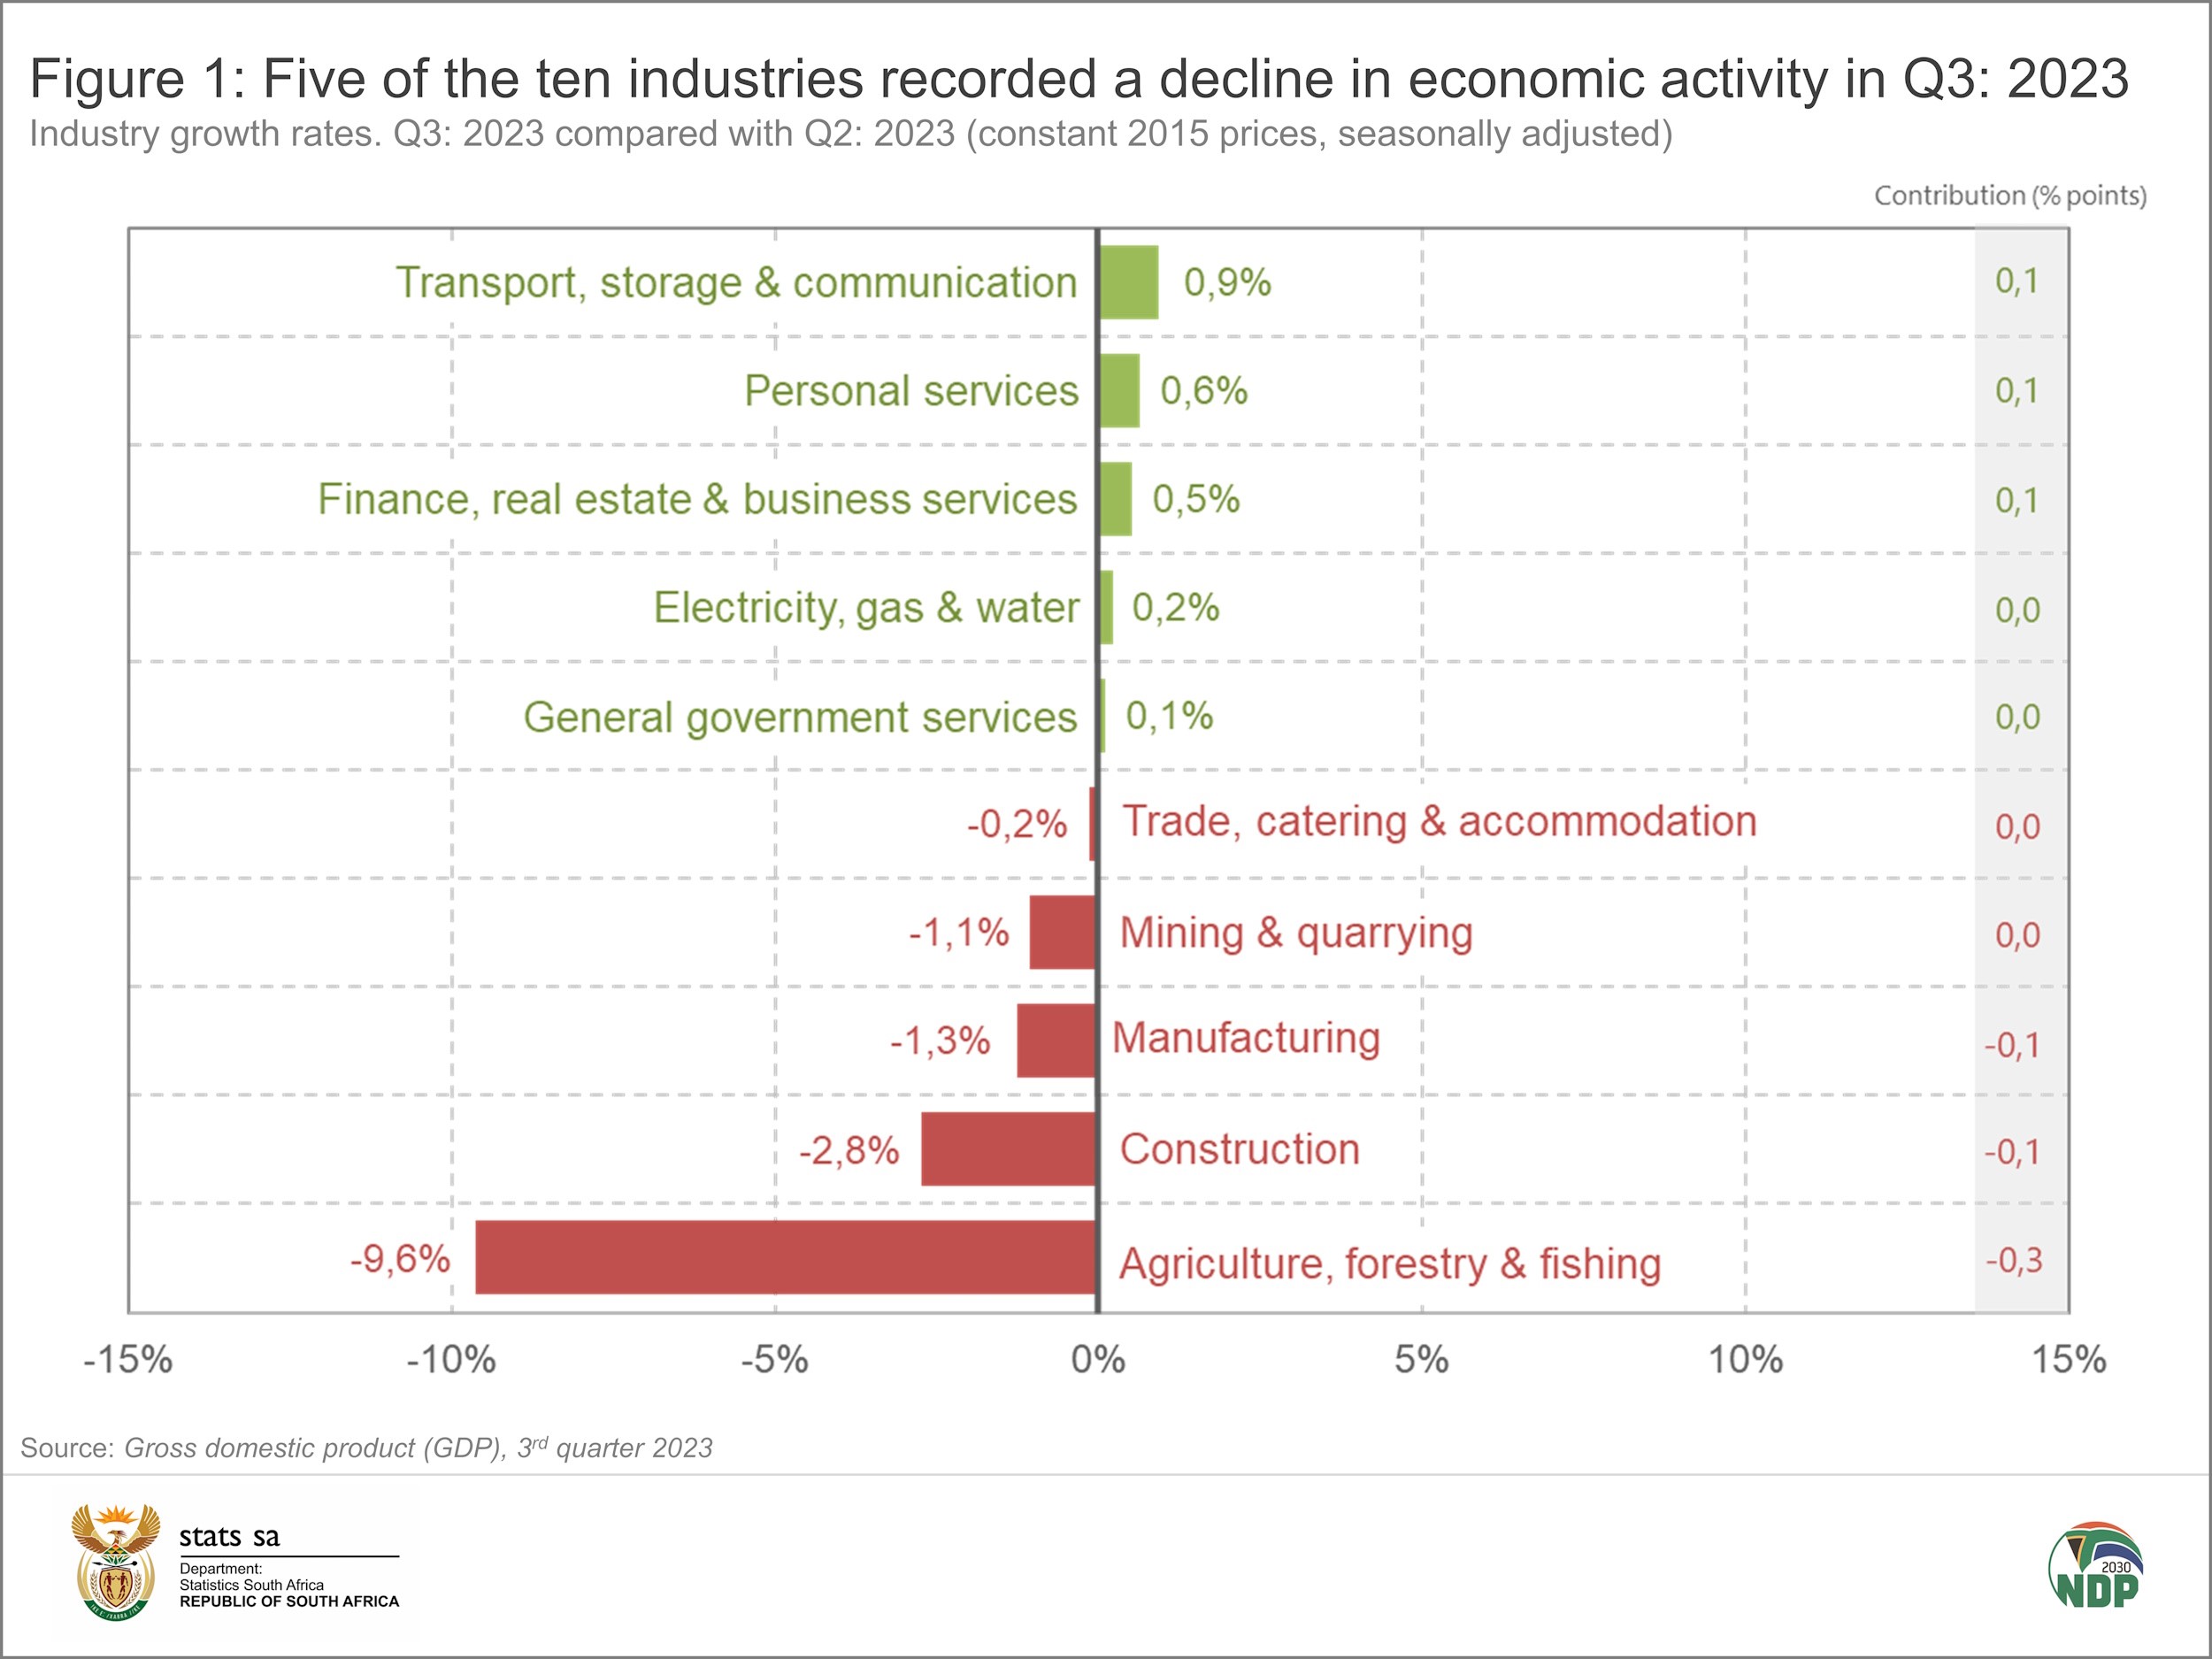
The agriculture industry declined by 9,6%, driven lower mainly by field crops, animal products and horticulture products. The industry encountered several headwinds in the third quarter, including the outbreak of avian flu and the floods in Western Cape.
Weaker demand saw manufacturing production decline by 1,3%. The food & beverages and petroleum & chemical divisions were the biggest drags on manufacturing growth in the third quarter. The outbreak of avian flu had a negative impact too, affecting the production of chicken-related products.
The construction industry weakened further, recording a second consecutive quarter of decline. Decreased activities were reported for residential buildings, non-residential buildings and construction works.
Mining production declined by 1,1%, with downward pressure from platinum group metals, gold, ‘other’ metallic minerals and manganese ore.
Weaker activity from agriculture and manufacturing had a knock-on effect on wholesale trade, contributing to a 0,2% decline in the trade, catering & accommodation industry. Motor trade and restaurants, catering & fast-food were also weaker in the quarter. However, tourist accommodation and retail trade were stronger, but not enough to lift the industry into positive territory.
On the upside, finance, real estate & business services, personal services and transport, storage & communication were the largest positive contributors to GDP growth. Transport, storage & communication expanded by 0,9%, buoyed by increased economic activity in land transport, air transport, transport support services and communications. Road freight was the exception, however, recording a decline in the quarter.
After five consecutive quarters of decline, the electricity, gas & water supply industry grew by 0,2%. This was on the back of increased electricity generation. The country experienced less intense load shedding in the third quarter, racking up only 20 days of stage 5 and stage 6 load shedding. This is lower than the 46 days recorded in the second quarter, according to The Outlier and EskomSePush.2 Water consumption, however, was down in the second quarter because of water restrictions in various municipalities.
Investments in machinery and equipment weaken in the third quarter
Stats SA also measures the expenditure side of GDP, providing an indication of total demand in the economy. This includes measures of government consumption, household consumption, investment (gross fixed capital formation and changes in inventories), and net exports.
Investments in machinery and equipment shrank by 3,2% in the third quarter, contributing negatively to gross fixed capital formation (Figure 2).
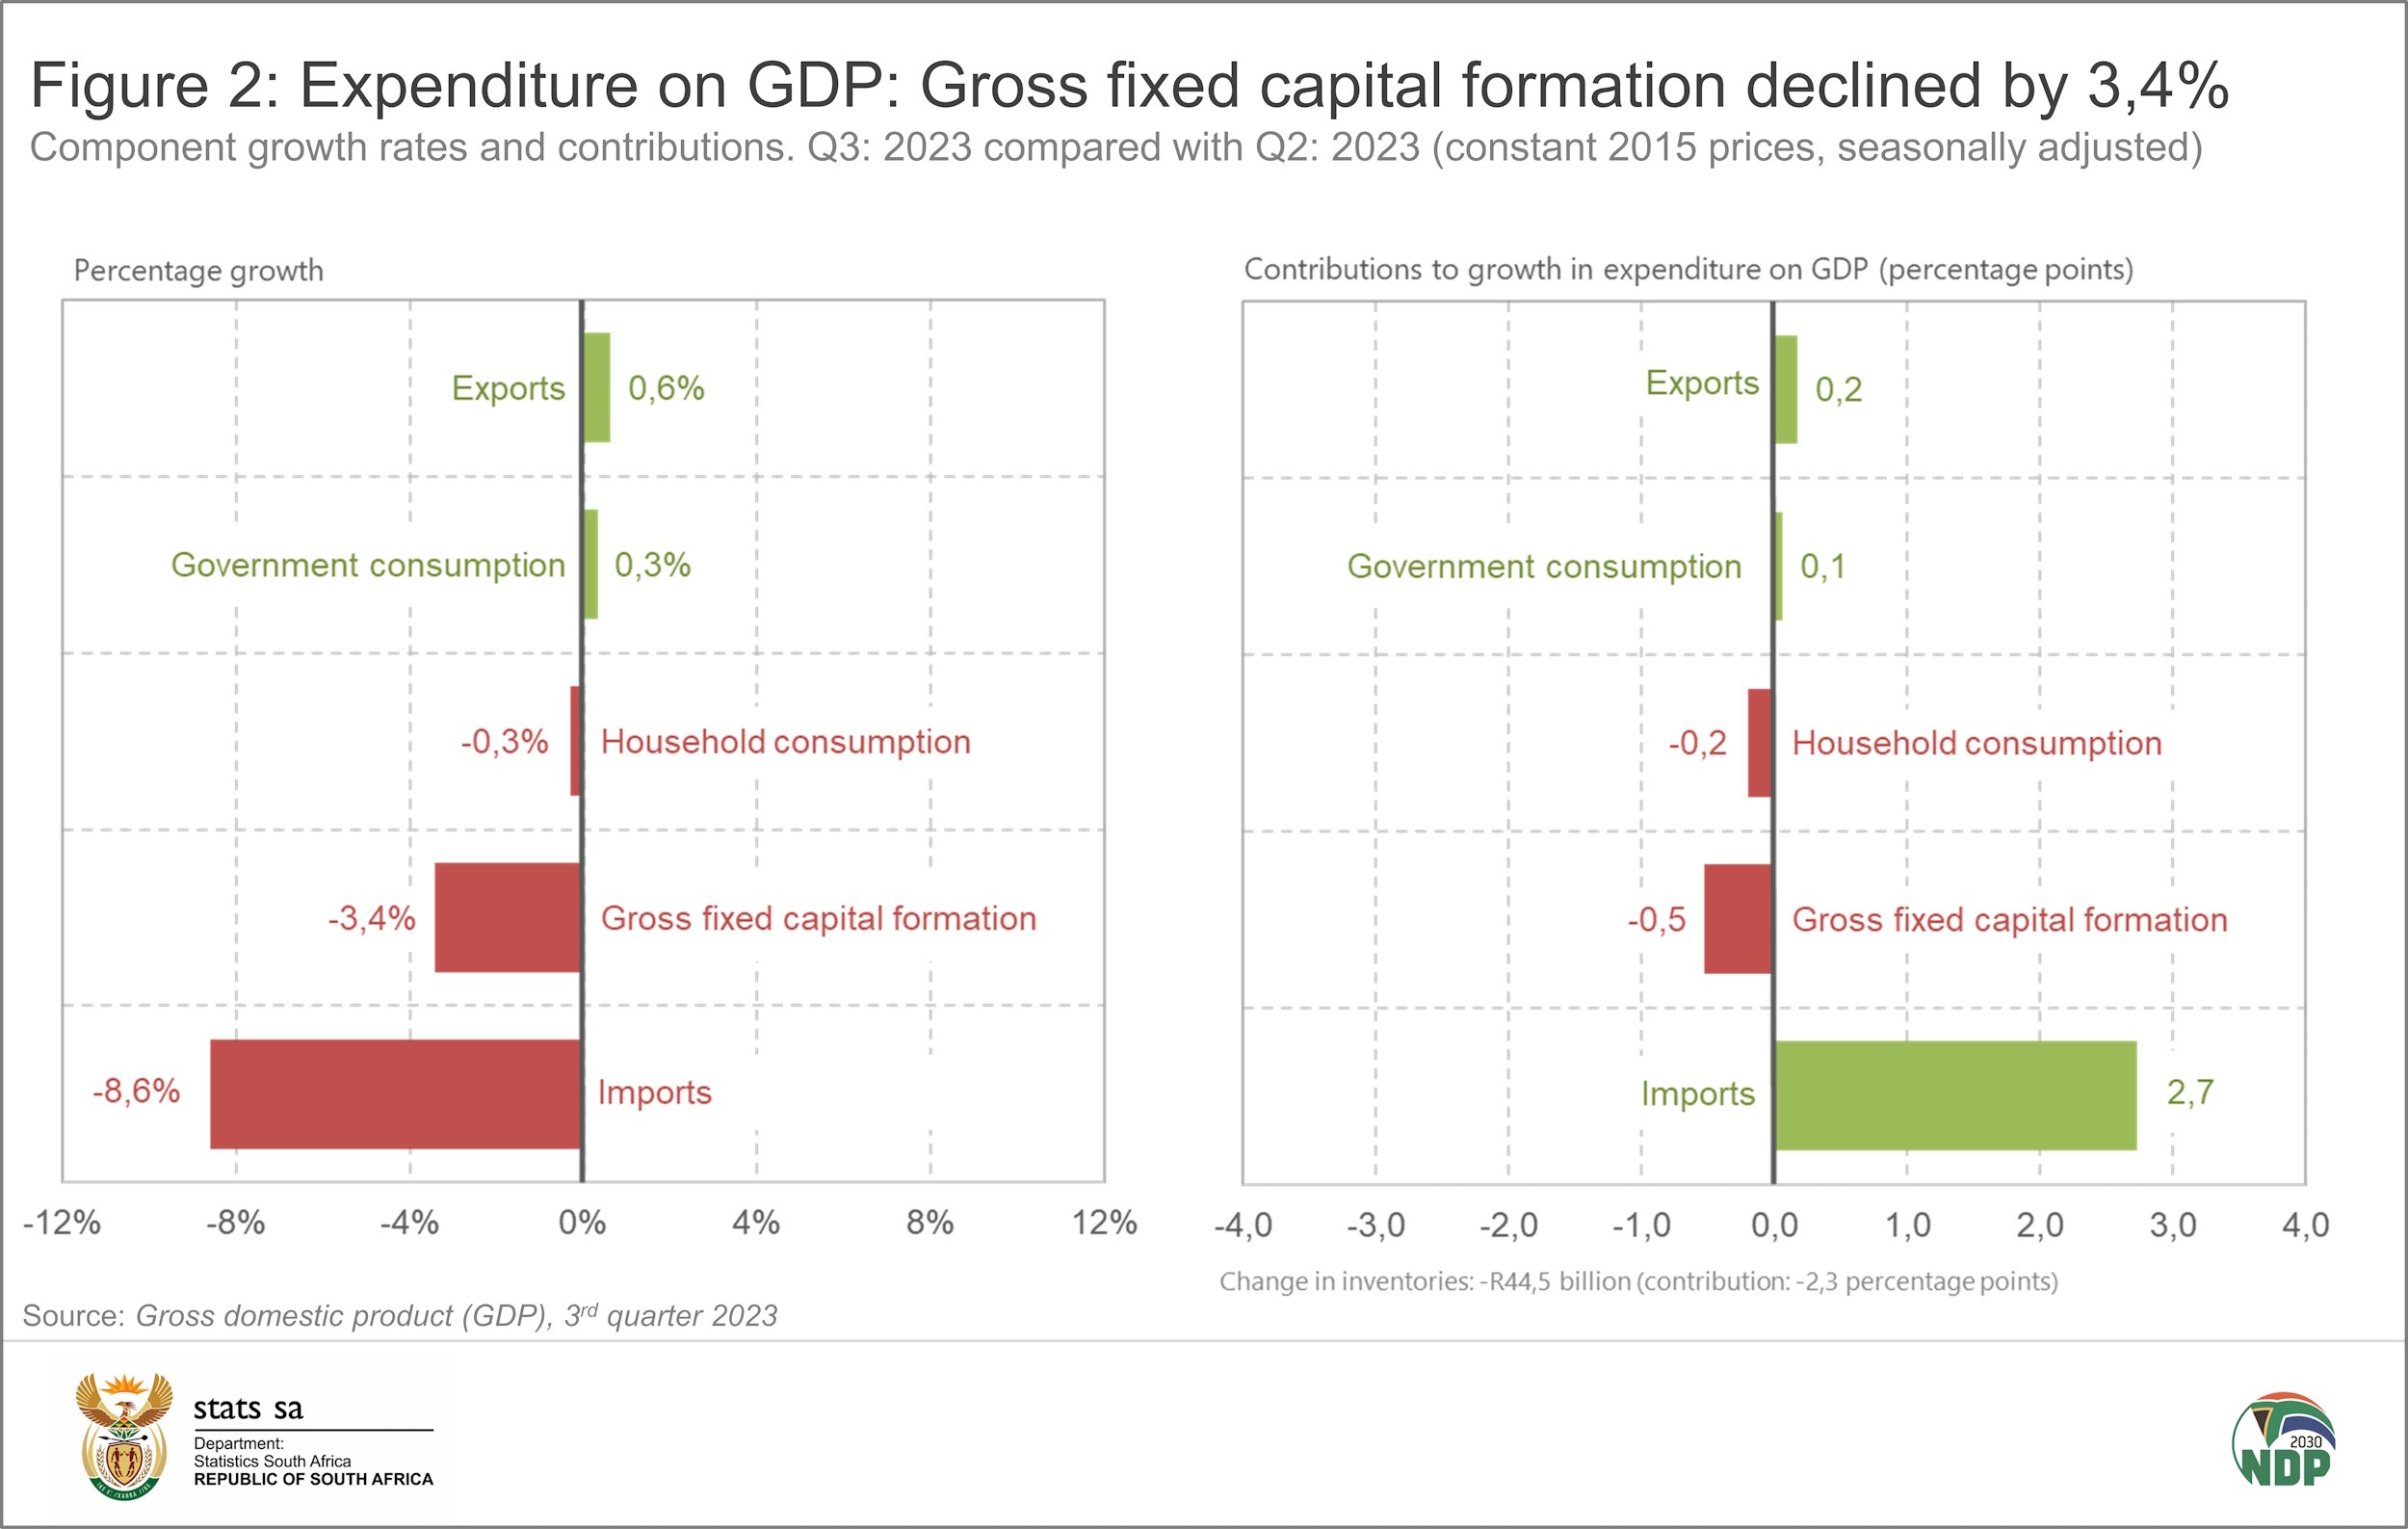
This follows a sharp rise in investments in imported machinery and equipment in the second quarter, which included products related to renewable energy.3 The country invested R303 billion in machinery and equipment in the second quarter, up from R273 billion in the first quarter. This spike was short-lived, with investments in machinery and equipment pulling back in the third quarter to R293 billion.
The pull-back in demand for machinery and equipment contributed to the 8,6% decline in imports. There were also decreases in imports of chemical products, resins & plastics, base metals & articles of base metals, vegetable products and vehicles & transport equipment.
The country exported slightly more in the third quarter, largely influenced by increased trade in vehicles & transport equipment; pearls, precious & semi-precious stones; precious metals; and vegetable products.
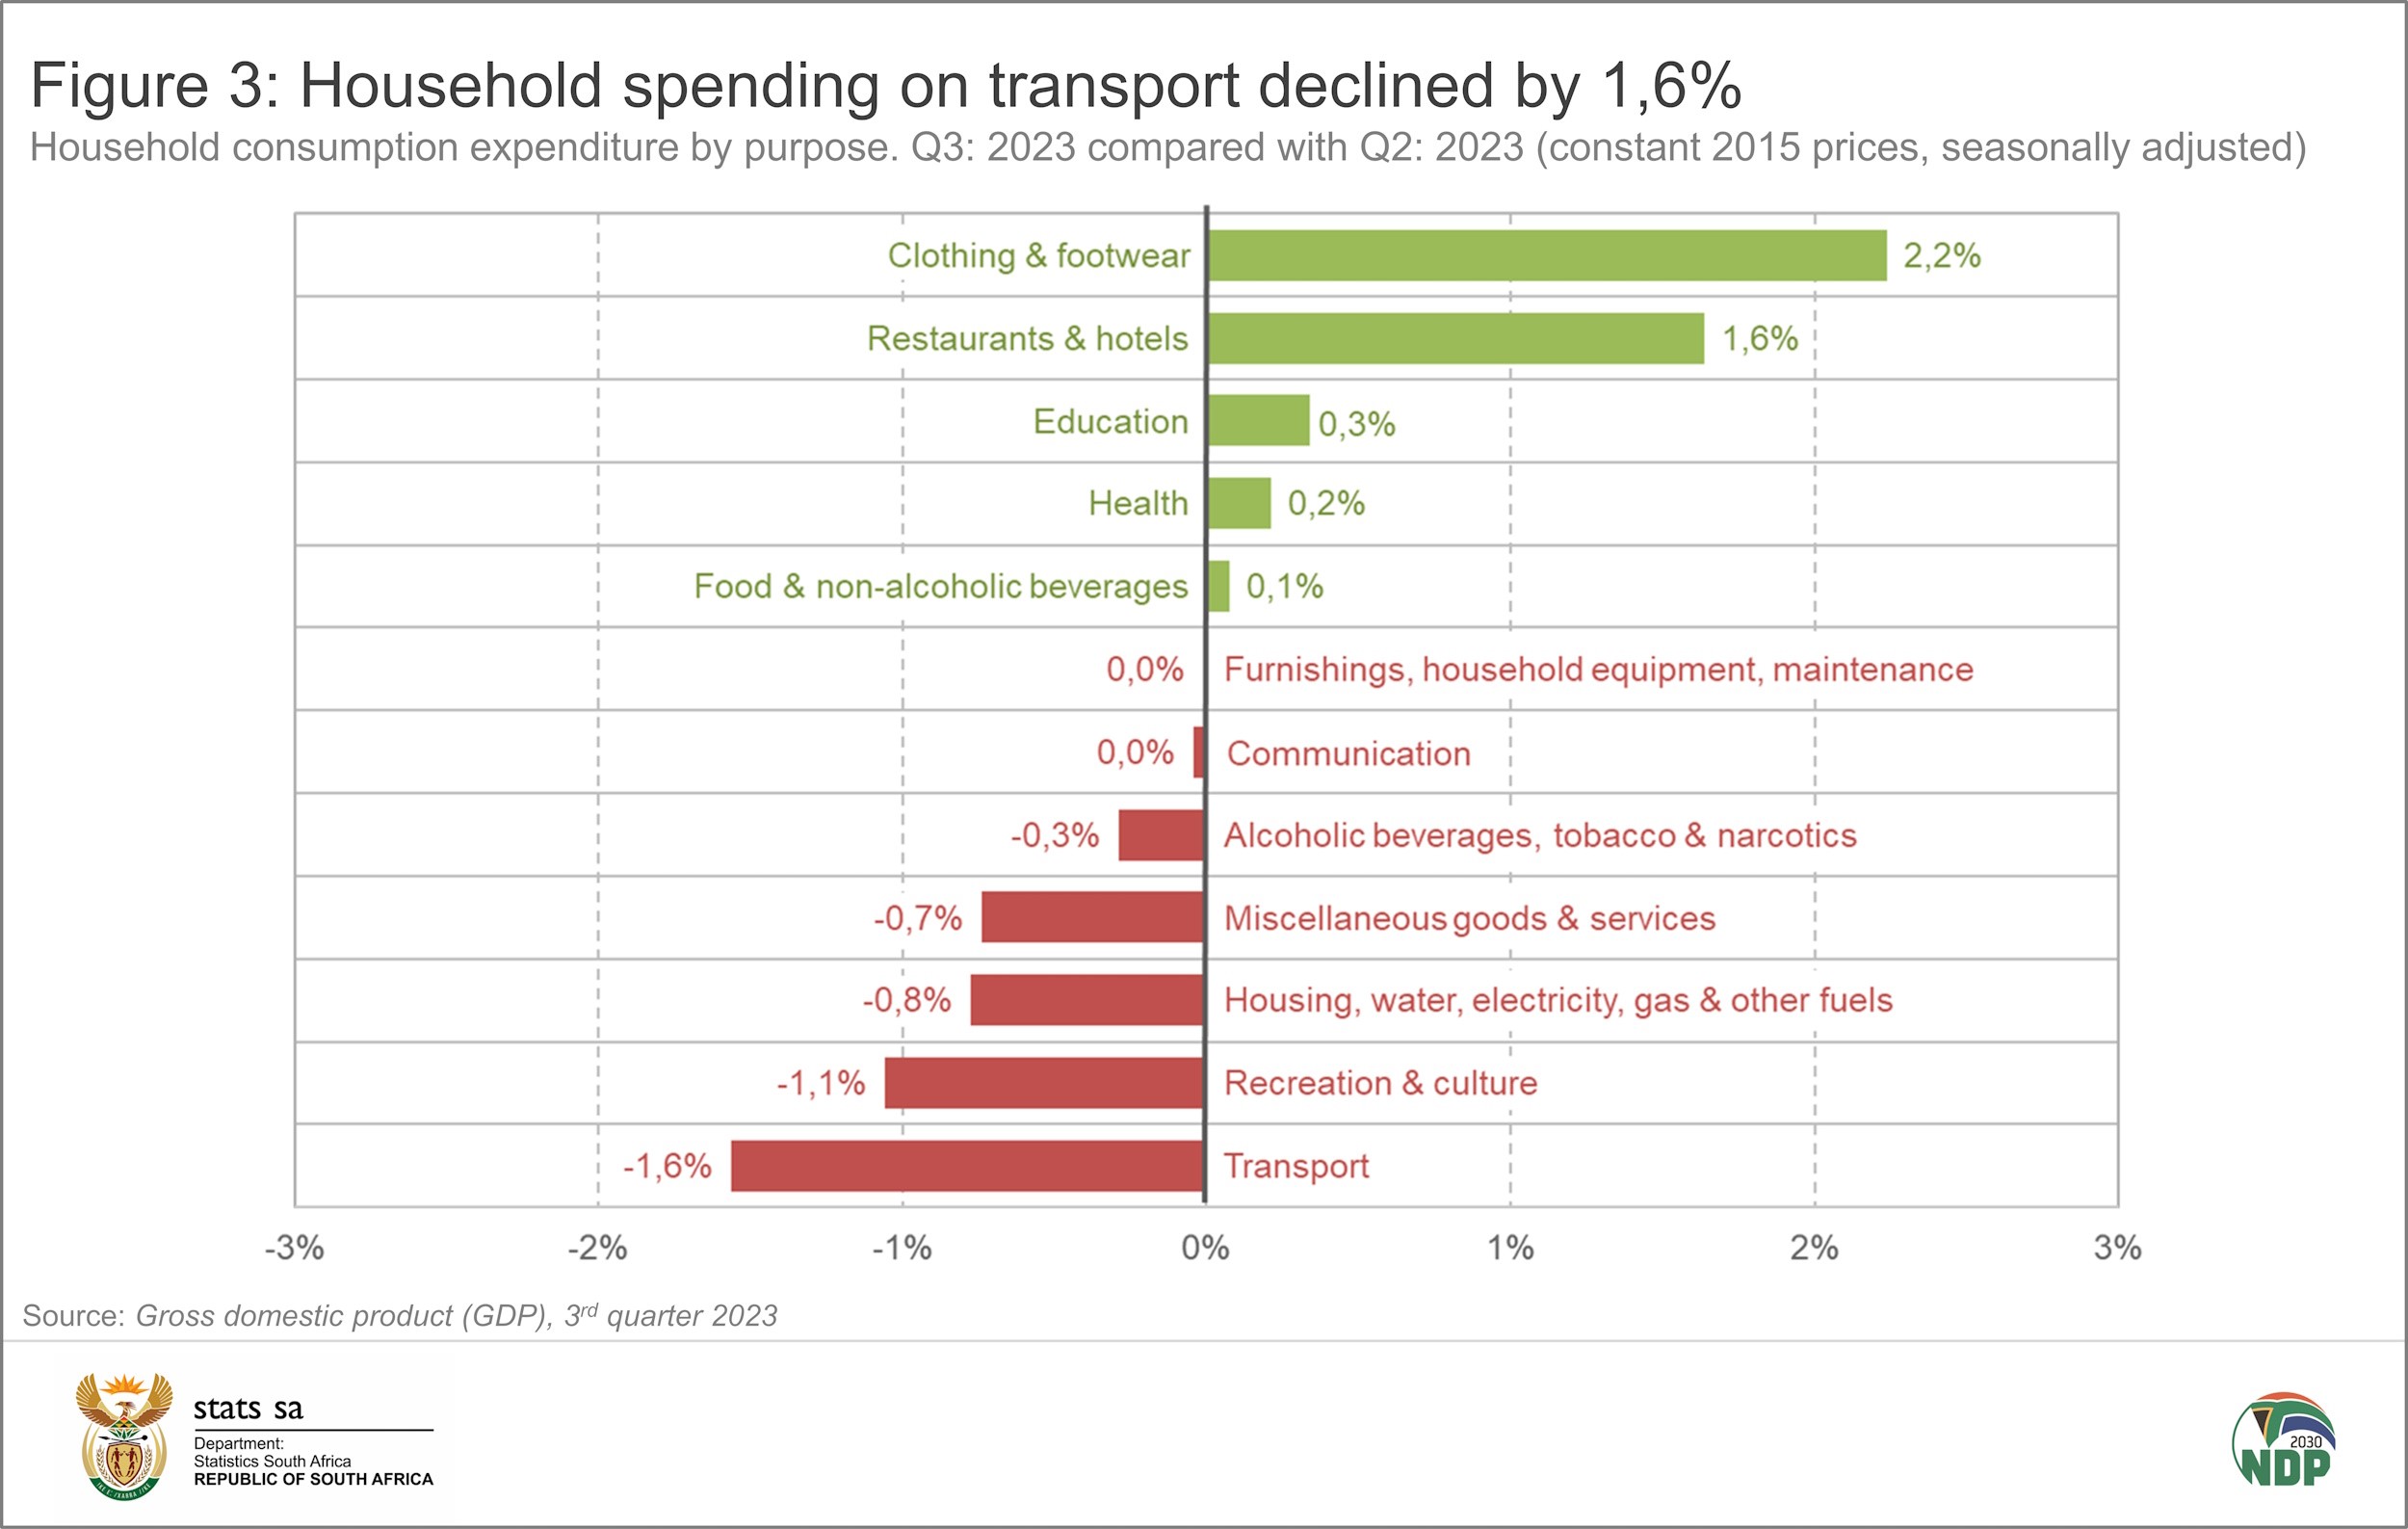
On the household front, strained consumers cut back on consumption expenditure for a second consecutive quarter, reducing their spending on items such as transport, recreation and housing utilities, while spending more on items such as clothing & footwear and restaurants & hotels (Figure 3).
Drawdown in inventories
After six consecutive quarters of inventory build-up in the South African economy, there was a drawdown in the third quarter of R44,5 billion.
What does this mean? Instead of selling stock immediately after production, a company may decide to store a portion of its stock in a warehouse (i.e. inventories) to sell at a later stage. The company might do this as a buffer against uncertainties in demand and supply. The flow of goods into inventories (a build-up) is regarded as an investment and contributes positively to expenditure on GDP, while the flow of goods out of inventories (a drawdown) contributes negatively.
The drawdown recorded in the third quarter was a negative contributor to growth on the demand side of the economy. It occurred across various industries, including manufacturing; mining; and transport, storage & communication.
For more information, download the latest GDP release, media presentation and Excel files here.
1 The quarter-on-quarter rates are seasonally adjusted and in real (volume) terms (constant 2015 prices).
2 The Outlier & EskomSePush (access the site here).
3 Stats SA, SA economy expands in Q2: 2023 (read here).
Similar articles are available on the Stats SA website and can be accessed here.
For a monthly overview of economic indicators and infographics, catch the latest edition of the Stats Biz newsletter here.