
Three facts about the manufacturing industry (2021)
There are two reasons to be excited about two recent manufacturing reports. First, covering the results of a detailed 2021 survey, the reports provide provincial- and district-level data. Second, they offer detailed insight into the state of the manufacturing industry in South Africa in terms of employment, finances, and the quantities of manufactured products.
- The size of the workforce has declined over the years
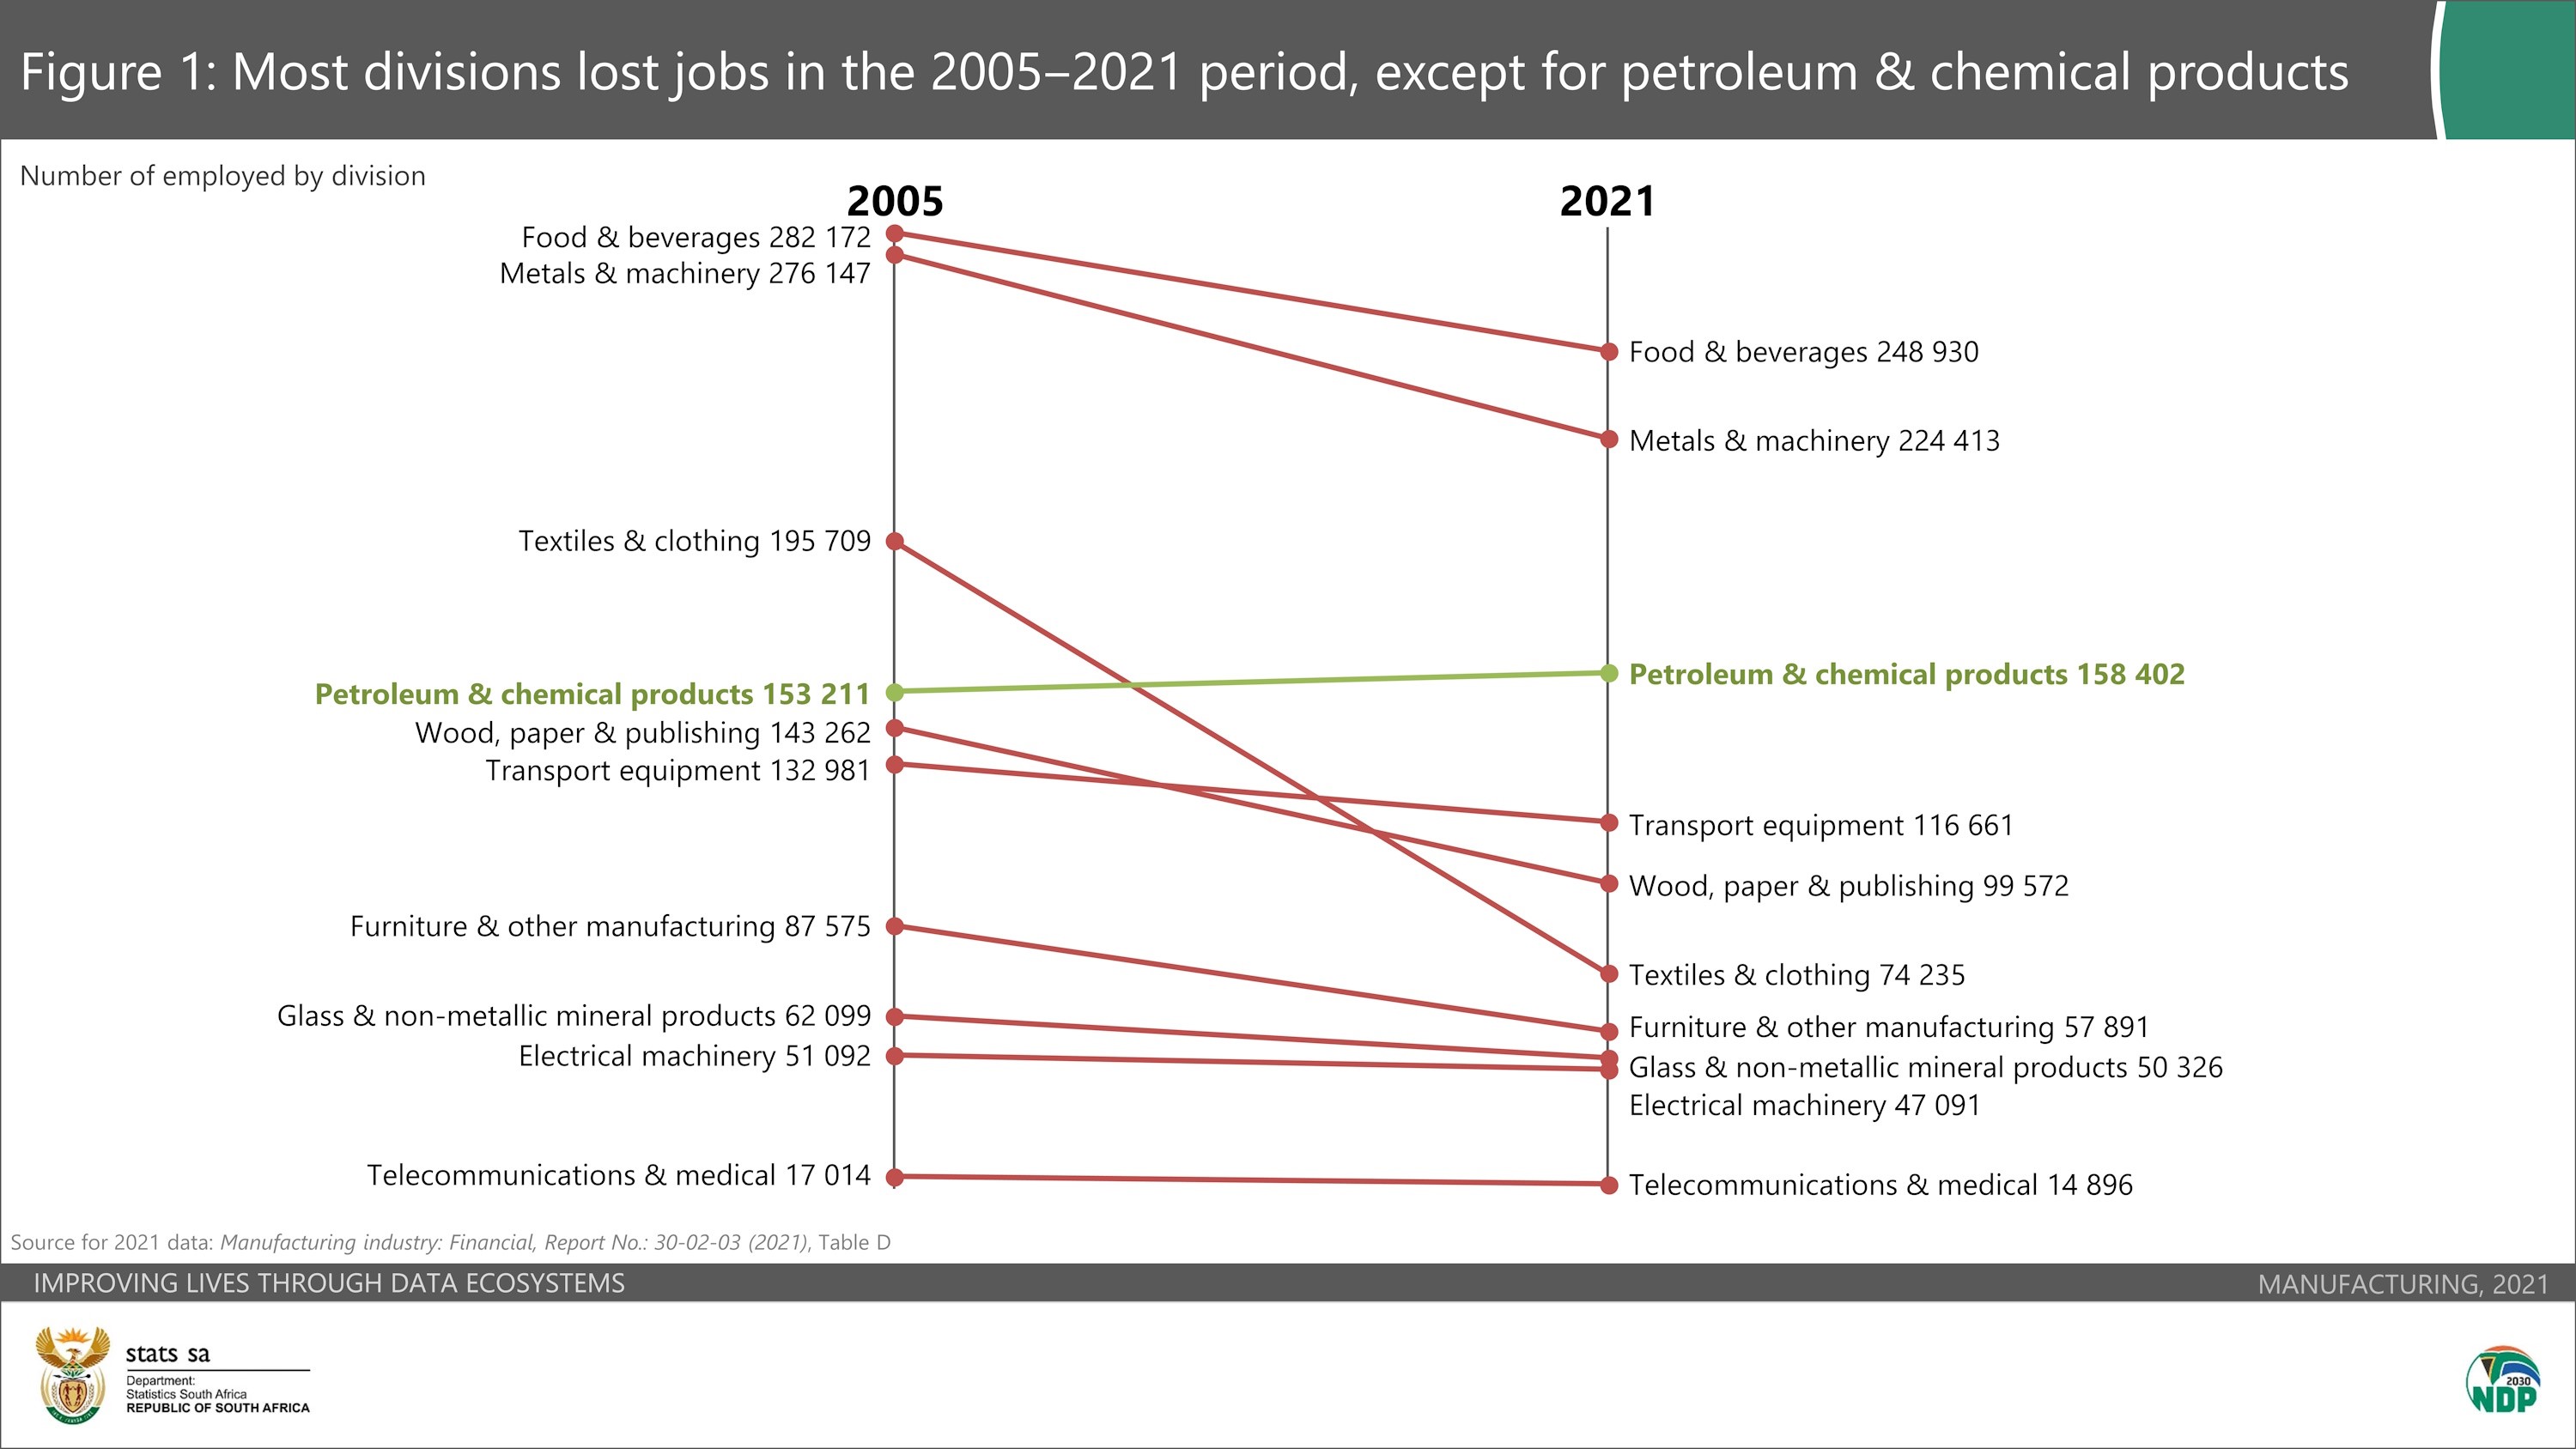
The survey1 was previously conducted in 2005, 2008, 2011, 2014 and 2017, creating a valuable time series. A key trend in the data is the decline of manufacturing jobs. In 2005, the industry employed 1,40 million individuals. In 2017, 1,18 million were employed, declining to 1,09 million in 2021. The industry has lost almost 309 000 jobs over a 16-year period, with the decline in 2021 most likely the result of the COVID-19 pandemic.
The data from 2005 provide insight into how the structure of the manufacturing workforce has shifted. Most divisions lost jobs in the 2005‒2021 period, with the exception of petroleum & chemical products (Figure 1). Job losses have had a devastating impact on textile & clothing manufacturing in particular, with that division losing almost 121 500 workers.
- Manufacturing jobs: Johannesburg is in the lead
Manufacturing is mainly concentrated in the City of Johannesburg, Ekurhuleni, the City of Cape Town and eThekwini. In 2021, the four cities accounted for 60% of the national workforce and just over half of sales of goods & services.
The City of Johannesburg had the highest number of manufacturing jobs, accounting for 17,2% of the national total (Figure 2). Its direct neighbour to the east, Ekurhuleni, had the second largest workforce at 168 035 employees.
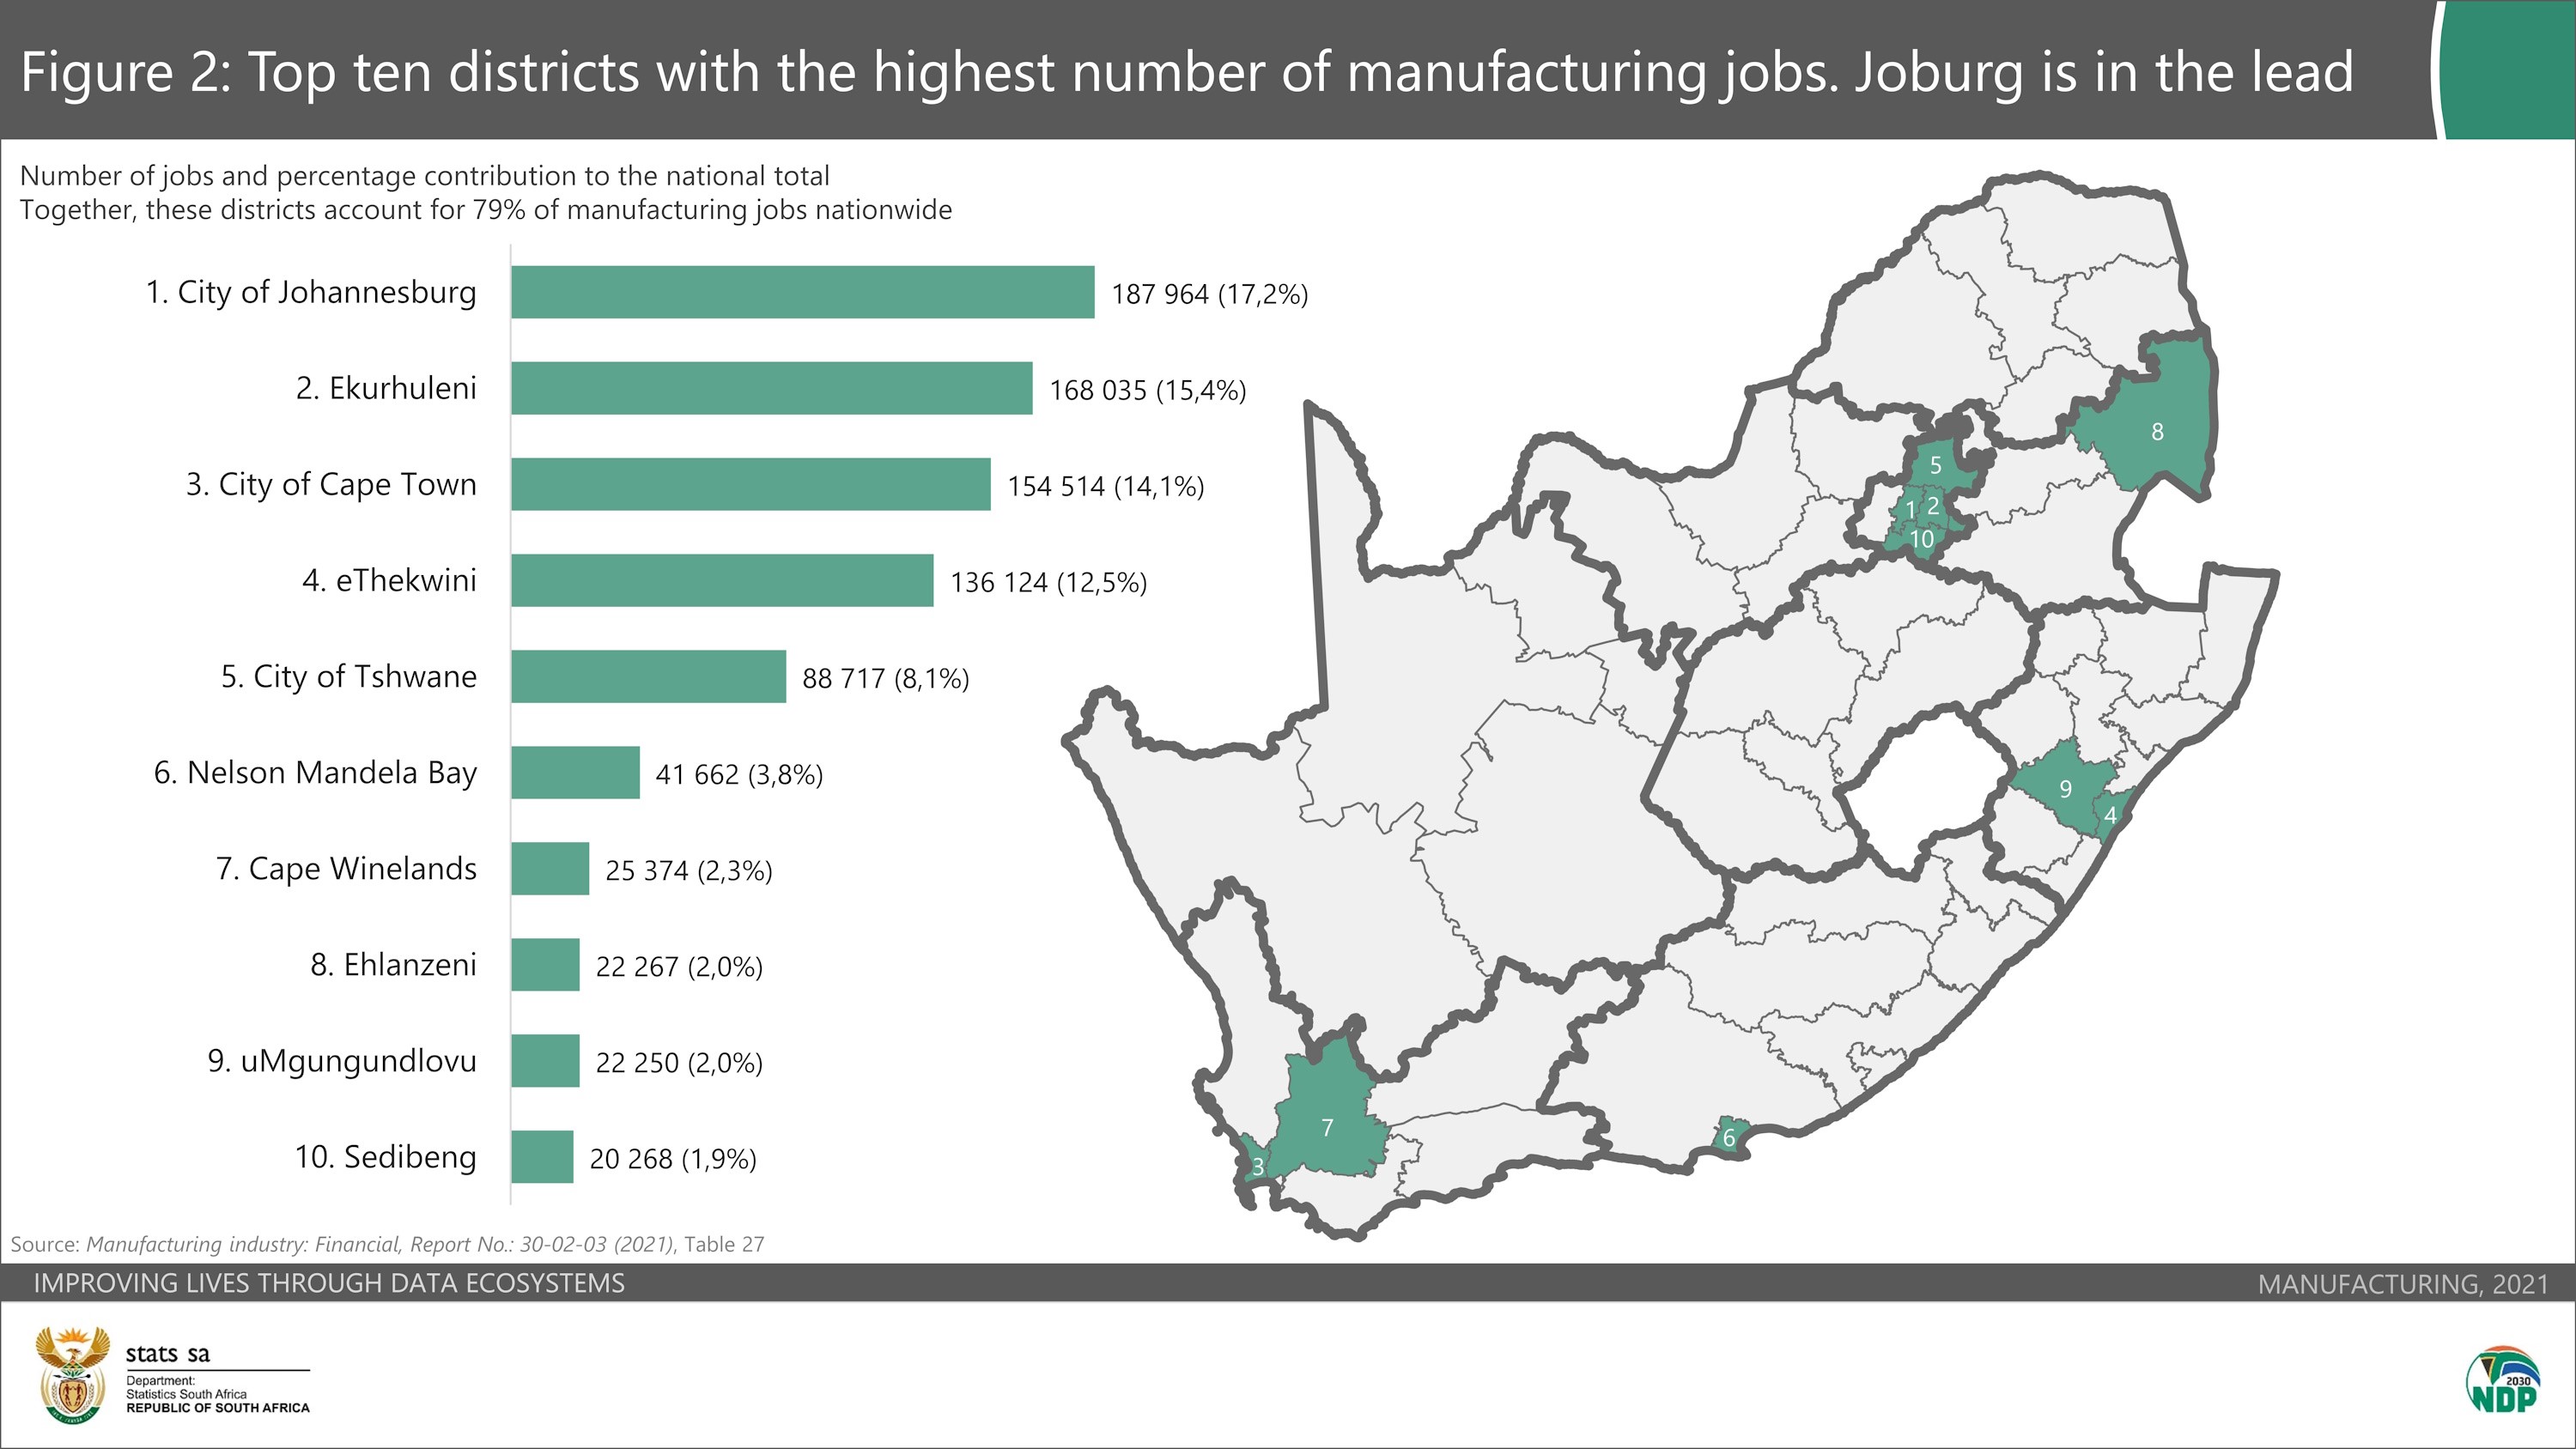
Four of the top ten districts with the highest employment numbers are located in Gauteng. Two are situated in Western Cape and two are in KwaZulu-Natal.
In fact, if we consider the data on a provincial level, Gauteng is the nation’s manufacturing hub. The province accounts for 43% of the national manufacturing workforce and 42% of sales of goods & services.
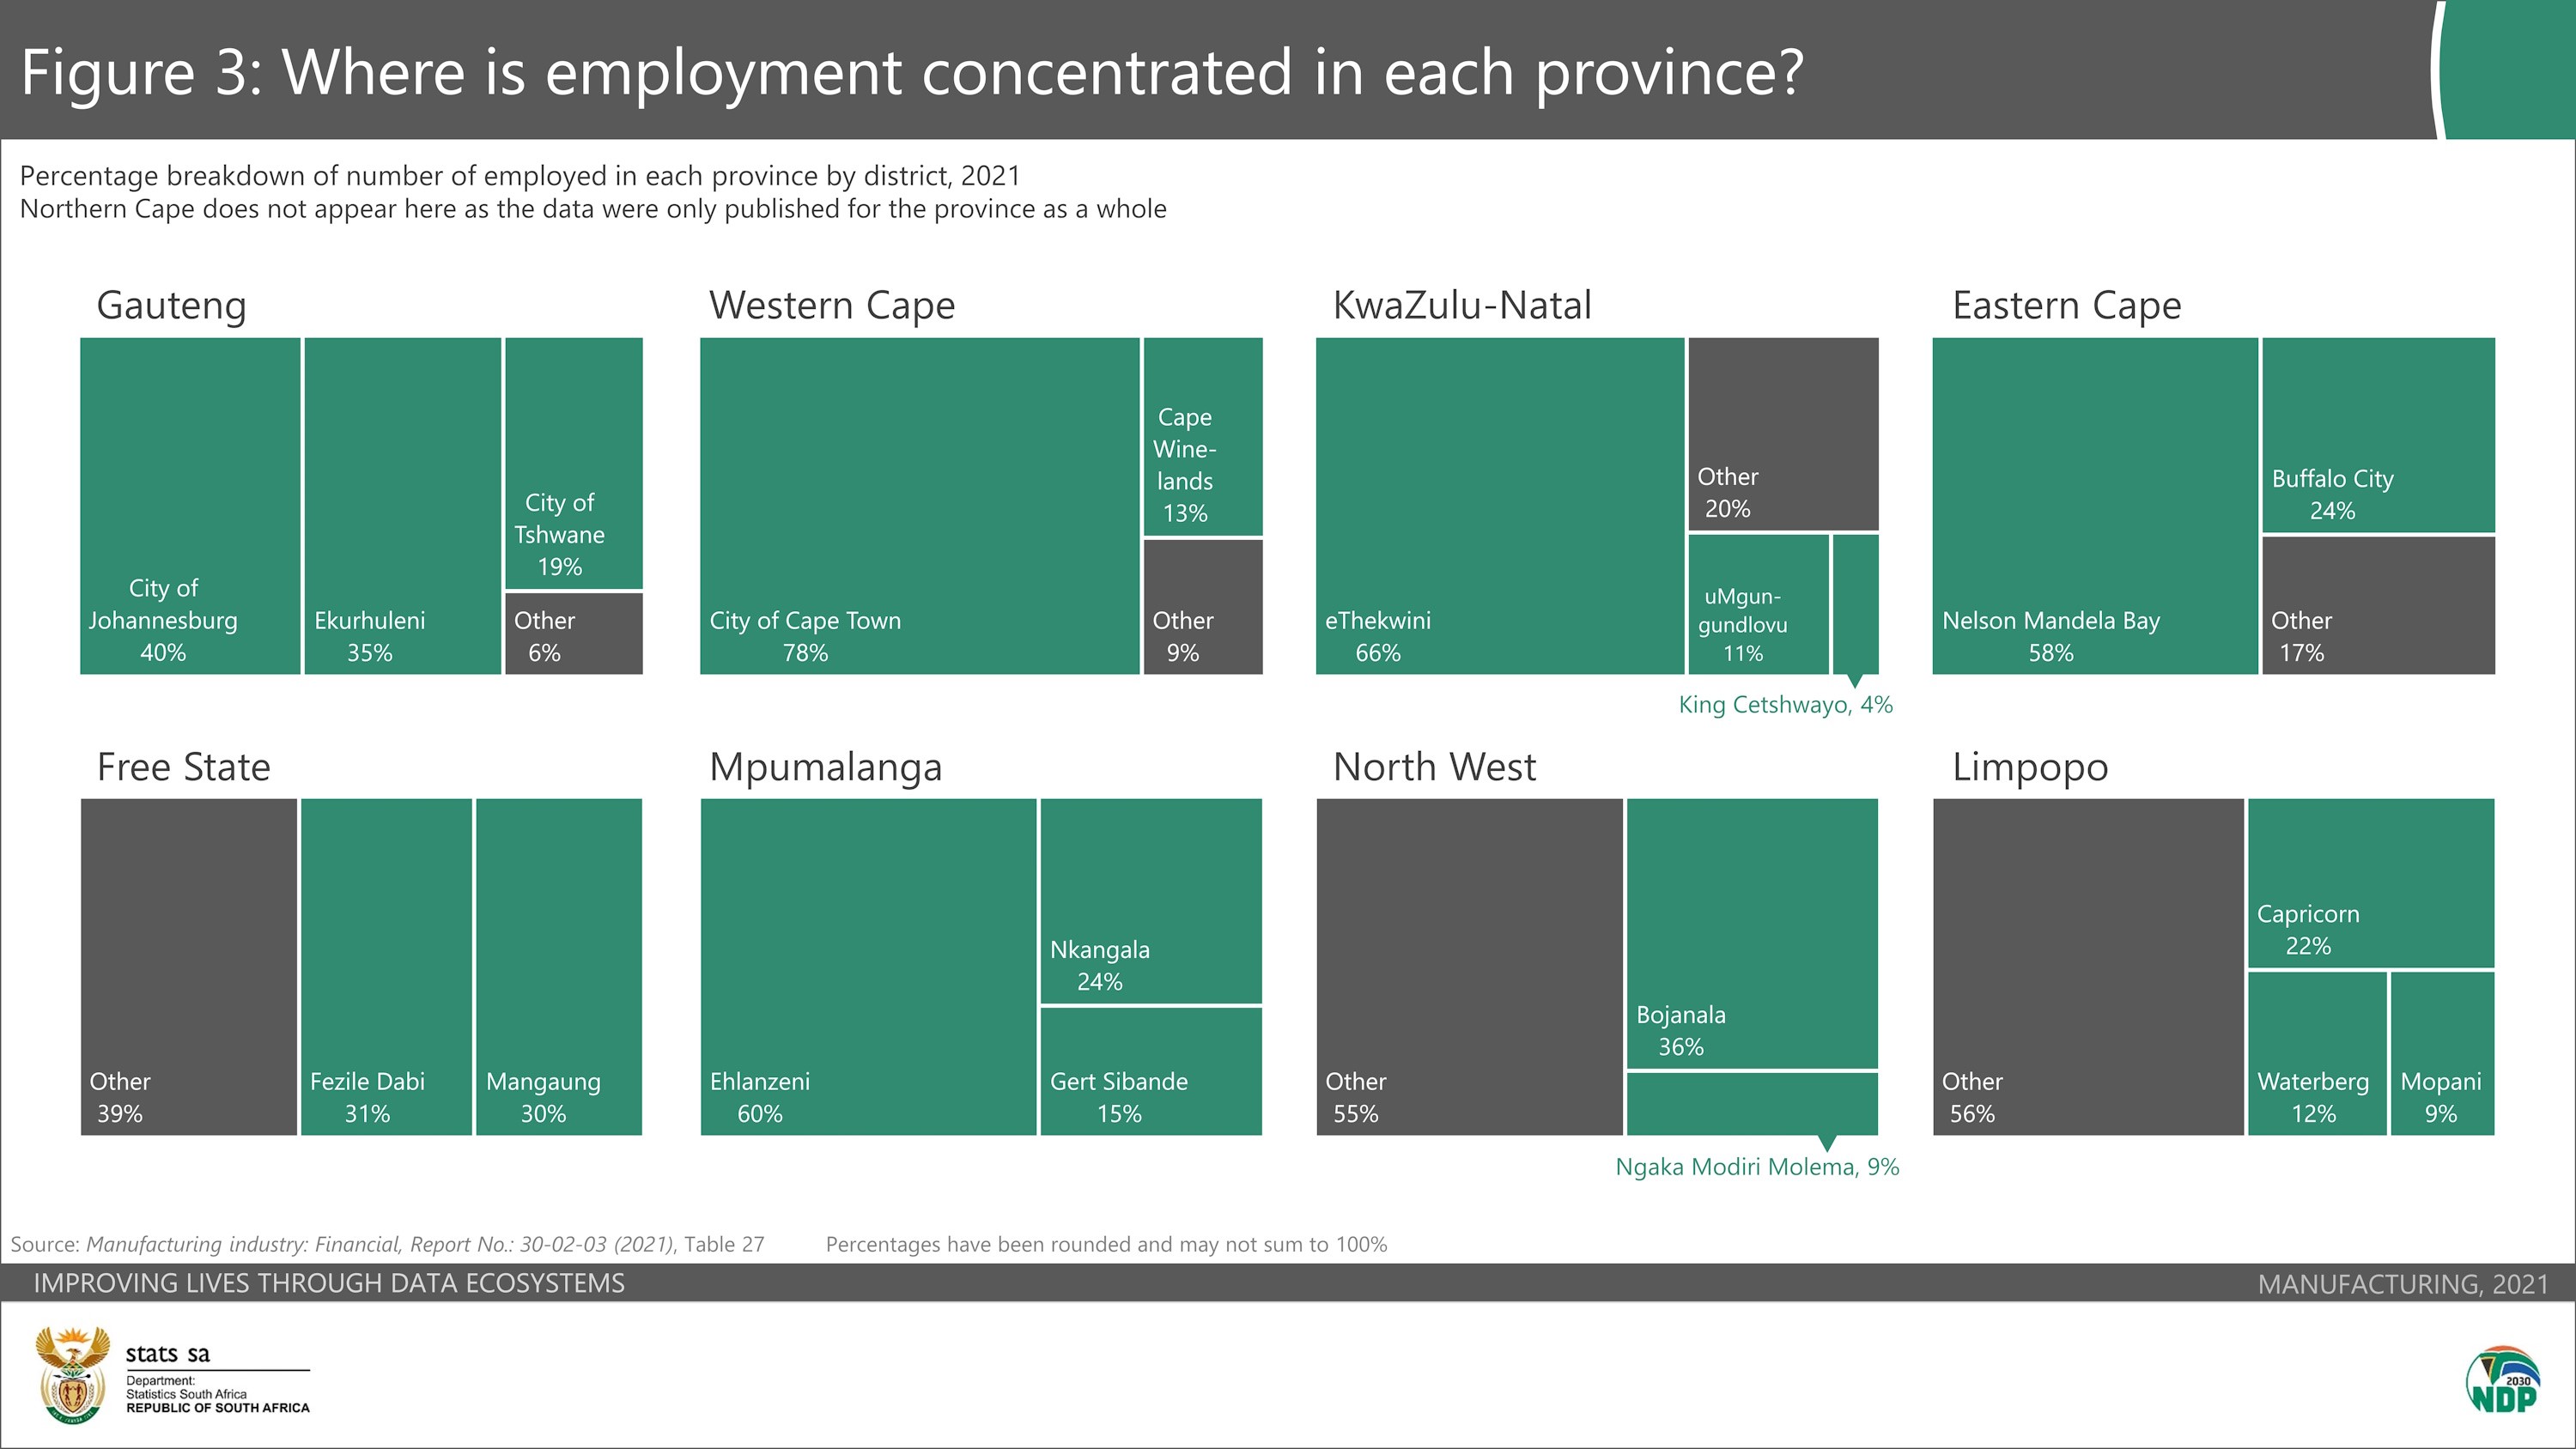
The data provide a unique opportunity to examine where employment is concentrated within provinces (Figure 3). Western Cape is dominated by the City of Cape Town, with 78 of every 100 manufacturing employees in the province working in that city. Manufacturing jobs in Free State are more widely distributed. Mangaung, which includes the city of Bloemfontein, is home to 30% of the provincial workforce.
- Cars, beverages and steel drive manufacturing income
In 2021, the top ten manufactured products that generated the most income were related to the automotive, beverage and steel sectors. More specifically, diesel fuel generated the most income in 2017 and 2021 (Figure 4). The industry also recorded a rise in income from several other products, including medium passenger motor vehicles and light commercial vehicles.
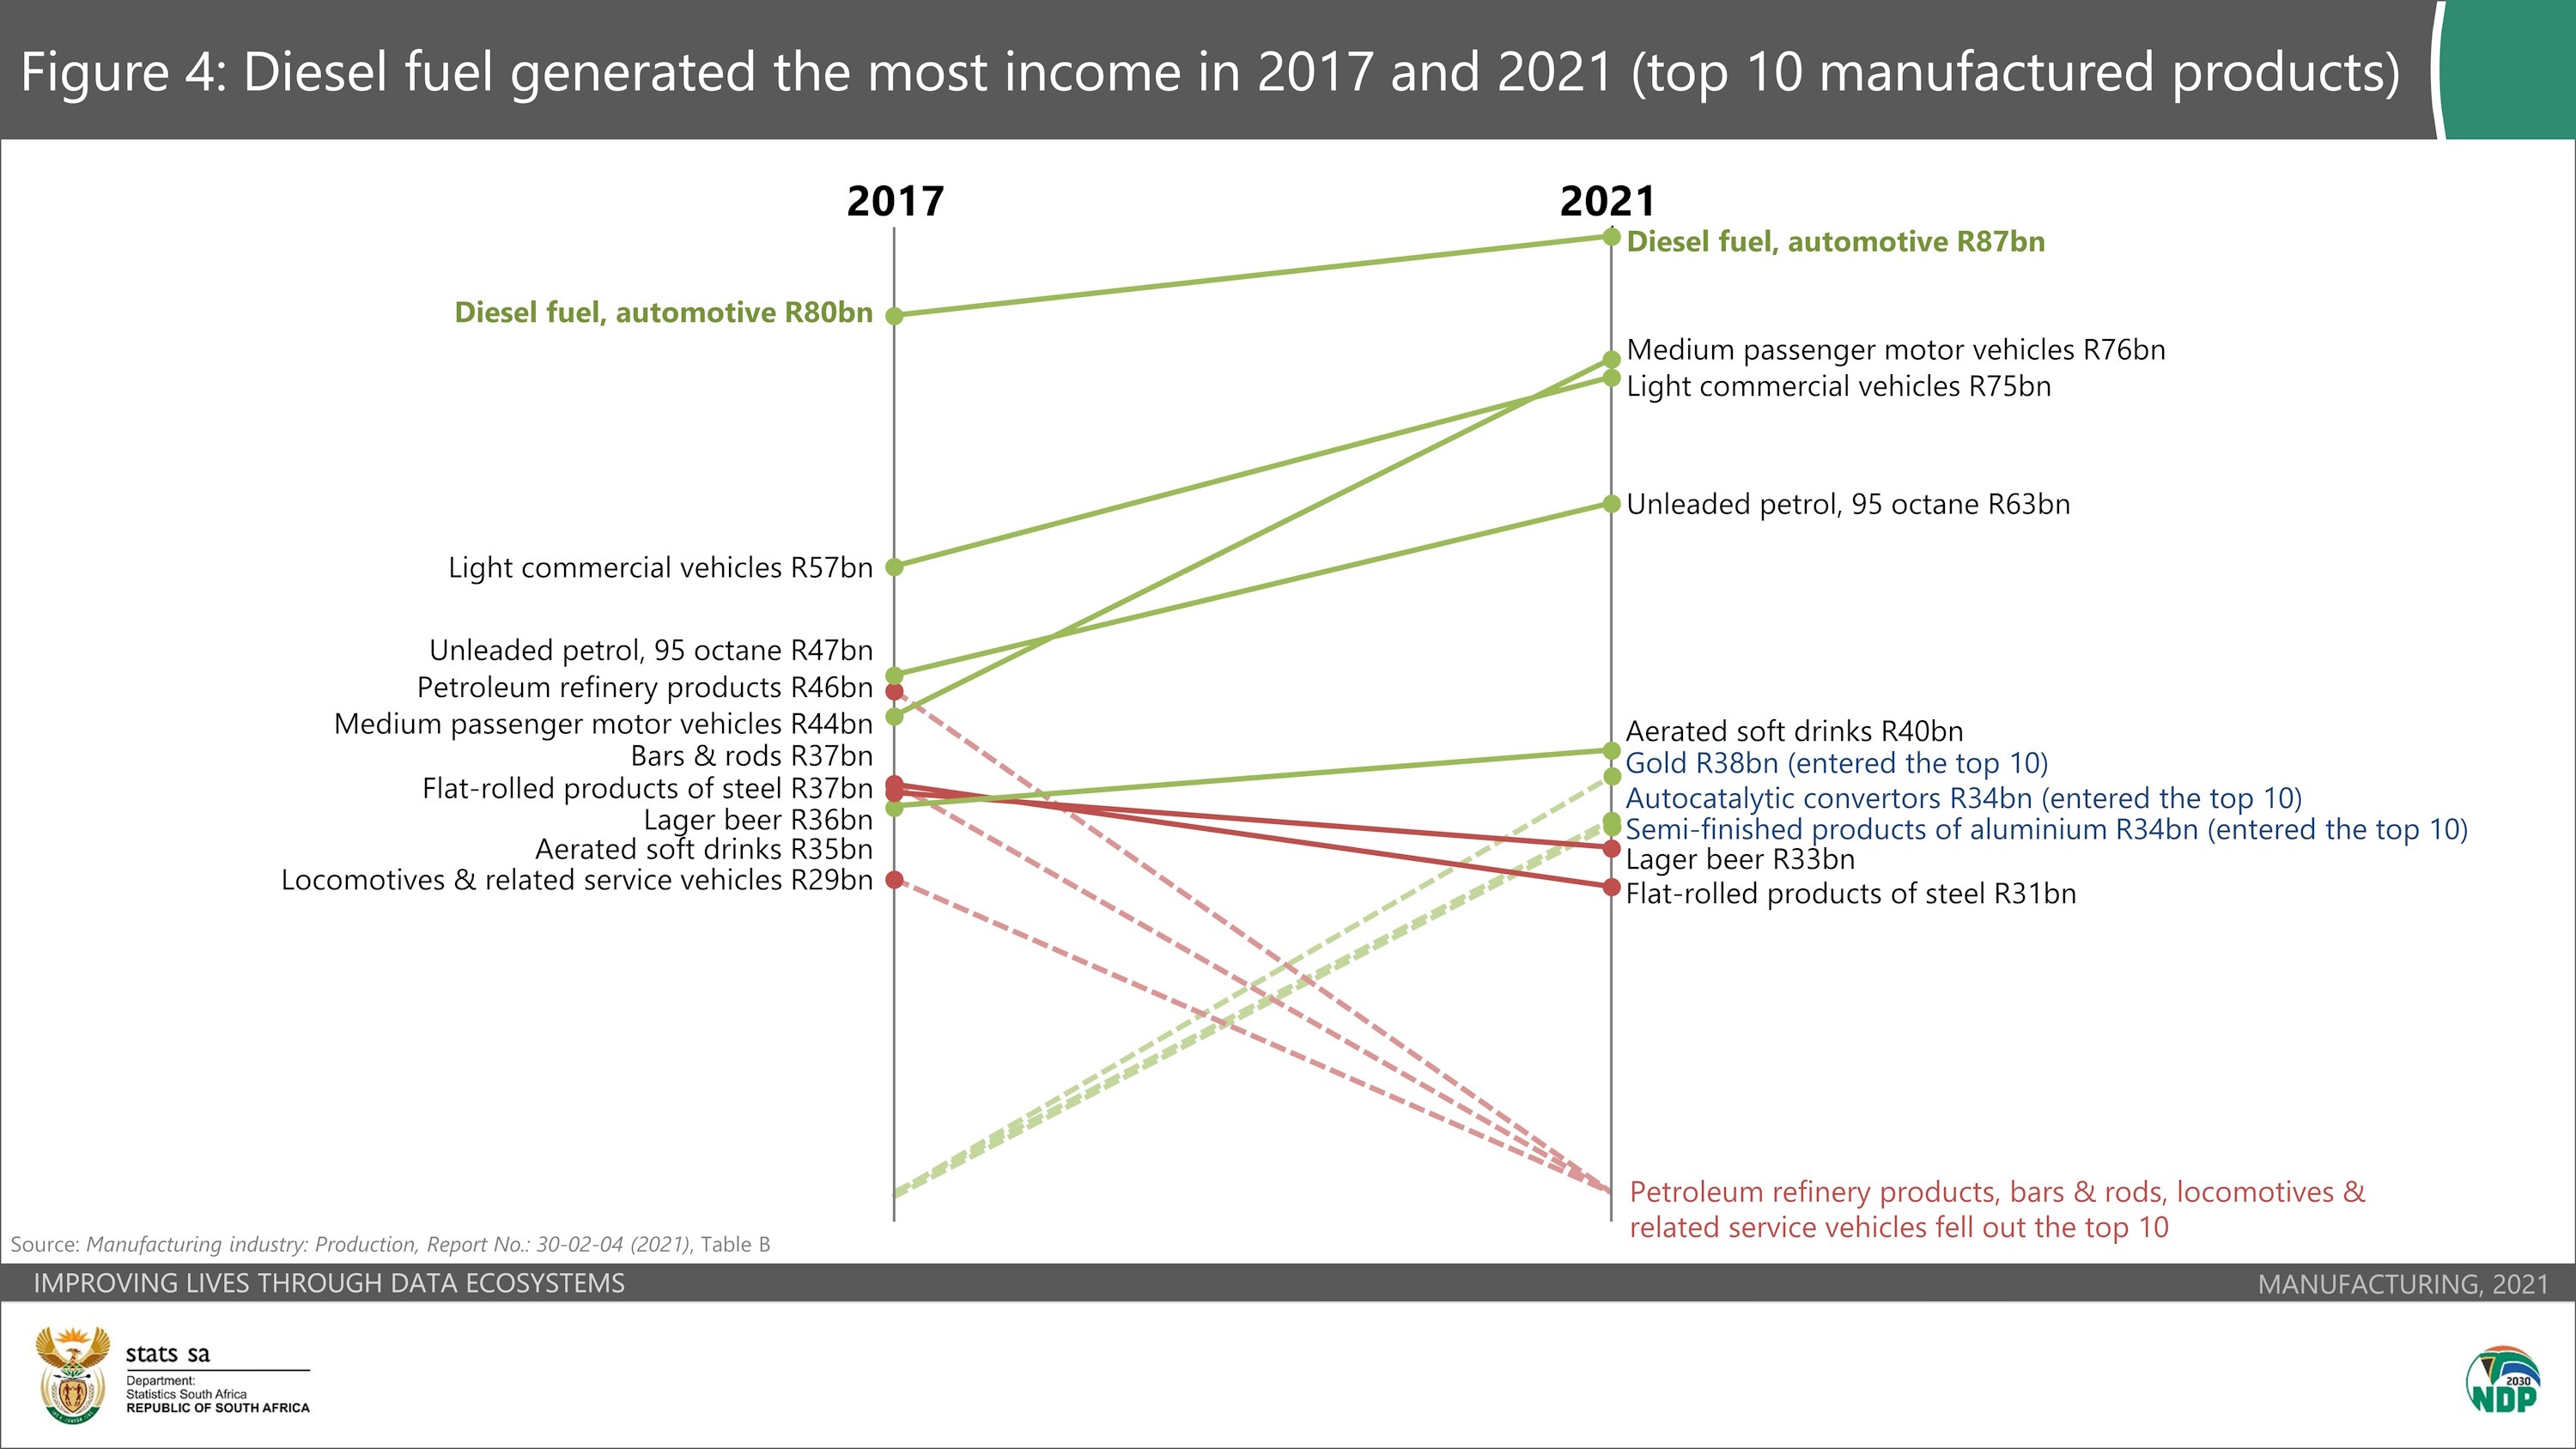
In fact, the production of motor vehicles is big business for the export industry. For example, 79% of income generated from the sales of medium passenger motor vehicles in 2021 was from exports.
Between 2017 and 2021 three products fell out of the top ten (Figure 4), including petroleum refinery products, bars & rods, and locomotives.
For more information, download Manufacturing industry: Financial, Report No. 30-02-03 (2021) here and Manufacturing industry: Production, Report No. 30-02-04 (2021) here. The media presentation is available here.
1 The manufacturing survey is a large sample survey of tax registered enterprises.
Similar articles are available on the Stats SA website and can be accessed here.
For a monthly overview of economic indicators and infographics, catch the latest edition of the Stats Biz newsletter here.