

In 2024, South Africa celebrates three decades since the advent of democracy, a pivotal moment in its history. This milestone not only signifies the passage of time but also reflects the enduring journey towards equality, freedom, and justice for all its citizens. Households reflect the ongoing transformation, encompassing a diverse mix of cultural, economic, and social influences.
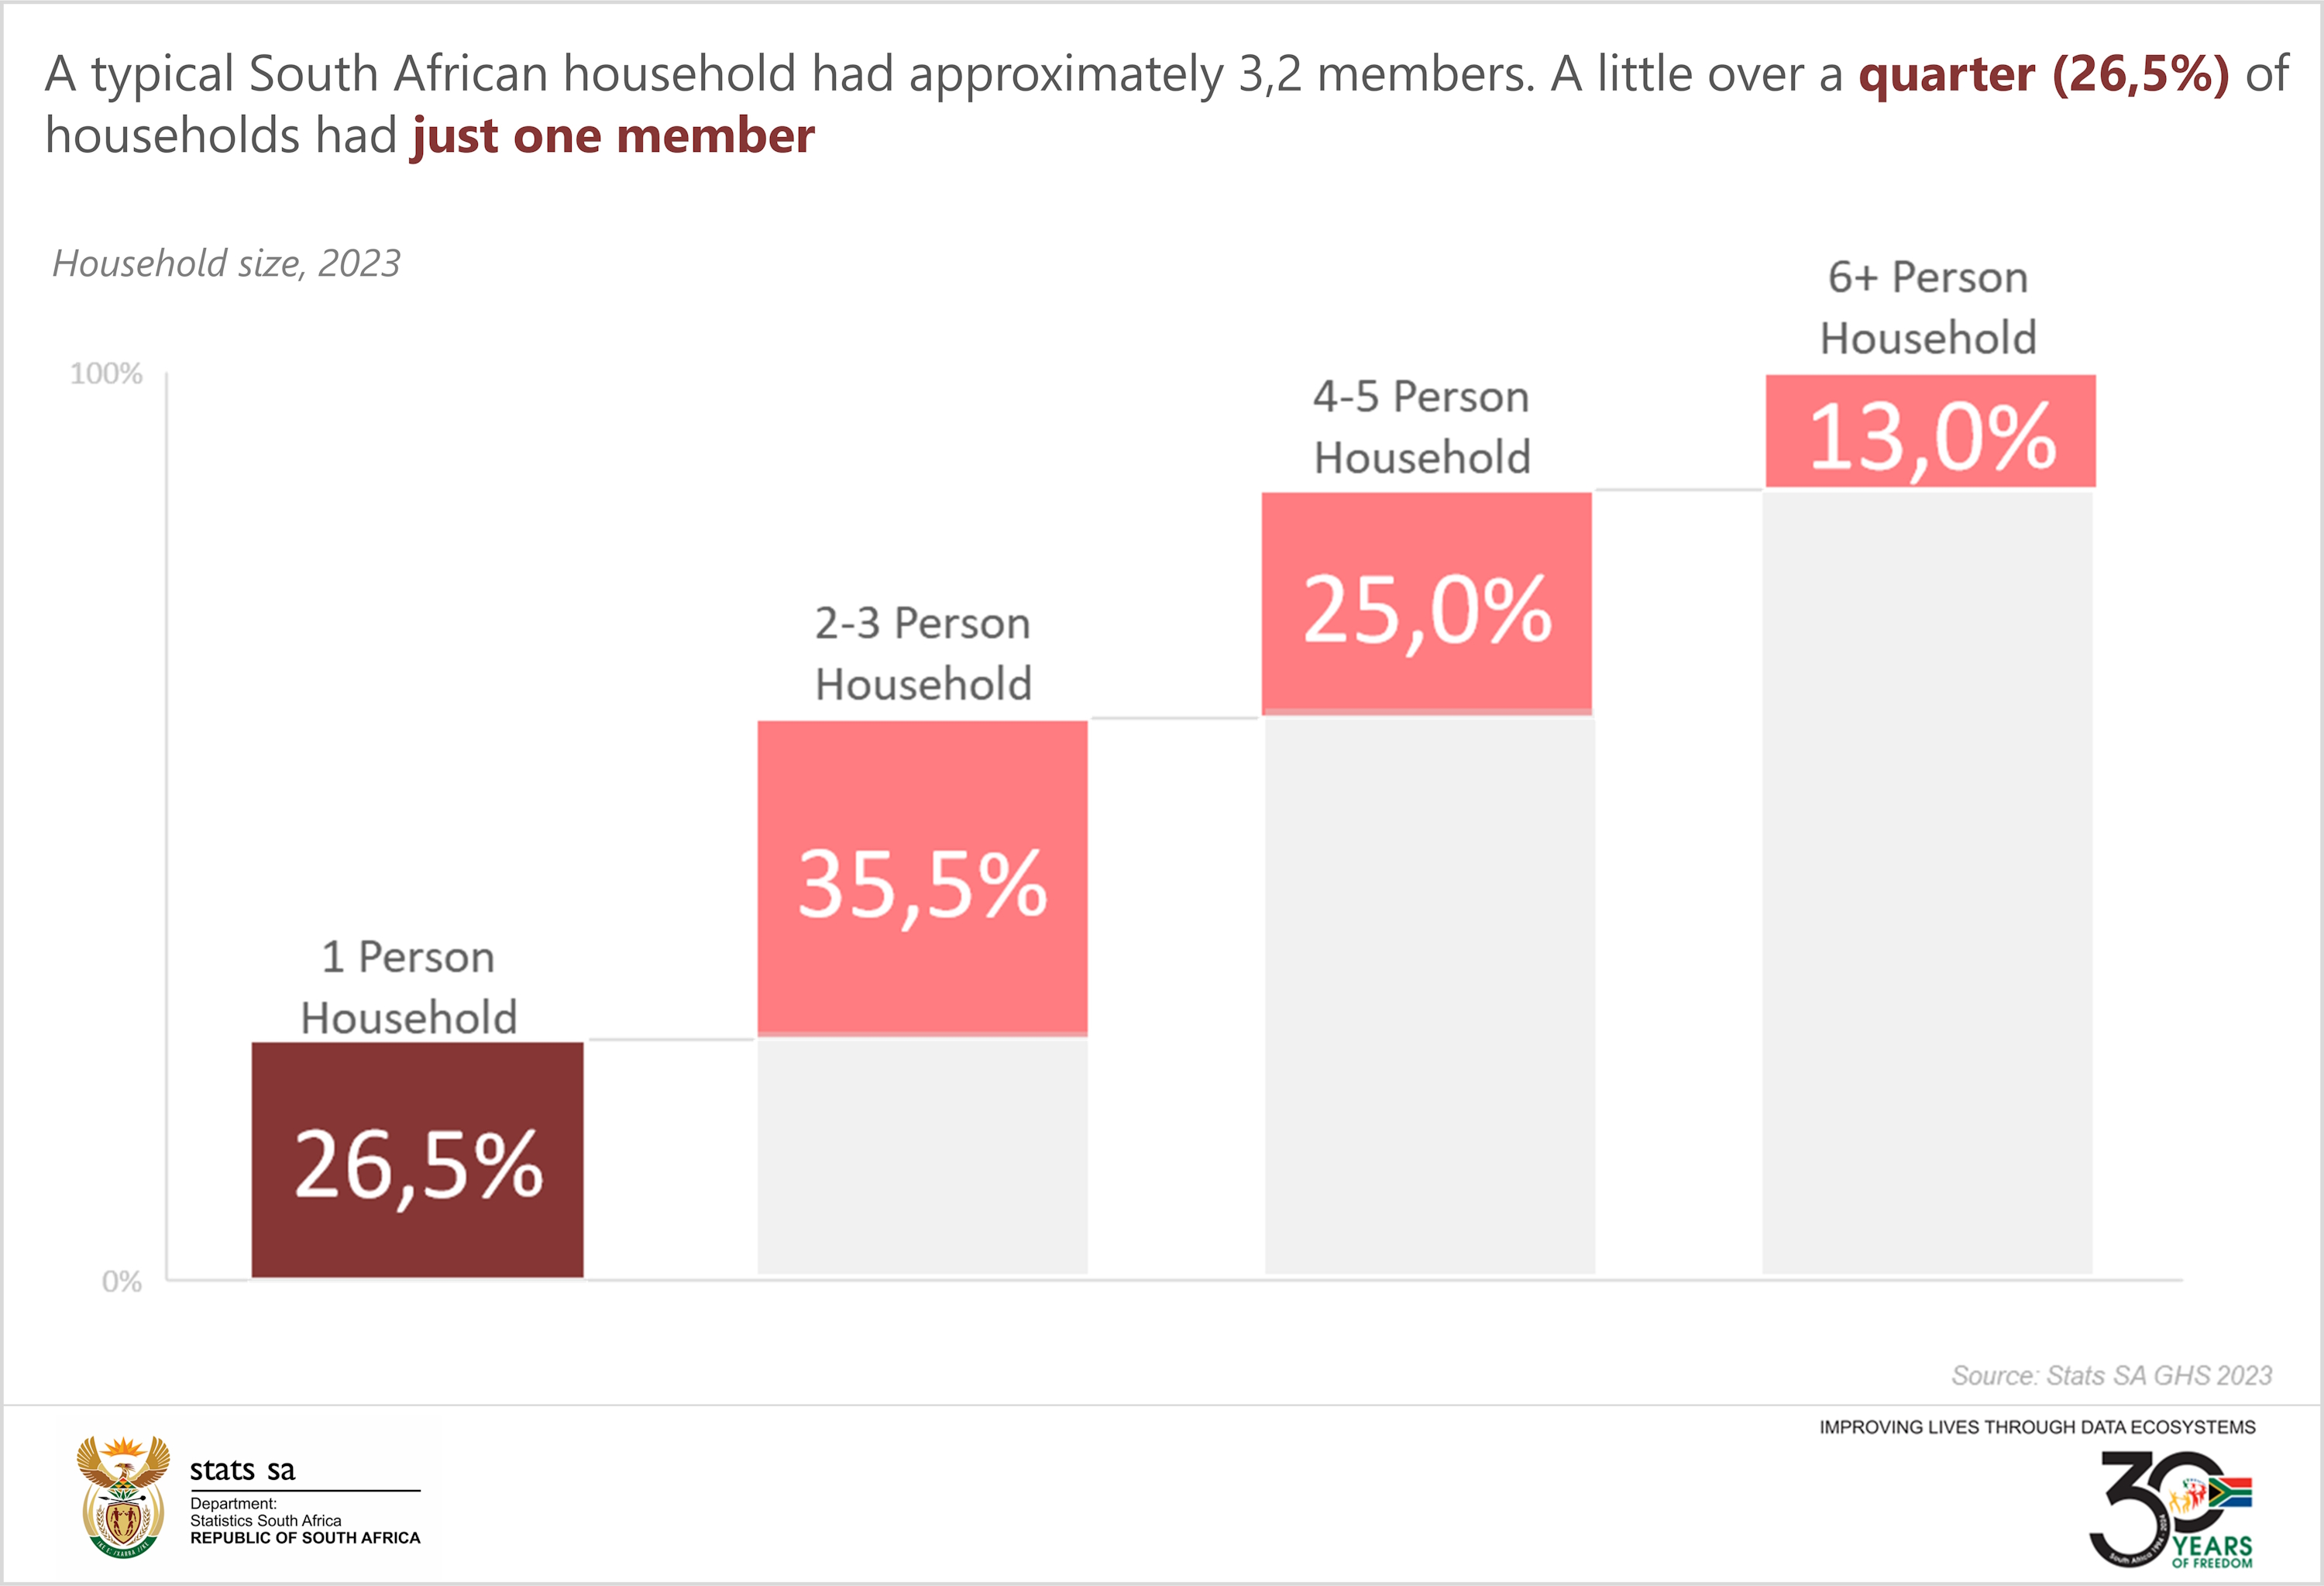
According to the General Household Survey, 2023 released by Statistics South Africa, a typical South African household had approximately 3,2 members. A little over a quarter (26,5%) of households had just one member. Meanwhile, more than three-quarters (87%) of homes had four to five members or fewer, while only 13% of households contained six members or more.
Although the proportion of households residing in informal settlements has shown only minor fluctuations since 2002, dipping marginally from 13,0% to 12,2%, the majority—more than four-fifths (83,5%)—lived in formal dwellings, marking an increase from 73,5% in 2002. In 2023, nearly three-fifths (58,6%) of formal dwellings consisted of five rooms or more, a rise from 42,8% in 2002. While corrugated iron (55,9%) and tiles (29%) remained the primary roofing materials, data indicated a decline in asbestos usage as a roofing material, from 16,9% in 2002 to 9,9% in 2023. Additionally, the percentage of households benefitting from a government housing subsidy rose from 5,6% in 2002 to 13,8% in 2018.
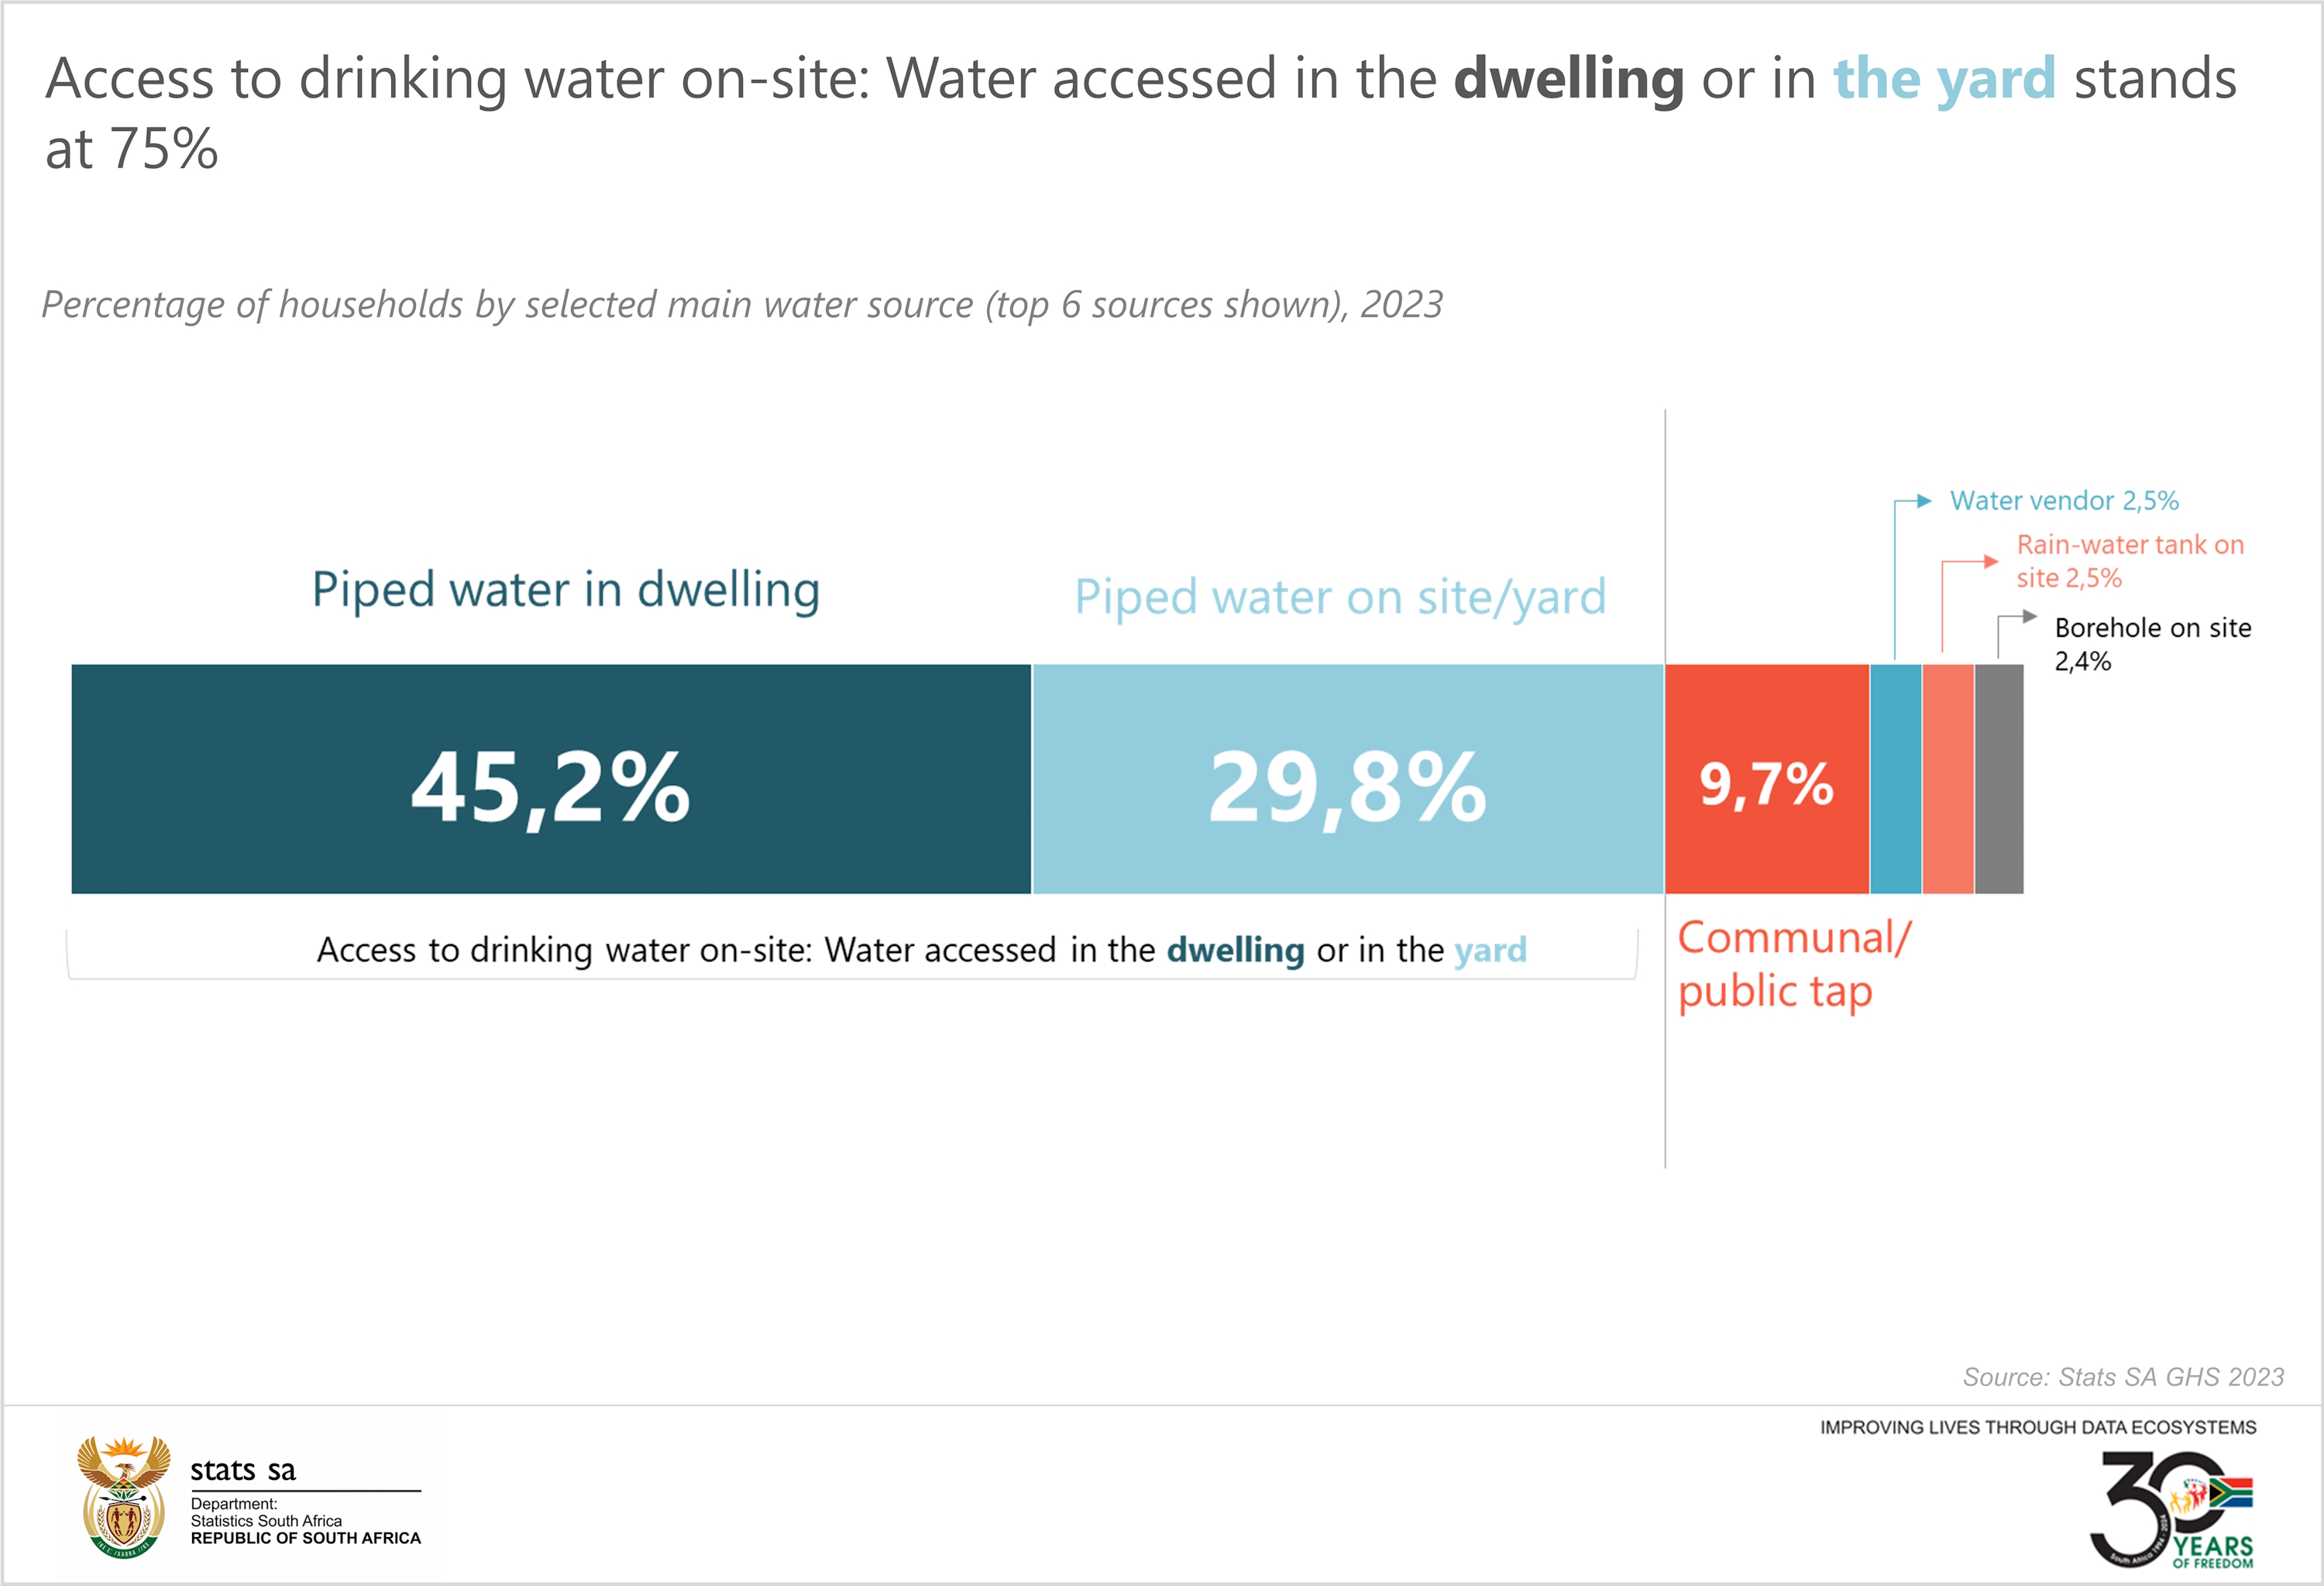
The improvement in housing quality is evident in the availability of drinking water. From 2002 to 2023, the proportion of households with access to piped or tap water either on-site or off-site rose by 2,6 percentage points to reach 87,0%. Specifically, households with piped water within their dwellings increased from 40,4% to 45,2%. Moreover, the percentage of households with access to municipal water increased from 78,4% in 2004 to 80,4% in 2023, representing an increase of 6 million households.
Since 2002, there has been significant progress in sanitation access in South Africa. The percentage of households with upgraded sanitation facilities, including flush toilets and pit toilets with ventilation pipes, rose from 61,7% to 83,3% by 2023. Flush toilet usage increased to 66,0%, while pit toilets with ventilation pipes rose to 17,3%. Particularly notable increases were observed in the Eastern Cape, Limpopo, and KwaZulu-Natal provinces. Conversely, pit latrines without ventilation pipes decreased by 15,5 percentage points to 10% in 2023. These advancements signify substantial strides towards better sanitation infrastructure, enhancing the quality of life for many communities across the country.
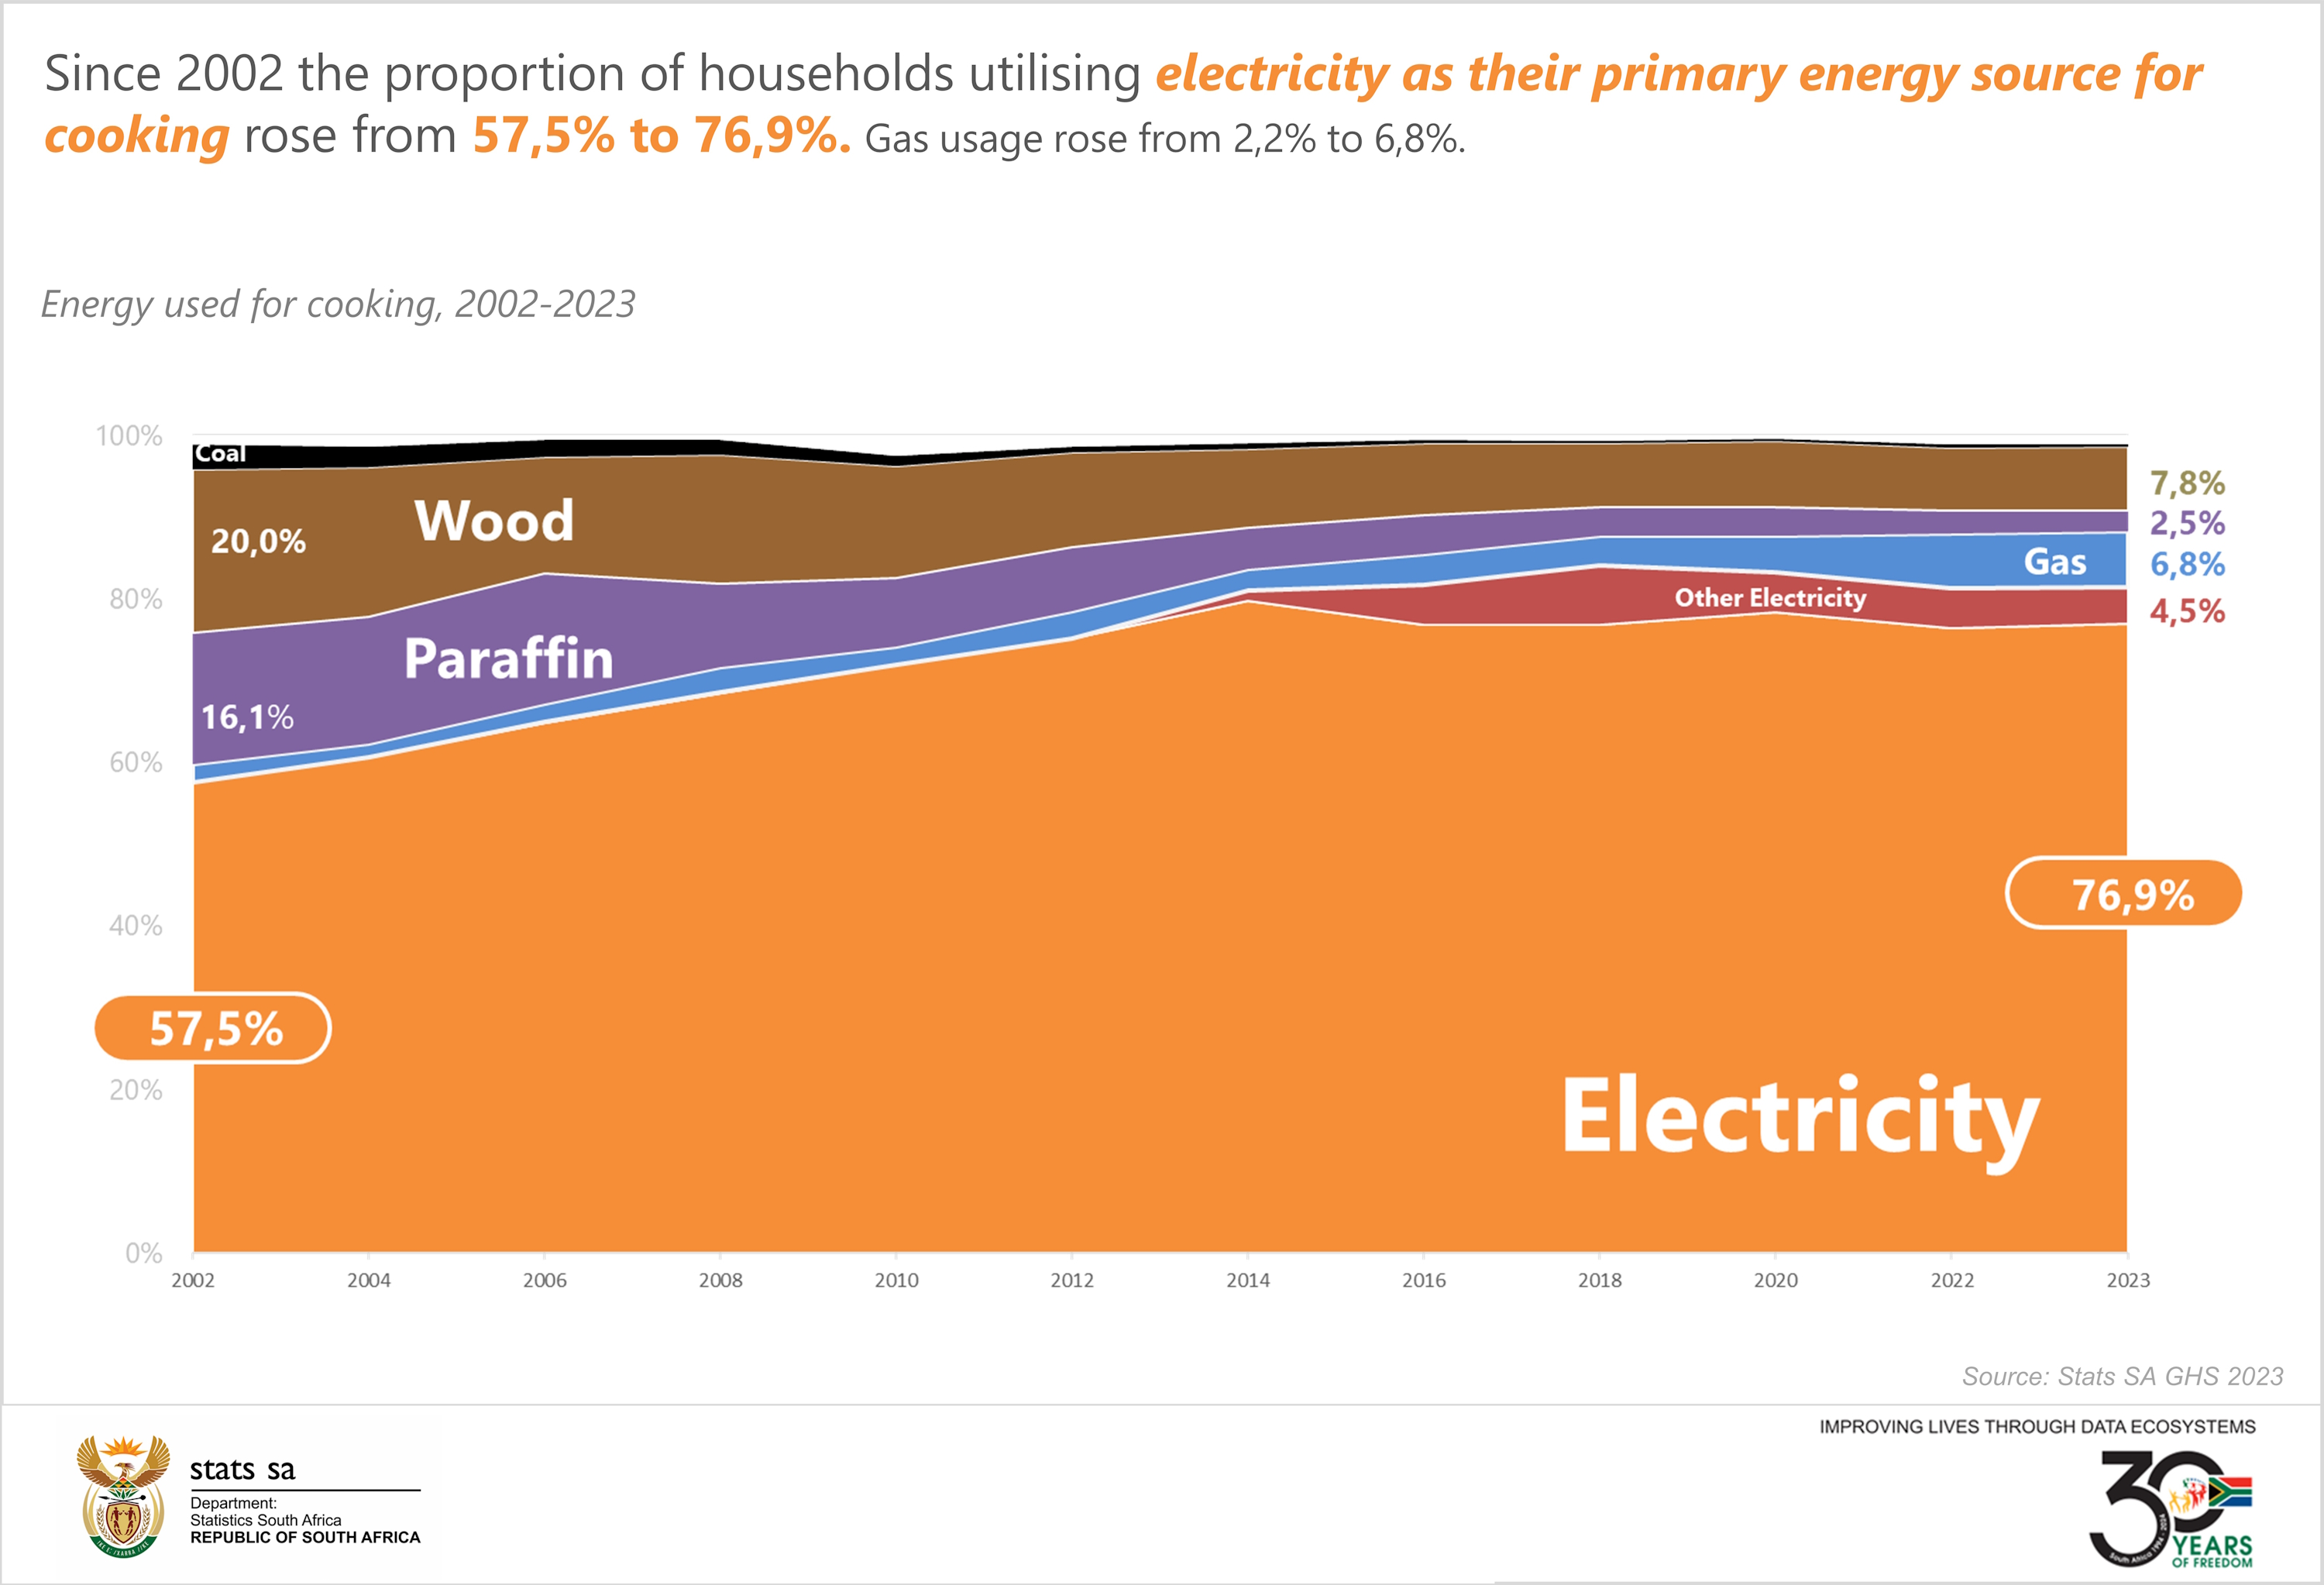
Since 2002, there has been a notable increase in access to mains electricity, rising from 76,7% to 89,8%. For households in formal dwellings, this access increased from 86,4% to 94,6%, while for those in informal dwellings, it rose from 52,3% to 58,3%. This improved access to electricity has had significant effects on households. The proportion of households utilising electricity as their primary energy source for cooking rose from 57,5% to 76,9%. Conversely, the use of paraffin decreased to 2,5% from 16%, and the reliance on wood or coal dropped from 23% to 8,1%. Gas usage rose from 2,2% to 6,8%.
However, due to load shedding, households resorted to a variety of alternative energy sources for both cooking and lighting. Nationally, 29,0% utilised LPG/Gas, while 23,1% relied on open fires fuelled by a range of materials such as wood, coal, and charcoal. Gas usage was particularly prevalent in the Western Cape (46,0%) and Gauteng (36,3%). This increase is reflected in the fact that household ownership of gas stoves and plates increased from 19% in 2022 to 30,1% in 2023. In Limpopo, more than three-fifths (61,7%) of households used open fires, followed by 51,3% in Mpumalanga. More than two-fifths (44,1%) of households resorted to candles as their primary alternative lighting source.
Access to proper shelter and services such as water, sanitation, and electricity are key indicators of household well-being. In recent years, there have been notable improvements in service delivery, driven by government initiatives, infrastructure investments, and partnerships with the private sector and civil society. For instance, the provision of basic services to informal settlements and underserved communities has been a priority, aiming to address historical inequalities and improve living conditions.
However, while there have been improvements in access to basic services and housing, inequalities persist, requiring sustained efforts to address infrastructure gaps, promote inclusive development, and enhance the resilience of communities in the face of future challenges.
The General Household Survey (GHS) was introduced twenty-two years ago in 2002 to track the progress of development across a wide variety of fields and to identify persistent service delivery gaps in themes ranging from social welfare, health and education, to housing, basic services and access to food.
For more information, download the full report here.