

South Africa is part of the consortium of nations that signed the 2030 Agenda for Sustainable Development, adopted by all United Nations members in 2015. The aim of the Sustainable Development Goal (SDG), Target 3.6 was to halve the number of global deaths and injuries from road traffic accidents by 2030.
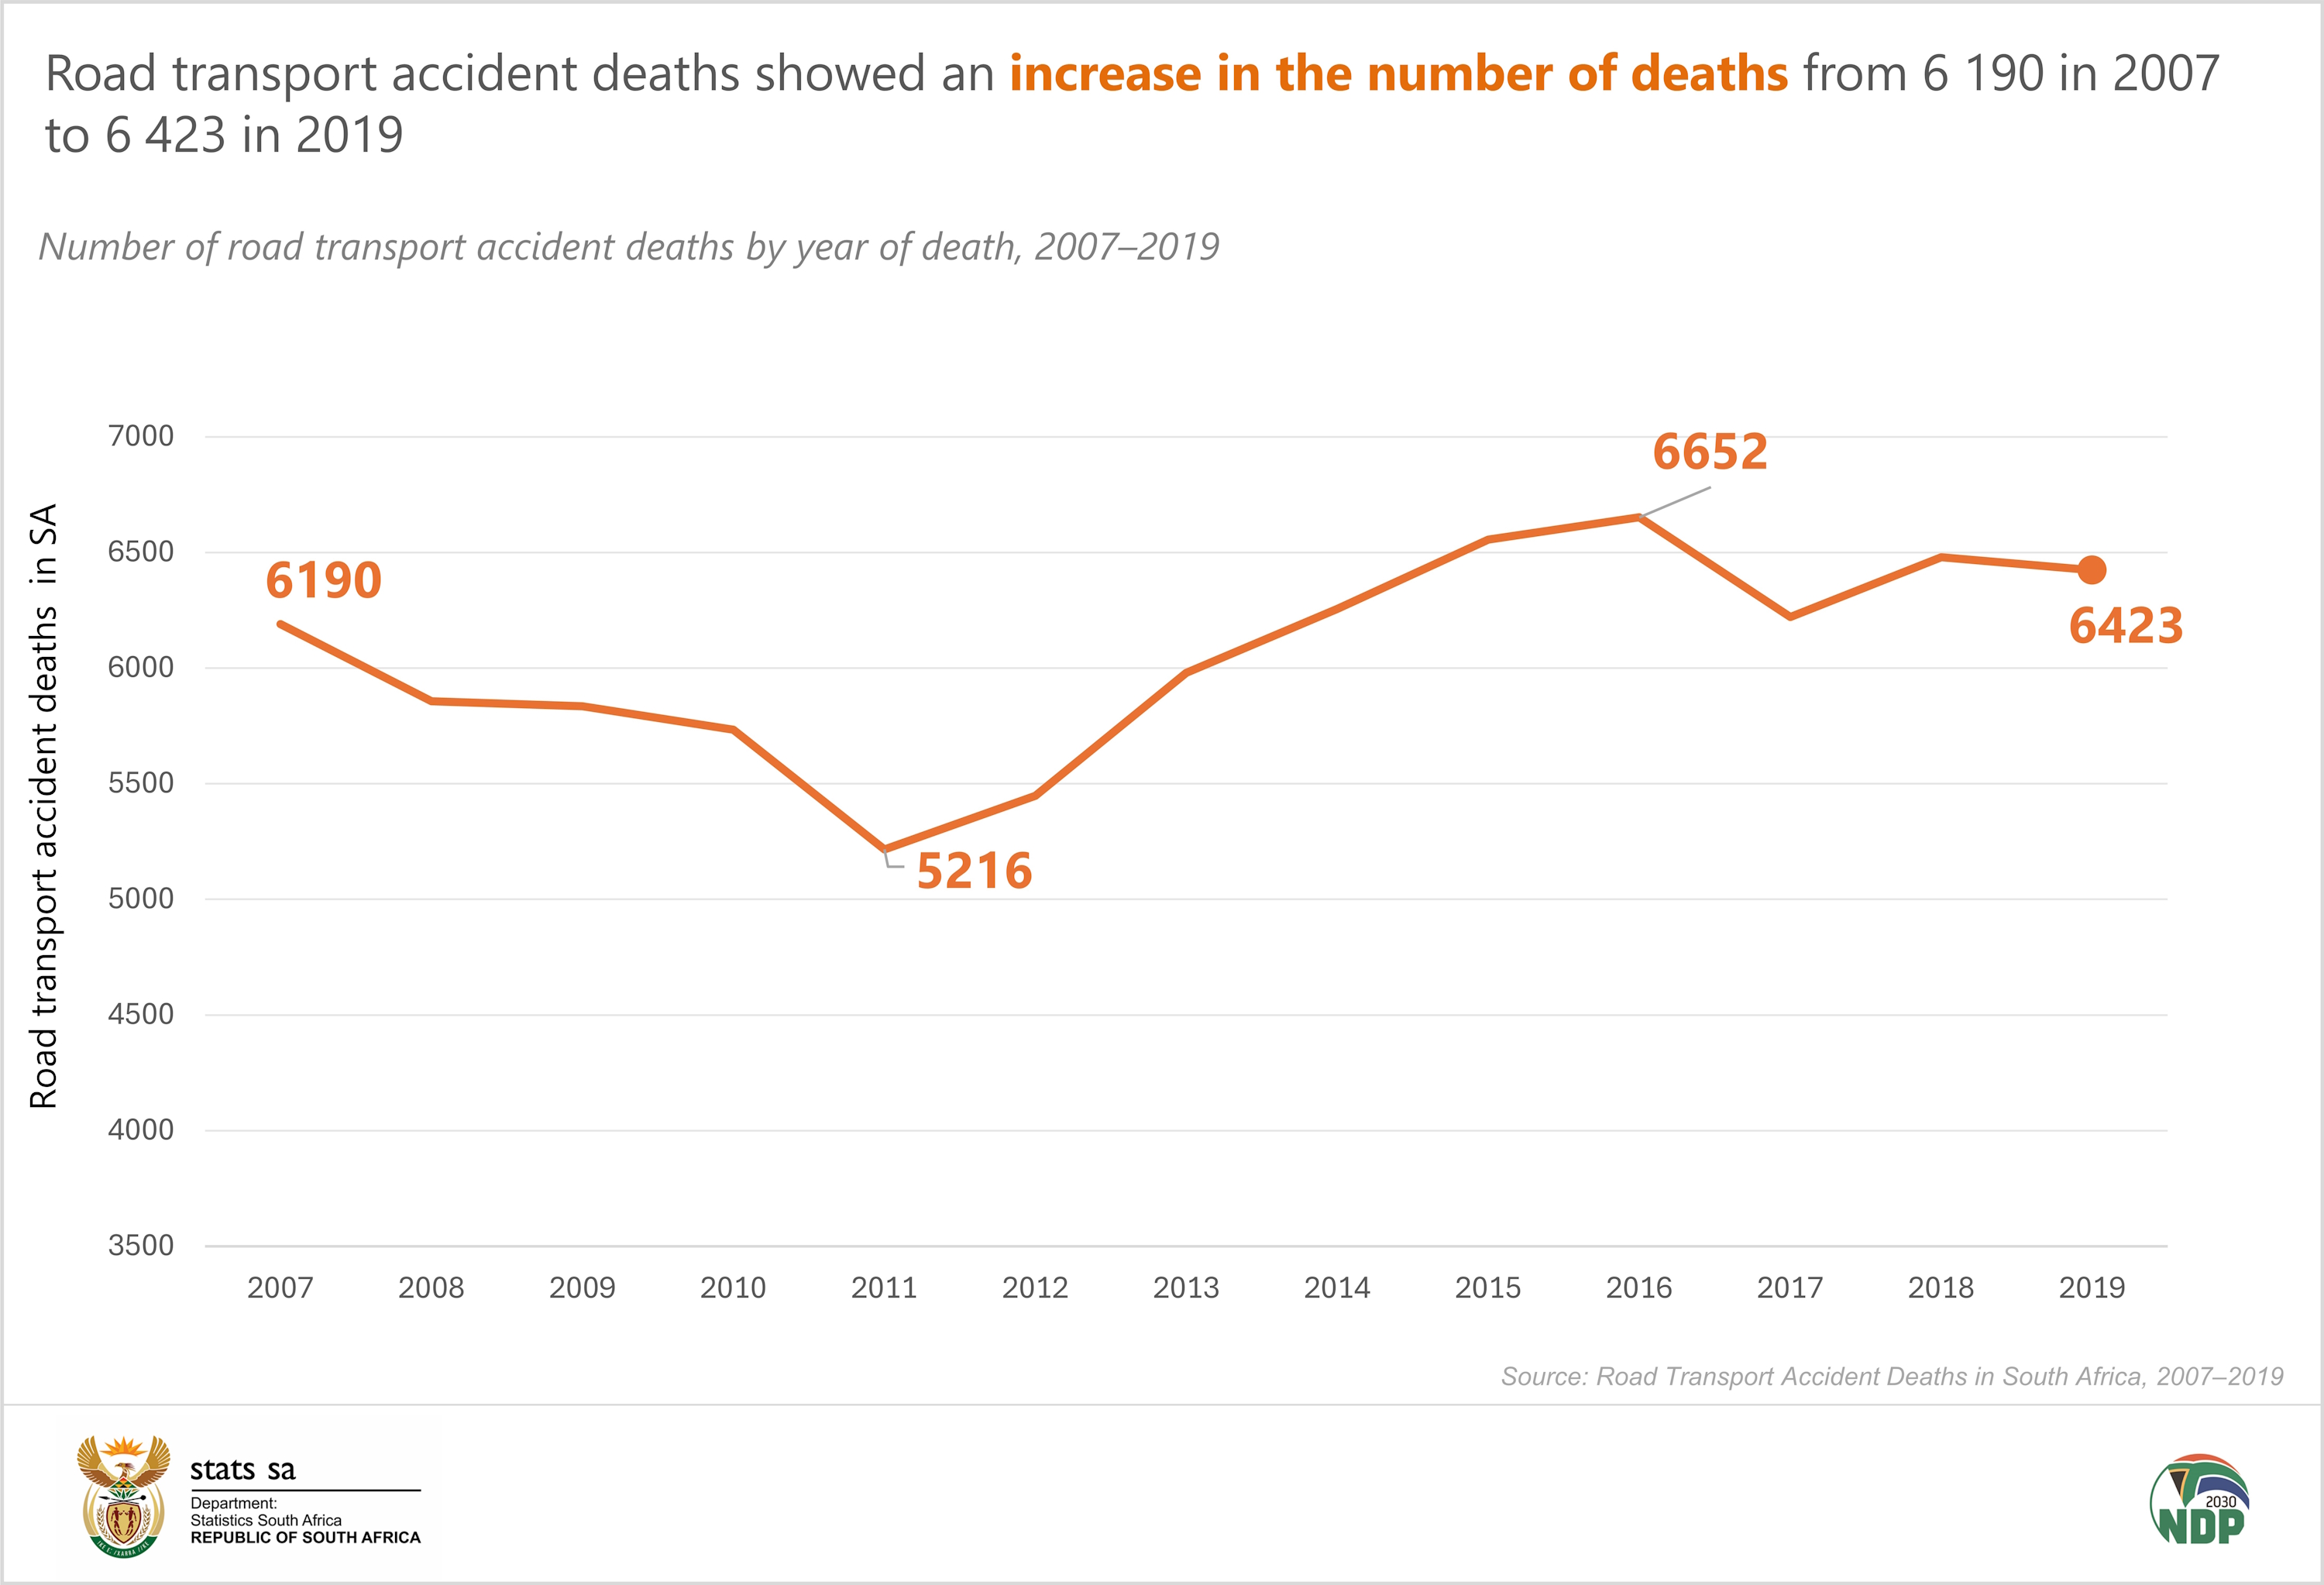
However, results of a new report released by Statistics South Africa (Stats SA) titled Road Transport Accident Deaths in South Africa, 2007-2019, reveals that the number of deaths resulting from road transport accidents escalated from 6,556 in 2015 to 6,652 in 2016, immediately following the declaration year of 2015.
Several factors contribute to road traffic accidents, including human error, inadequate infrastructure, vehicle defects, and environmental conditions. Human factors, such as speeding, reckless driving, distracted driving (often due to smartphone usage), and driving under the influence of alcohol or drugs, are among the primary causes. Additionally, fatigue and lack of sleep impair driver judgment and reaction times, increasing the likelihood of accidents.
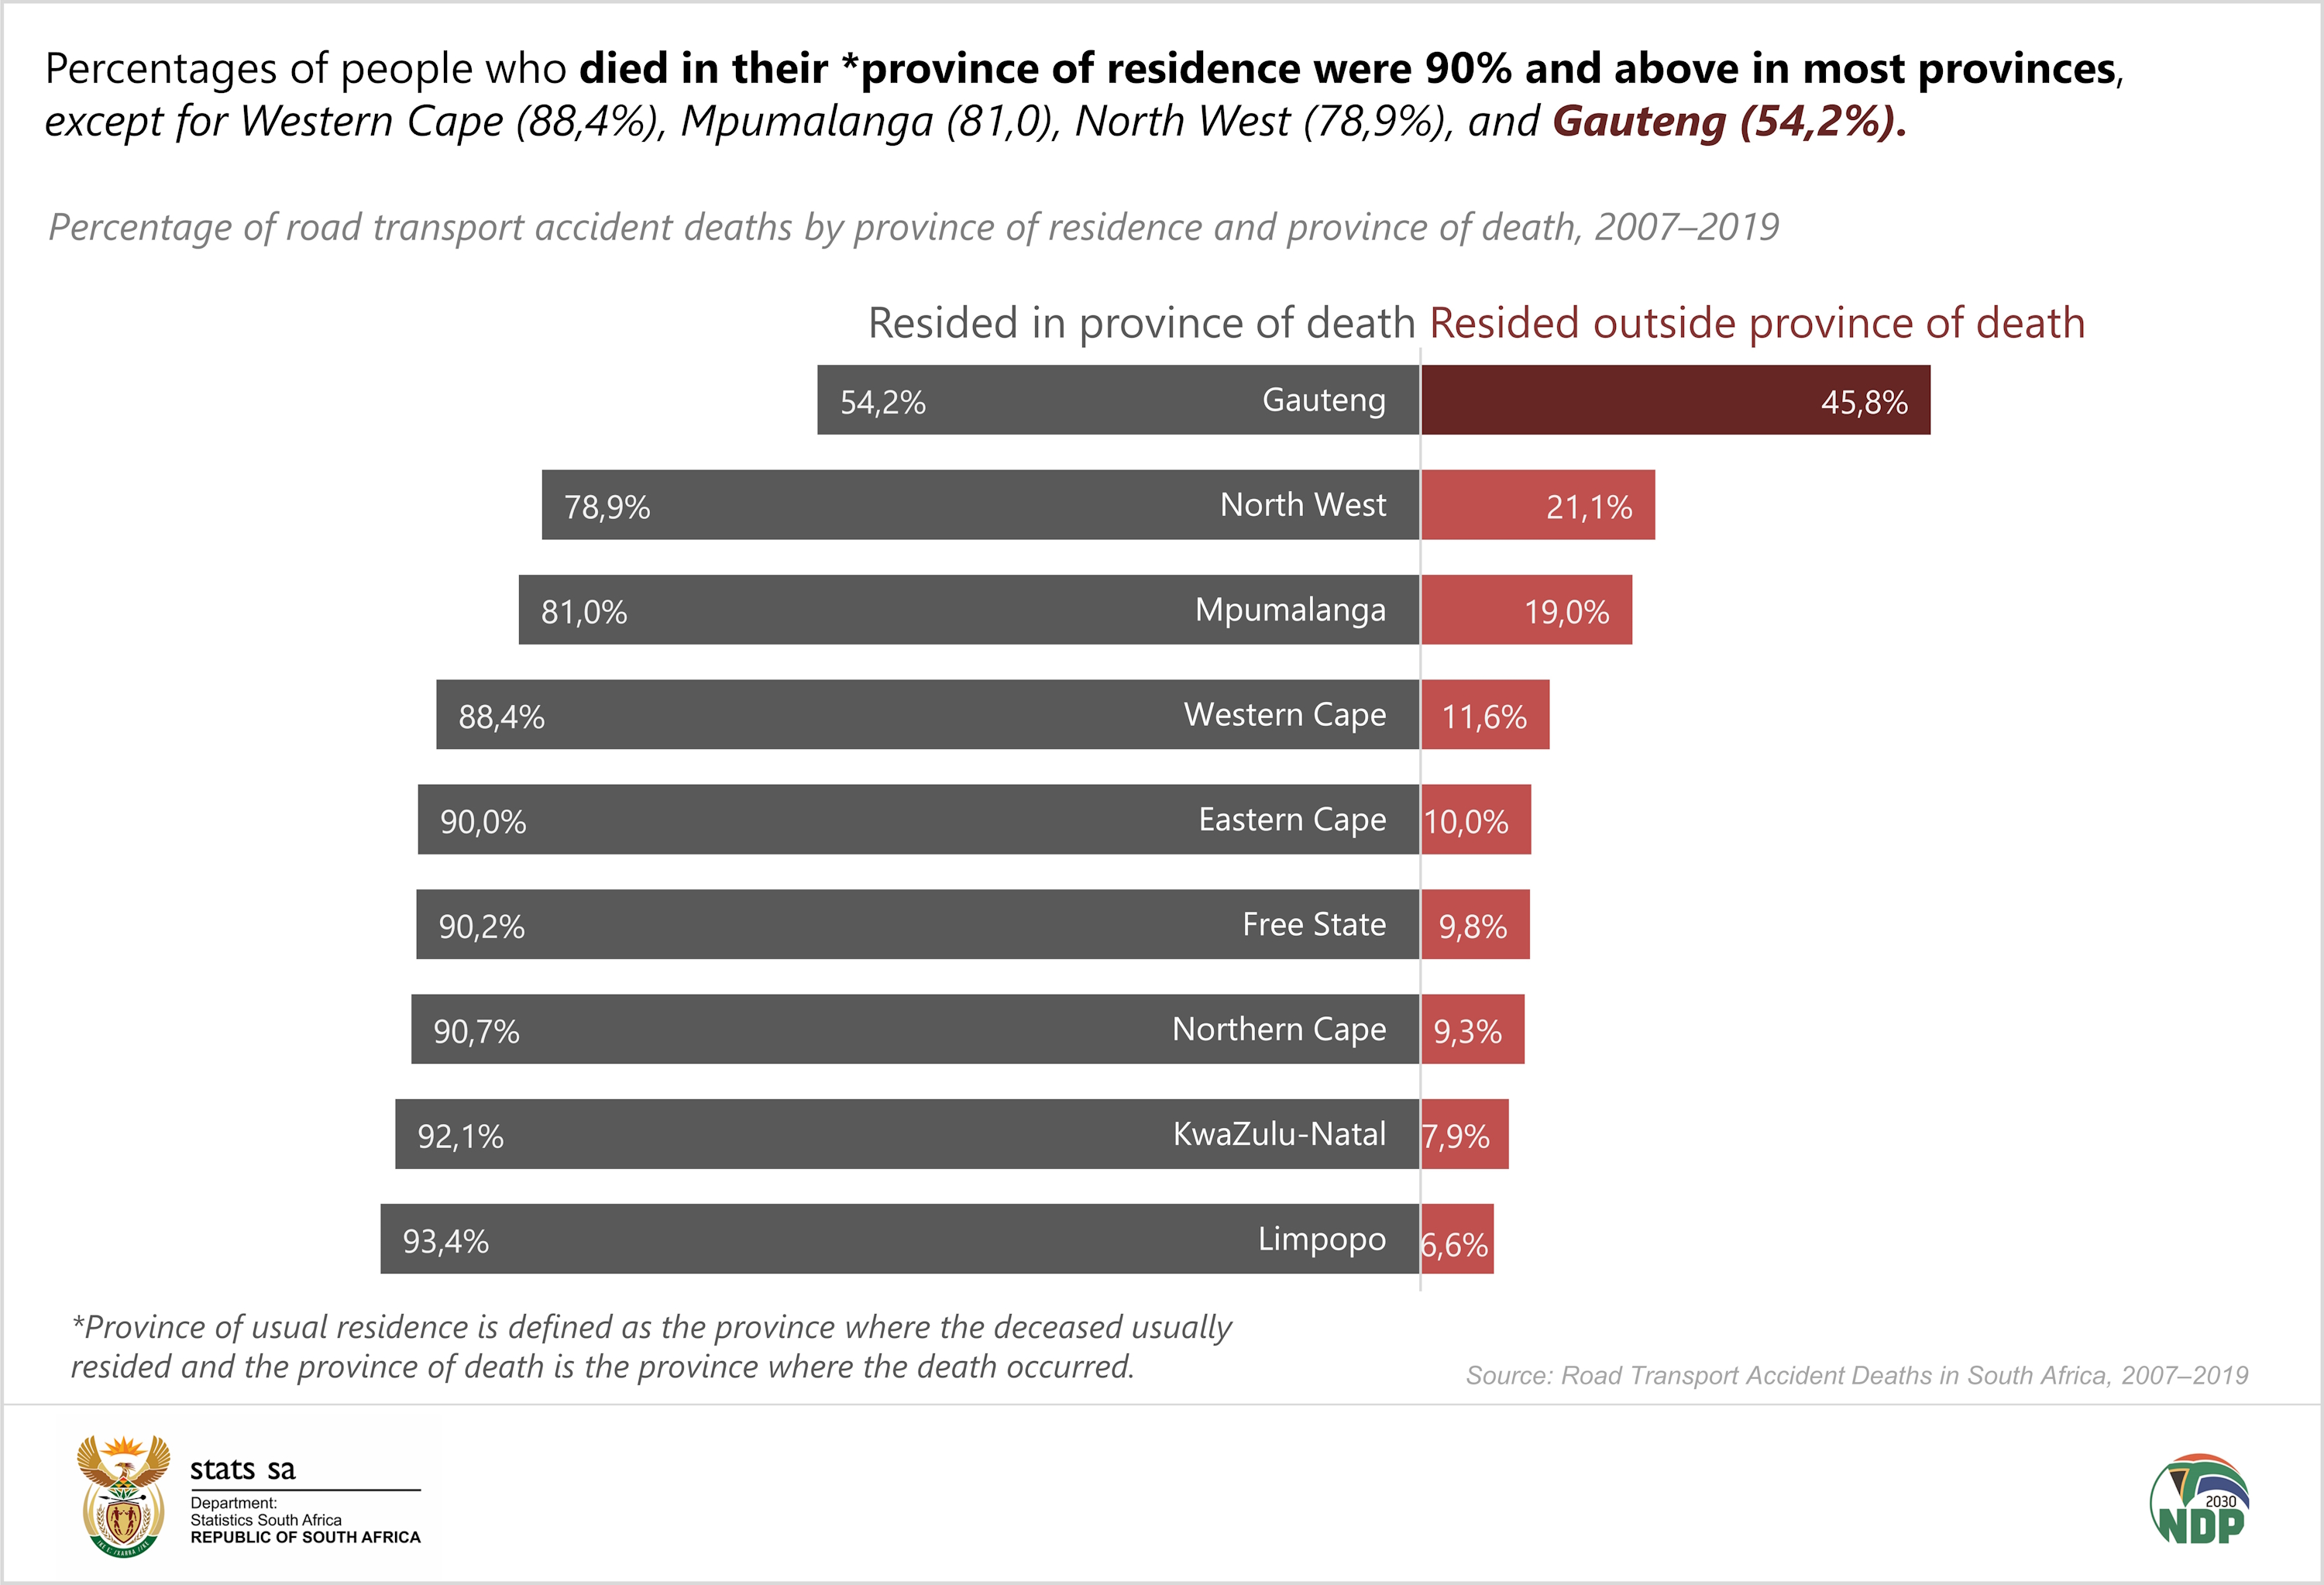
The cumulative figures for road transport accident fatalities between 2007 and 2019 indicate that individuals typically pass away in the province where they reside. KwaZulu-Natal and Limpopo exhibited higher proportions of fatalities occurring in the residents’ respective provinces, with rates of 92,1% and 93,4%, respectively. In contrast, Gauteng displayed a distinct pattern compared to other provinces, with a lower percentage of road transport accident fatalities occurring in the province of usual residence, at 54,2%.
Holiday periods often see a surge in road accidents due to various factors such as increased traffic volumes, alcohol consumption, fatigue, and adverse weather conditions. Traditionally, the Easter break falls between March or April, a time when one might anticipate a peak in road transport accident fatalities.
However, this report underscores that throughout the years 2007 to 2019, December consistently saw the highest number of road transport accident deaths compared to other months. Notably, December 2015 and 2016 recorded particularly elevated figures, with 719 and 783 deaths respectively. Furthermore, December 2019 registered the highest proportion of road transport accident fatalities at 10,1%, followed by June at 9,6% and September at 9,1%.
In 2019, hospitals emerged as the predominant location for road transport accident fatalities, comprising 27,5% of occurrences. Individuals declared deceased upon arrival at any healthcare facility constituted 13,0%, while those who succumbed in hospital emergency rooms accounted for 9,3% of road transport accident deaths during the same year. Throughout the period from 2007 to 2019, hospitals consistently represented the most prevalent site of death, with exceptions noted in the Western Cape, Free State, and Northern Cape, where individuals were declared deceased prior to reaching a healthcare facility.
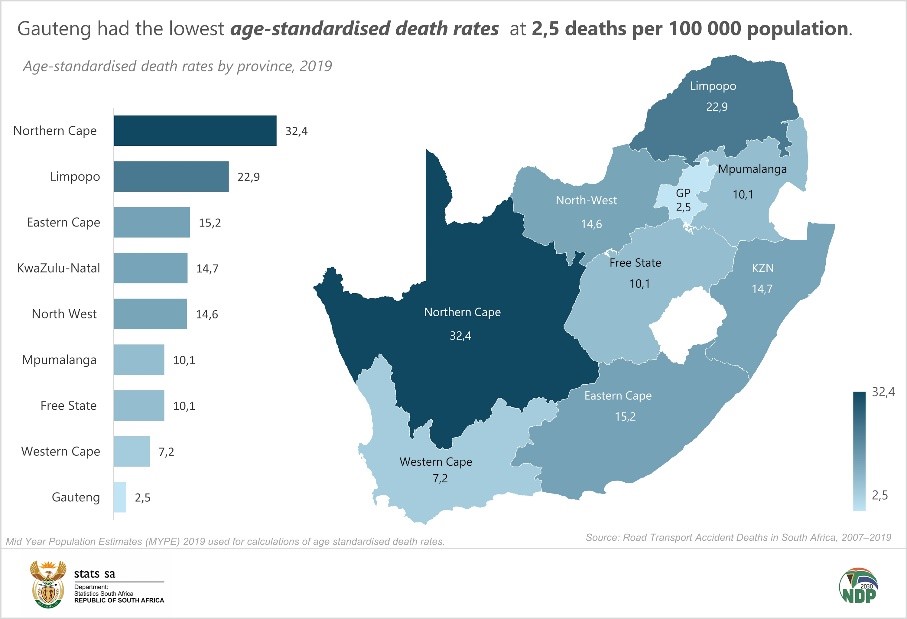
In 2019, KwaZulu-Natal reported the highest percentage of road transport accident deaths at 24,4%, with Limpopo following closely at 19,8% and the Eastern Cape at 14,7%. Despite KwaZulu-Natal having the highest proportion of road transport accident fatalities in 2019, the Northern Cape recorded the highest age-standardised death rates (ASDR) at 32,4 per 100,000 population, trailed by Limpopo at 22,9 deaths per 100,000 population. Conversely, Gauteng exhibited the lowest ASDR at 2,5 deaths per 100,000 population. The age-standardised mortality rate represents the quantity of deaths per 100,000 individuals within the average population, maintaining a consistent age distribution throughout the entire reference period.
According to the report, only two types of road users were selected for further analysis: people who died as pedestrians; and those who died as car occupants. The incidence of pedestrian fatalities exceeded that of car occupants in the years 2007, 2013, and 2019. Over this period, there was an uptick in pedestrian fatalities, rising from 640 deaths in 2007 to 771 deaths in 2019. Pedestrian fatalities displayed fluctuations between 2007 and 2019, reaching a low point of 353 deaths in 2010 and peaking at 771 deaths in 2019.
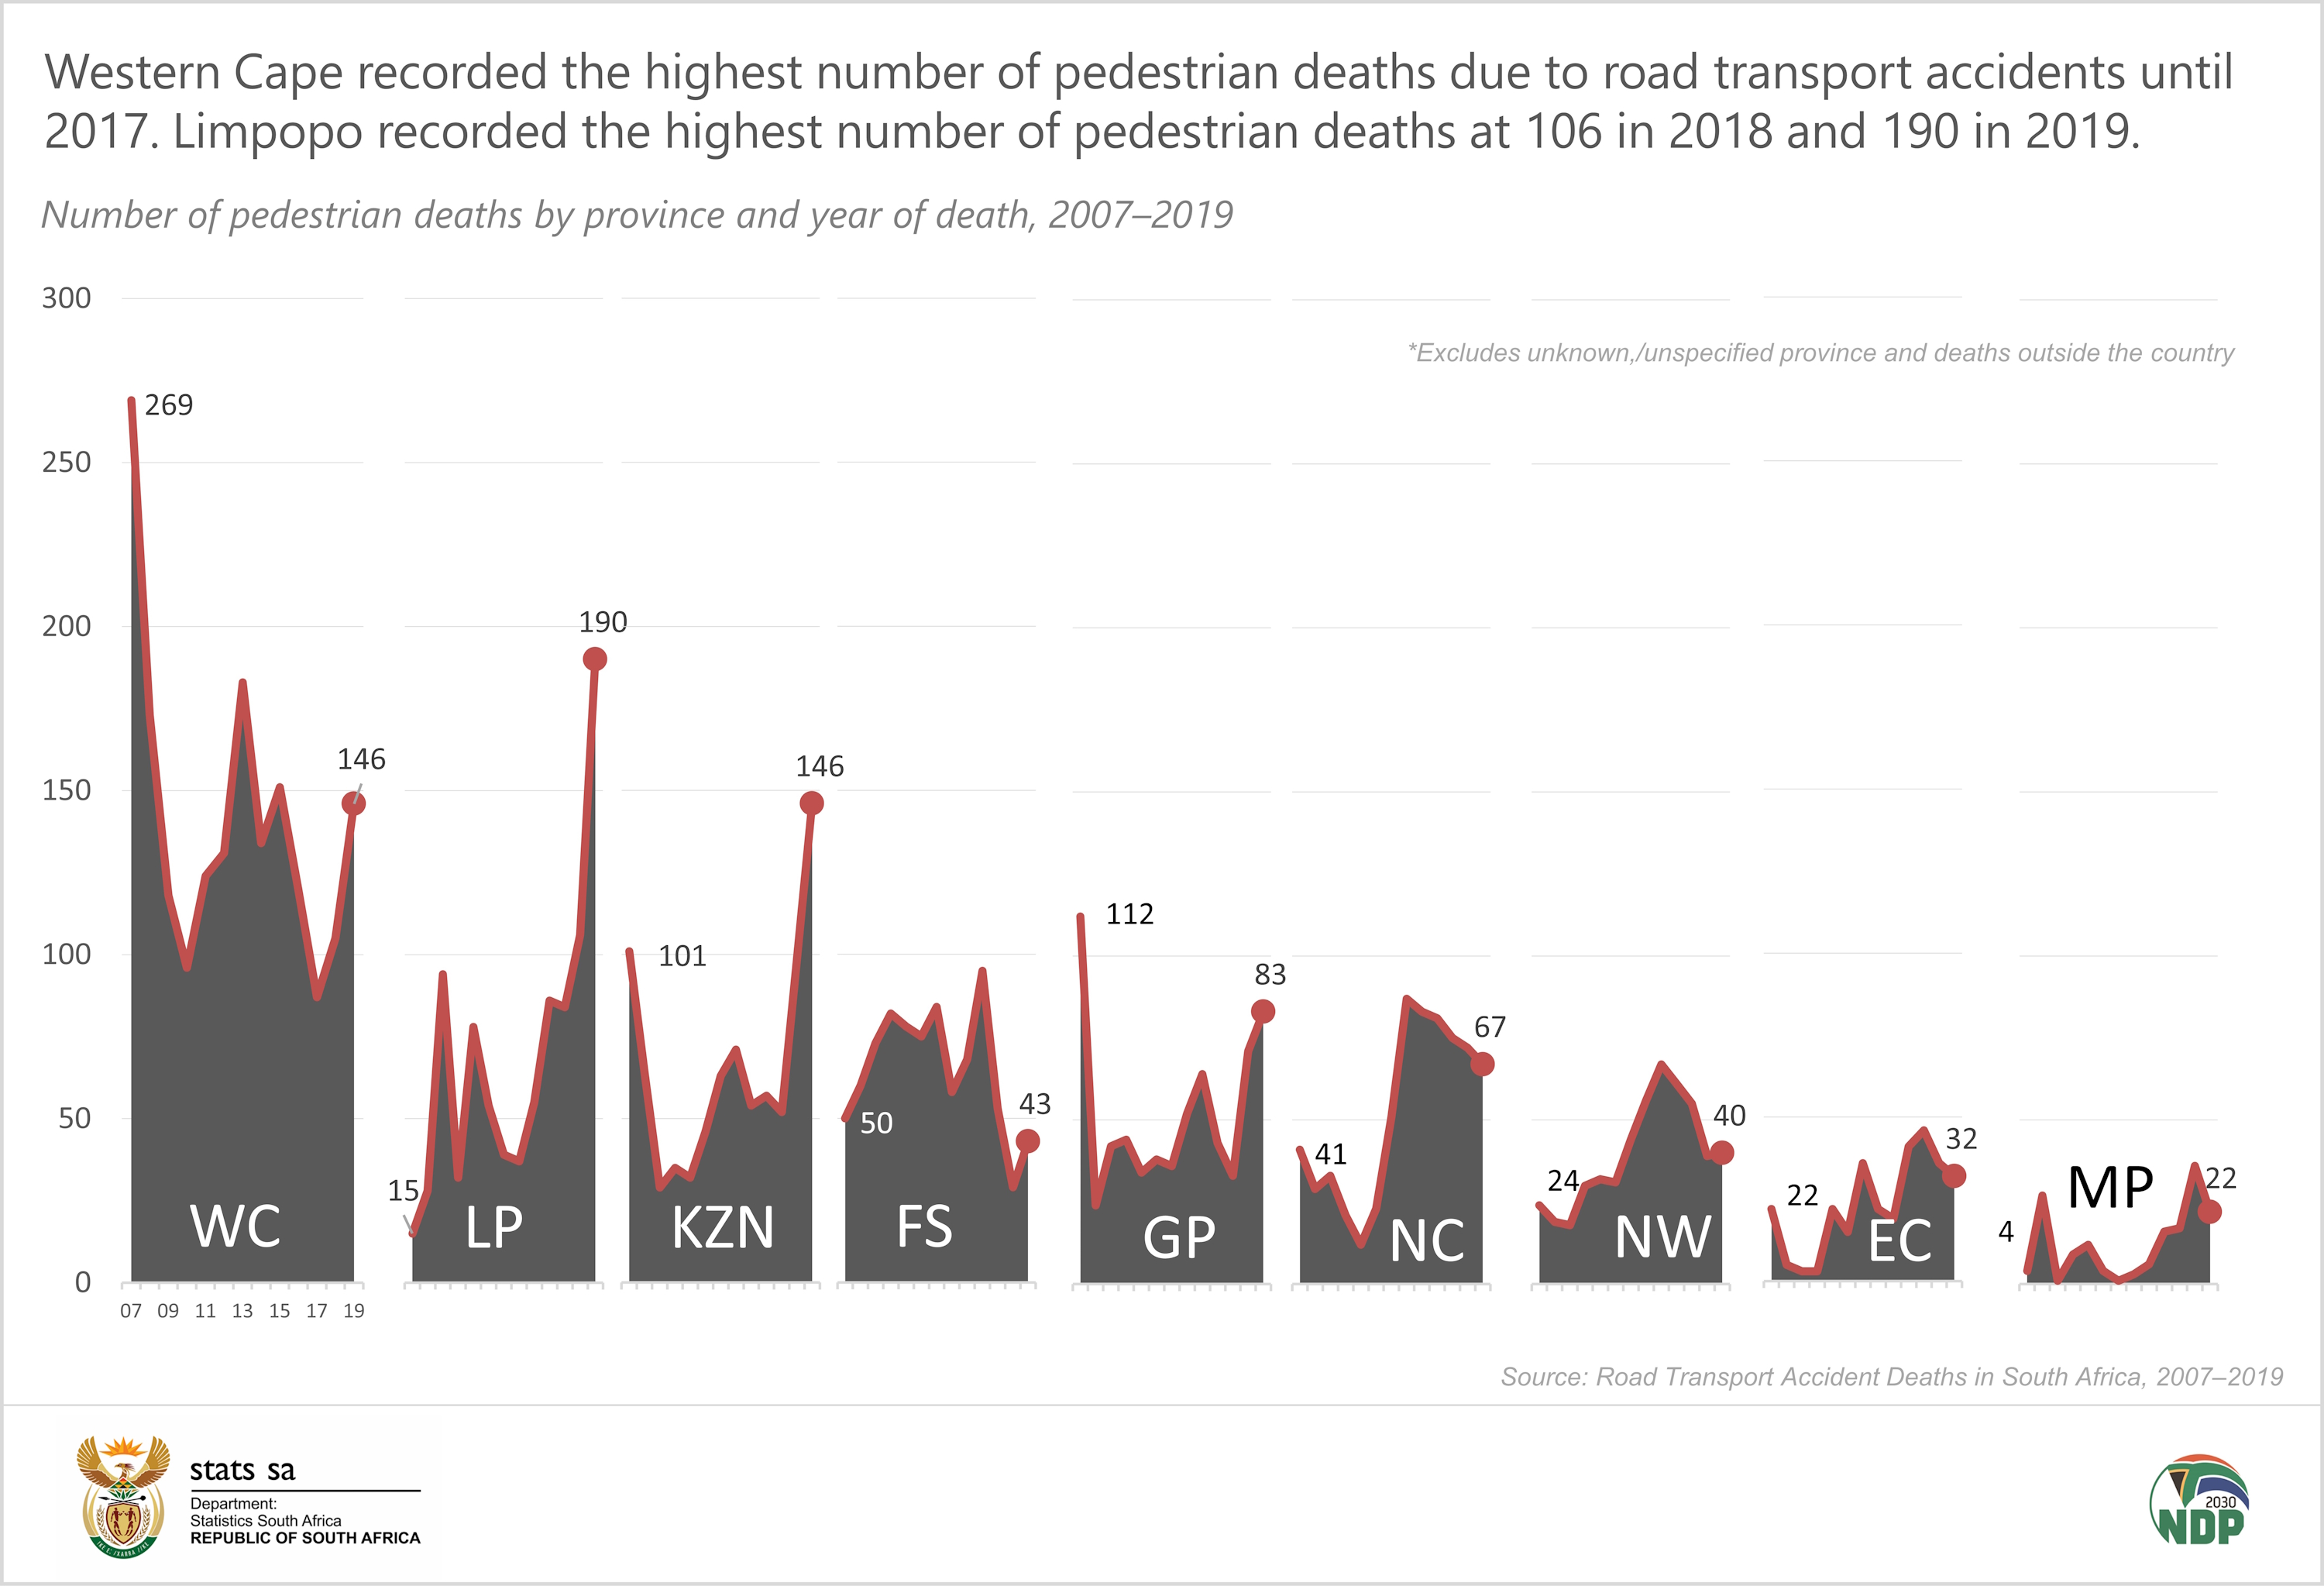
Notably, the Western Cape consistently reported the highest number of pedestrian deaths due to road transport accidents, except in 2018 and 2019 when Limpopo recorded the highest figures, with 106 deaths in 2018 and 190 deaths in 2019. Despite Western Cape typically recording the highest pedestrian fatality rates, the province experienced a decline in such deaths from 269 in 2007 to 146 in 2019. Conversely, pedestrian fatality numbers in other provinces have demonstrated fluctuations over the years, with Limpopo showing an increasing trend. Mpumalanga consistently reported the lowest number of pedestrian deaths across most reporting years.
Implementing stricter traffic regulations, enforcing speed limits, and cracking down on drunk driving remain crucial steps in reducing accidents. Investing in better road infrastructure, including the construction of safer intersections, pedestrian crossings, and dedicated bike lanes, can also enhance road safety.
Achieving SDG Target 3.6 involves comprehensive efforts across multiple sectors, including transportation, infrastructure development, public health, law enforcement, and education. By working collaboratively and implementing evidence-based interventions, governments, organisations, and communities can strive towards reducing the toll of road traffic accidents, ultimately contributing to the overarching goal of sustainable development.
For more information, download the full report here.