

There is so much need but not enough money. Often faced with hard decisions on where to allocate scarce resources, governments usually have their own unique spending priorities.
The South African government spent R2 187 billion (or R2,19 trillion) in the 2021/2022 fiscal year. This was R83 billion more than the R2 104 billion recorded in 2020/2021. Stats SA’s Financial statistics of consolidated general government statistical release1 covers financial data for 702 institutions across national, provincial and local governments, extra-budgetary accounts and funds, and higher education institutions (excluding public corporations).
Government spending is classified in either functional or economic terms. In functional terms, expenditure is broken down according to the various activities or services that government is involved in. Health, education and defence are examples. In economic terms, expenditure is classified according to the nature of the transactions involved. For example, goods and services, compensation of employees, and interest.
Figure 1 breaks the R2 187 billion into functional and economic categories, indicated in the rows and columns of the table respectively. In functional terms, general public services2 was the most expensive activity, accounting for R565,2 billion of government spending in 2021/2022. In economic terms, compensation of employees (i.e. salaries and wages of public servants) was the most expensive item, accounting for R799,8 billion.
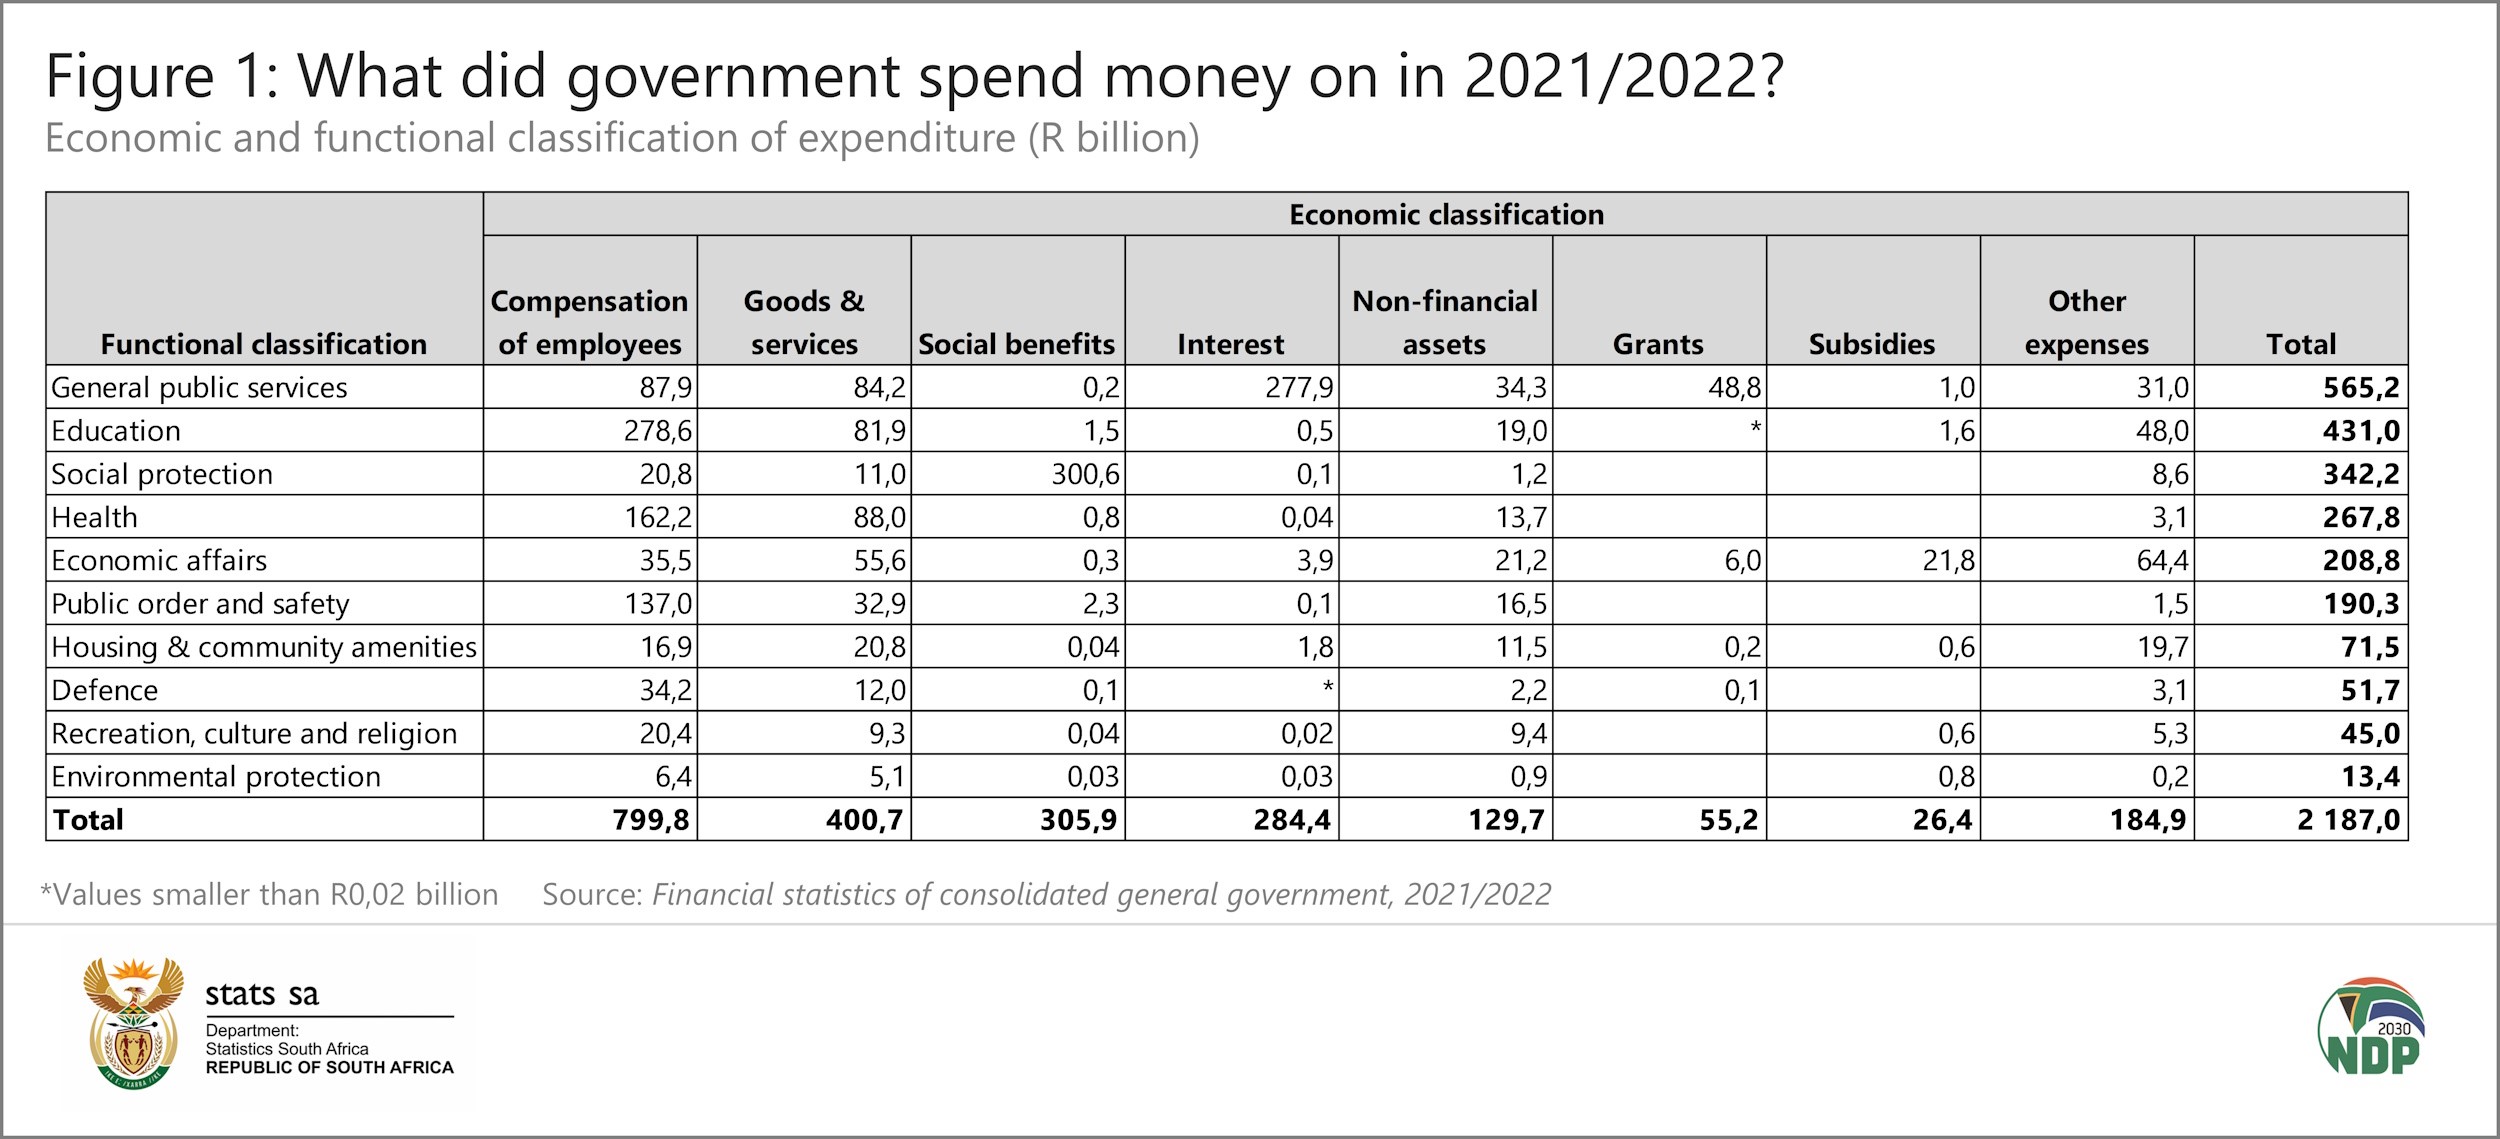
The public wage bill accounts for over a third of total spending
Government’s spending priorities are highlighted if the values above are expressed as percentages of the total. Compensation of employees accounted for 36,6% of total expenditure in 2021/2022 (Figure 2). Compensation of employees was mainly concentrated in education, accounting for 12,7% of total expenditure, followed by health (7,4%) and public order and safety (6,3%).
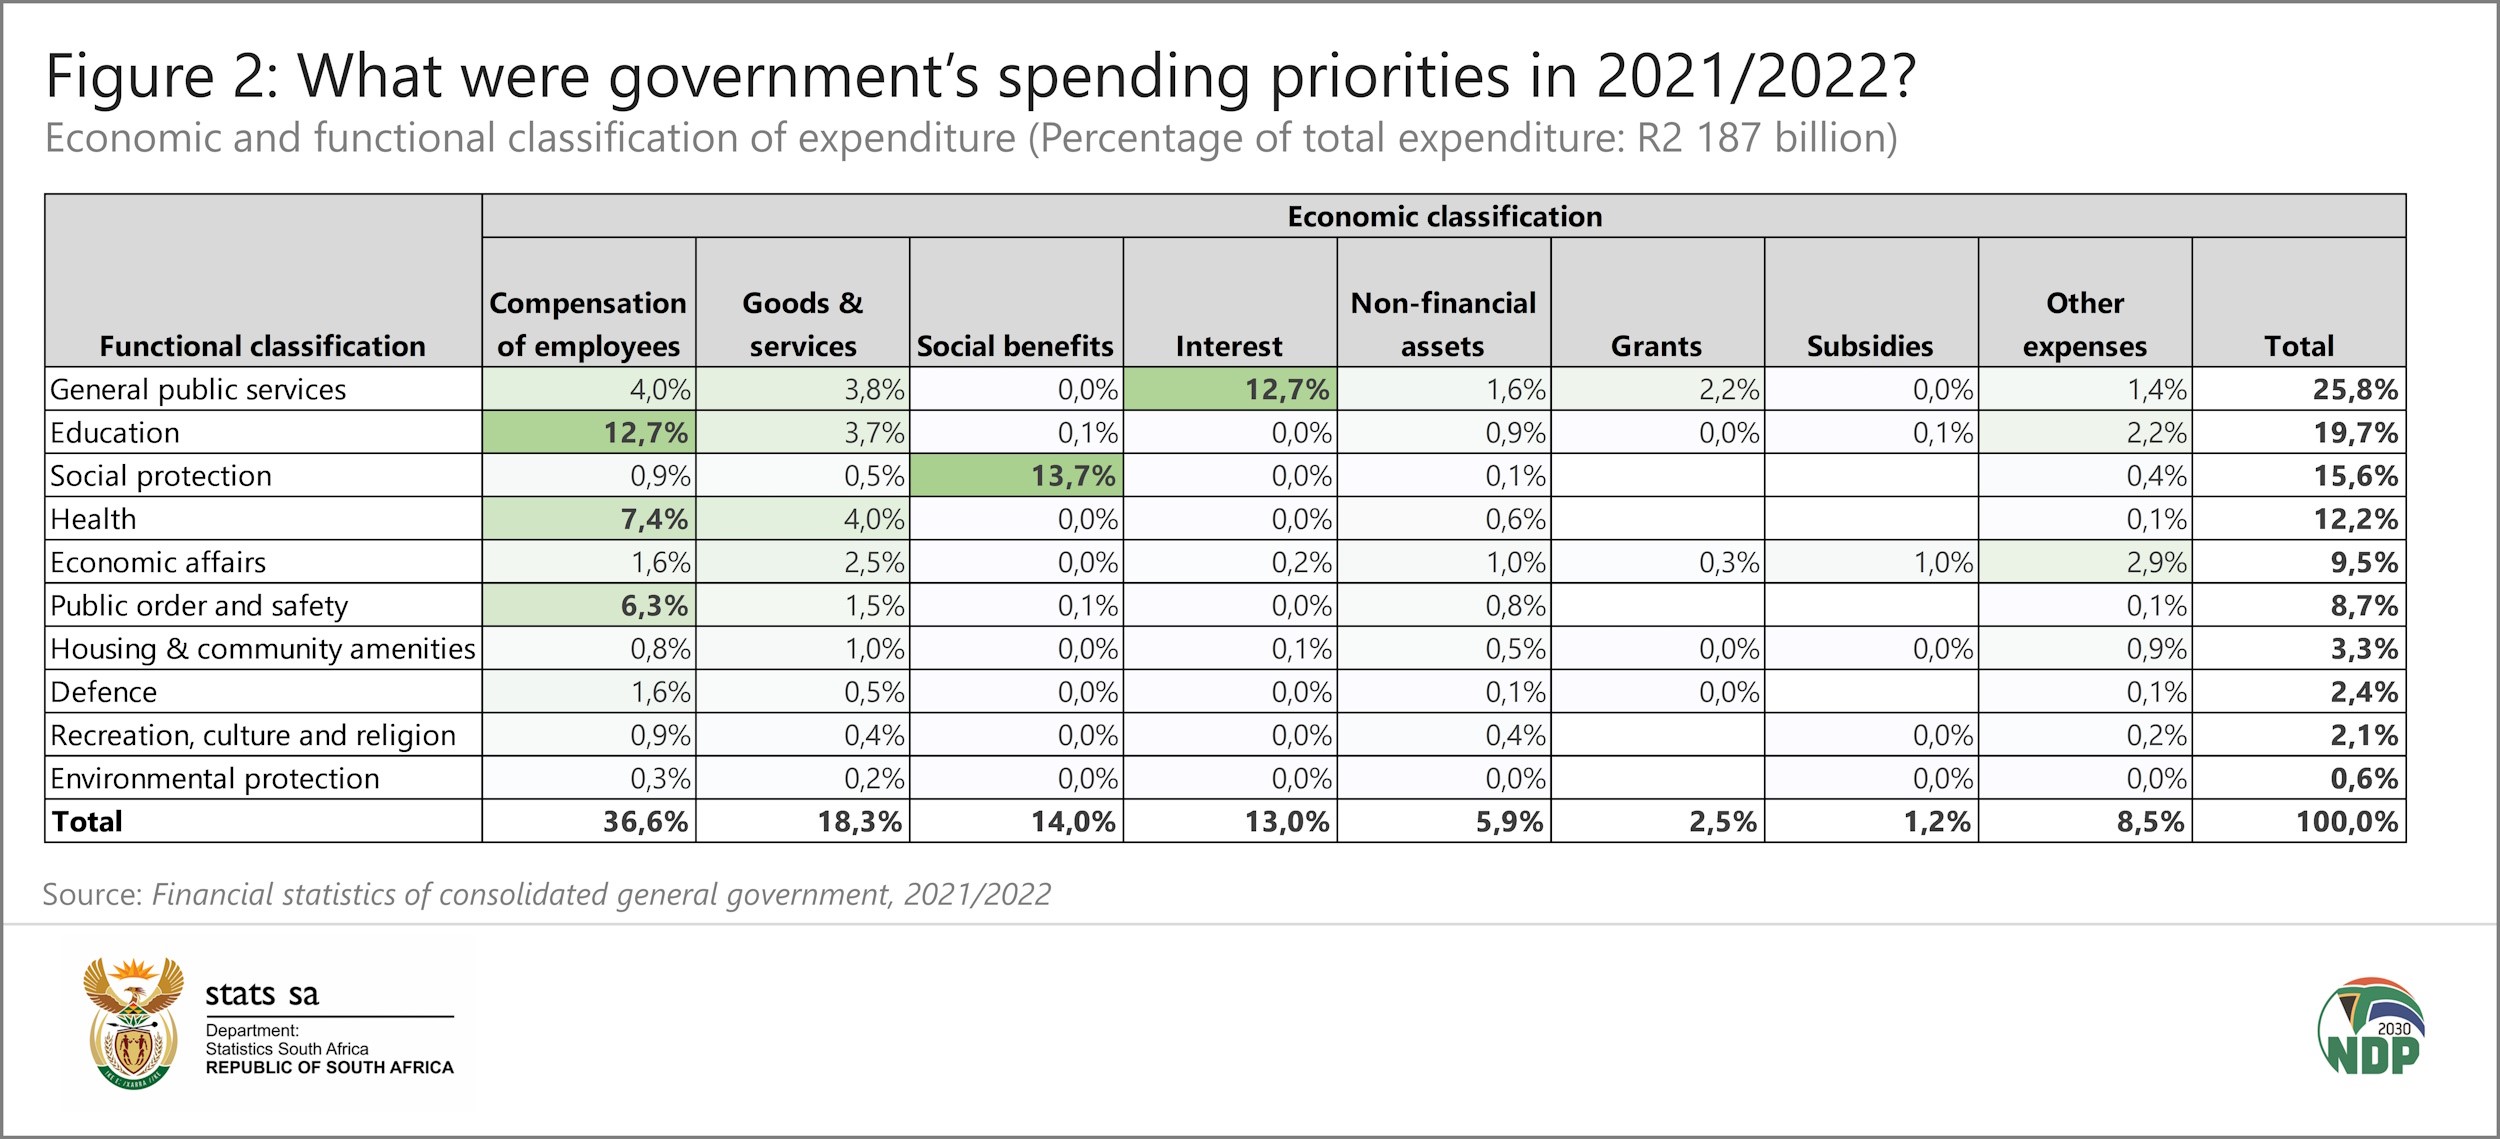
Other large budget items in 2021/2022 include social benefits (in the function of social protection), accounting for 13,7%, and interest payments on government debt (in the function of general public services), accounting for 12,7%. Social benefits mainly include the payment of social grants to households.
Changes over time
We can go further by including the variable of time. Figure 3 shows items that recorded a rise (blue) and a decline (orange) in percentage share in 2021/2022 compared with 2014/2015, the earliest year for which easily comparable data are available. For example, in 2014/2015, total compensation of employees accounted for 37,5% of total government expenditure, slipping to 36,6% in 2021/2022. This represents a decline of 0,9 of a percentage point. Note that this does not mean that the line item has decreased in rand terms. In fact, the public wage bill rose from R513,5 billion to R799,8 billion over this period. Rather, what Figure 3 shows is that this line item is contributing slightly less (in percentage terms) to the total spending pie.
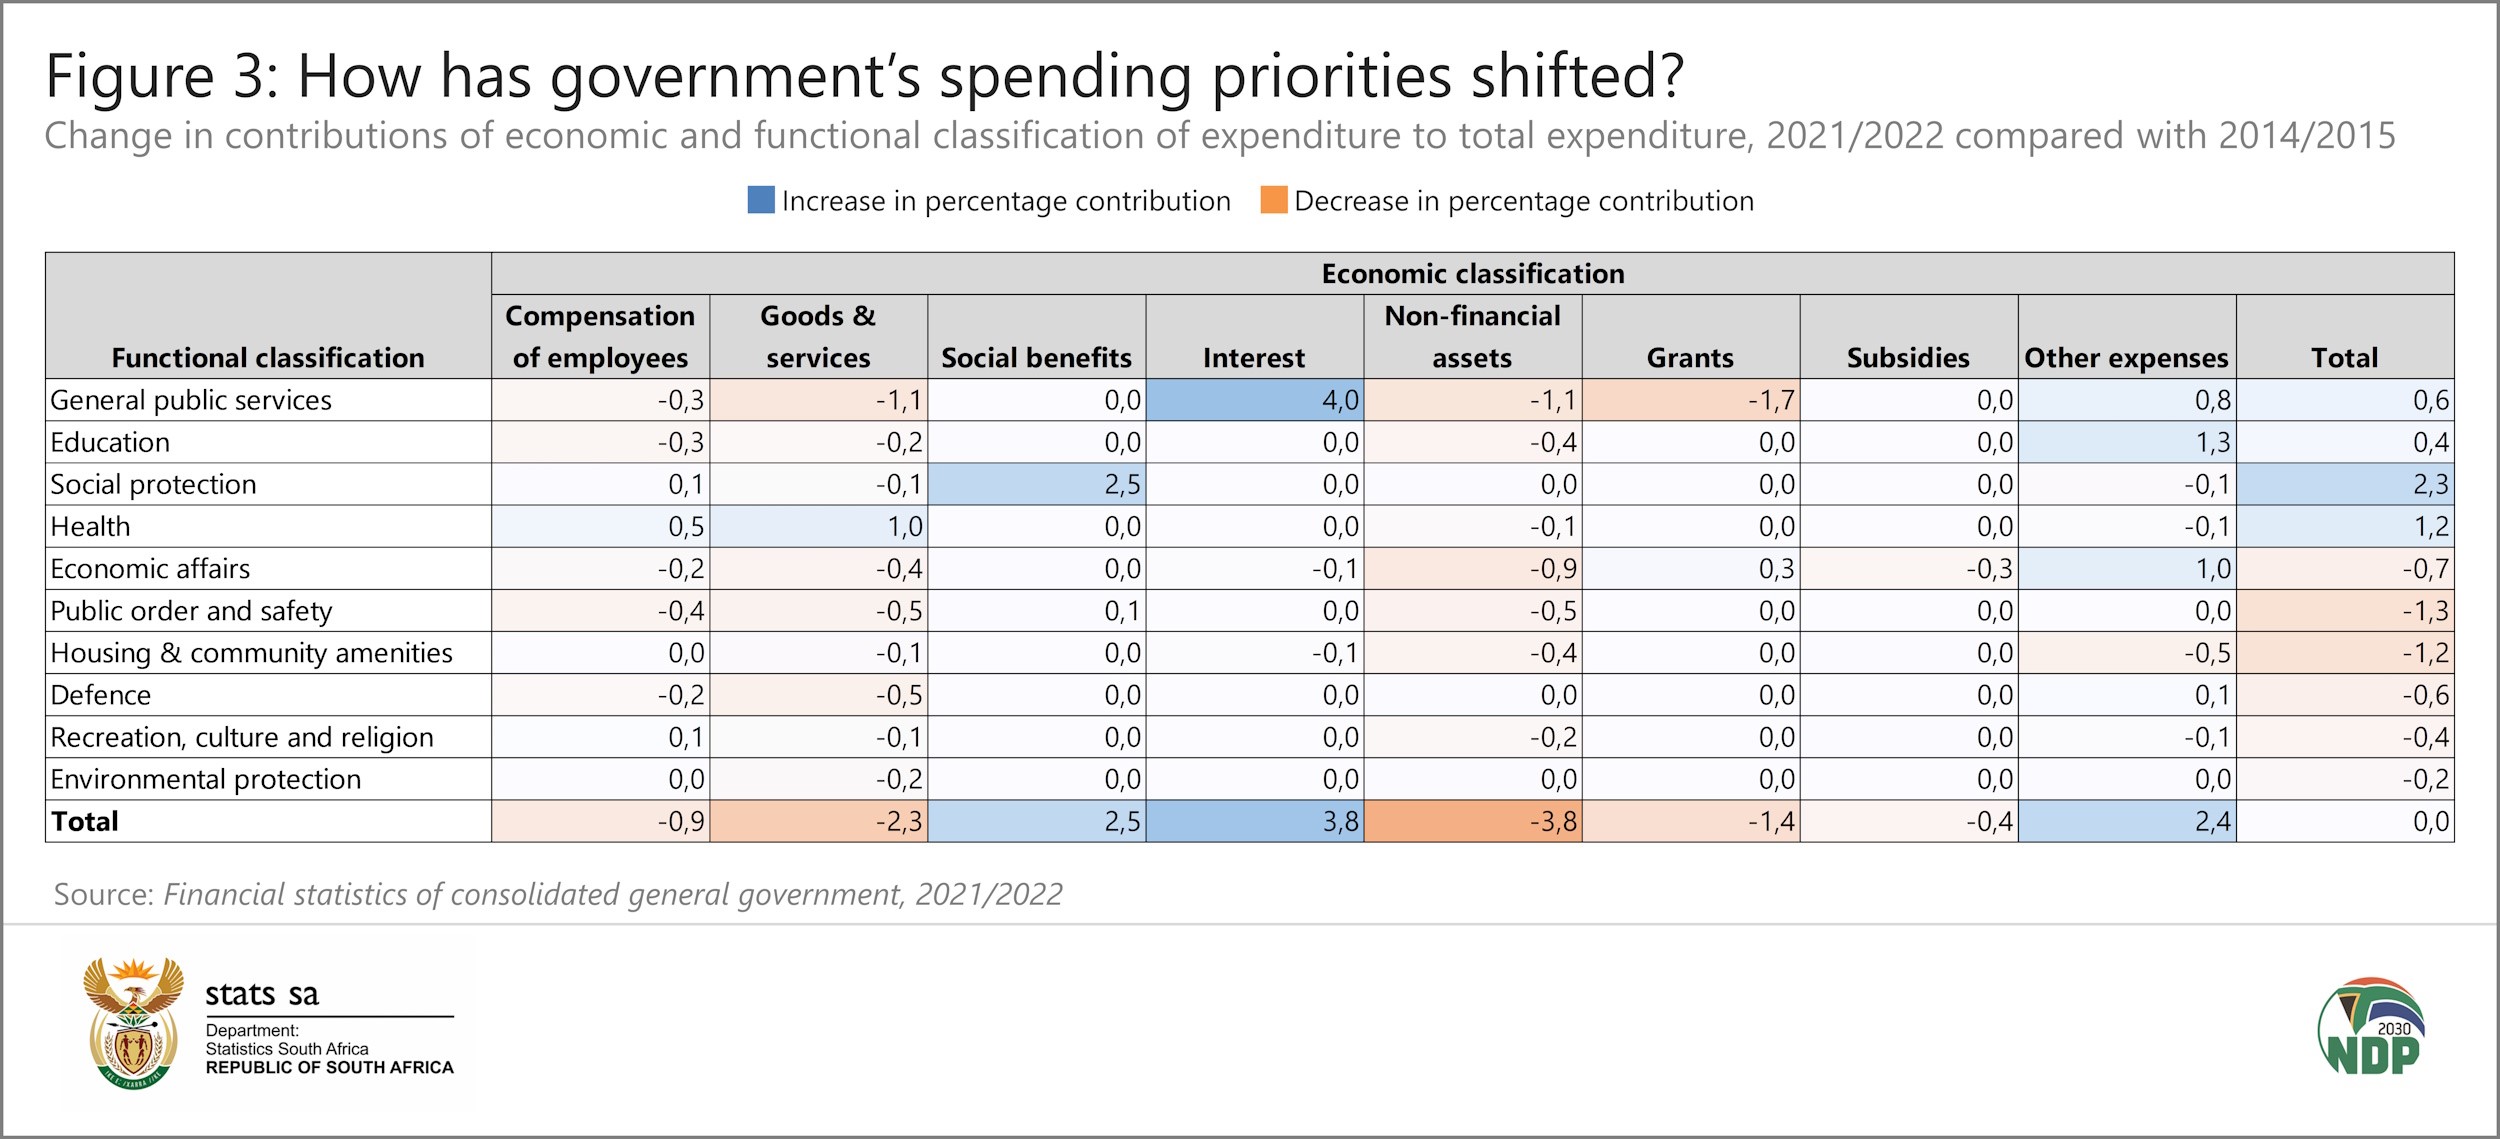
What immediately stands out from Figure 3 is the decline in purchases of non-financial assets, falling by 3,8 percentage points from 9,7% of total expenditure in 2014/2015 to 5,9% in 2021/2022. This category mainly includes investments in infrastructure and other fixed assets. The functions that recorded the biggest percentage point declines under purchases of non-financial assets were general public services (most notably, executive and legislative organs), economic affairs (most notably, road transport), public order and safety (most notably, police services), housing and community services (most notably, water supply), and education.
Goods and services registered the second largest decline, concentrated mainly in general public services, public order & safety, defence and economic affairs. There was, however, an increase in the contribution of goods and services related to health.
Interest recorded the largest increase in percentage share. Interest payments on government debt increased from R125,6 billion (9,2% of total spending) in 2014/2015 to R284,4 billion (13,0% of total spending) in 2021/2022. This rise in interest payments was mainly in line with the sharp rise in South African gross loan debt over this period.3
Social benefits registered the second largest increase.
In a nutshell, what does this tell us? That the focus of government spending has shifted away from non-financial assets (which includes investment in infrastructure) and goods and services, and towards social benefits and interest payments on debt.
For more information, download the 2021/2022 Financial statistics of consolidated general government statistical release and time series data here.
1 When interpreting these figures, note that the data published in the Financial statistics of consolidated general government statistical release (a) are adjusted for the reference period 1 April – 31 March and (b) in order to compare across all levels of government, data are converted from an accrual basis of recording to a cash basis of recording.
2 General public services include costs mainly related to the administration of parliament, the provincial legislatures and mayoral offices, as well as interest payments on debt.
3 National Treasury, 2022 Budget Review, Table 10 (download here).
Similar articles are available on the Stats SA website and can be accessed here.
For a monthly overview of economic indicators and infographics, catch the latest edition of the Stats Biz newsletter here.