
Quarterly Financial Statistics: Ratio Analysis
Given the vast amount of information appearing in detailed financial statements of companies, it may be difficult to discern significant relationships and trends in the data. One way to address this challenge is to use accounting ratios, which provides substantial insights into the relationships between variables and can indicate certain trends. Accounting ratios are calculated by comparing two or more financial balances where an economic relationship exists (such as profit and sales). The calculated ratio can be compared with an entity’s previous financial results or with the industry standard in which the entity operates. For example, a user may want to evaluate the profitability of a specific enterprise in relation tothe industry standard.Ratio analysis can provide significant insight into the performance and financial position of an enterprise at a specific time and possible future financial assessments.
The Quarterly Financial Survey (QFS) conducted by Stats SA reports, amongst other financial variables of income and expenditure, capital expendture and inventories, selected operating financial ratios for each industry covered by the survey. These ratios include:
- total asset turnover,
- inventory turnover,
- times interest earned,
- return on total assets,
- profit margin,
- dividend payout ratio,
- total capital expenditure and
- total fixed assets
To illustrate the significance of ratio analysis, this article will examine the profit margin ratio (which expresses the profit or loss before tax as a percentage of sales). The profit margin ratio is calculated by dividing the profit or loss before tax by sales or by turnover as presented in the survey. The profit margin ratio measures how much of each rand earned by the industry is translated into profits and provides insight into the industry’s pricing policies, cost structure and production efficiency.
The net profit margin ratio also indicates how efficient an industry is and how well it controls its costs. The higher the margin, the more effective the industry is in converting revenue into actual profit.
Figure 1: Comparison of the profit margin ratio for the quarters ended March 2013 and June 2013
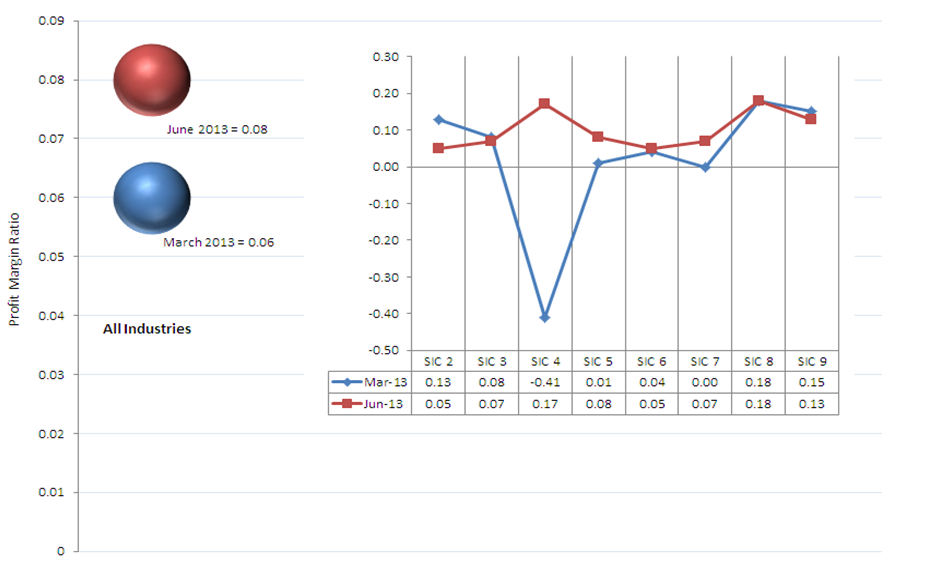
SIC 2 – Mining and quarrying industry
SIC 3 – Manufacturing industry
SIC 4 – Electricity, gas and water supply industry
SIC 5 – Construction industry
SIC 6 – Trade industry
SIC 7 – Transport, storage and communication industry
SIC 8 – Real estate and other business services industry (excluding financial intermediation and insurance)
SIC 9 – Community, social and personal services industry (excluding government institutions)
Figure 1 shows a comparison of the profit ratios per industry between the quarters ended March 2013 and June 2013.The all industries profit margin showed an increase from 0,06 to 0,08 between the March and June2013.Four of the eight industries reported an increase in the profit margin ratio during the same period. The largest increase occurred in the electricity, gas and water supply industry, which turned around a loss (-0,41) in the previous quarter to 0,17 profit in the June 2013 quarter; the increase can be attributed to an increase in net profit before tax that was considerably larger than the increase in turnover. Real estate and other business services (excluding financial intermediation and insurance) remained the same (0,18) while the mining and quarrying industry showed the largest decrease, from 0,13 to 0,05.
Financial operating ratios can also be applied to the estimates generated for small, medium and large enterprises. This facilitates comparison between the financial performance and position of the different group size categories within each industry. An entity operating in a specific industry can compare its financial results with other similar industry participants using aggregated values according to small, medium and large estimates.
In the previous article published on the 27 June 2013,it was shown how companies are grouped into large, medium and small subgroups within each industry, depending on their annual turnover. The QFS uses cut-off points determined by the Department of Trade and Industry to group enterprises into small, medium and large categories.
Financial ratios for small, medium and large size groups can be calculated using the above information as well as the formula for each specific ratio as presented in the QFS publication. For example,the following formula is applied to the small, medium and large estimates to calculate the profit margin ratio:
Profit margin = [Net profit or loss before tax ÷ Turnover]
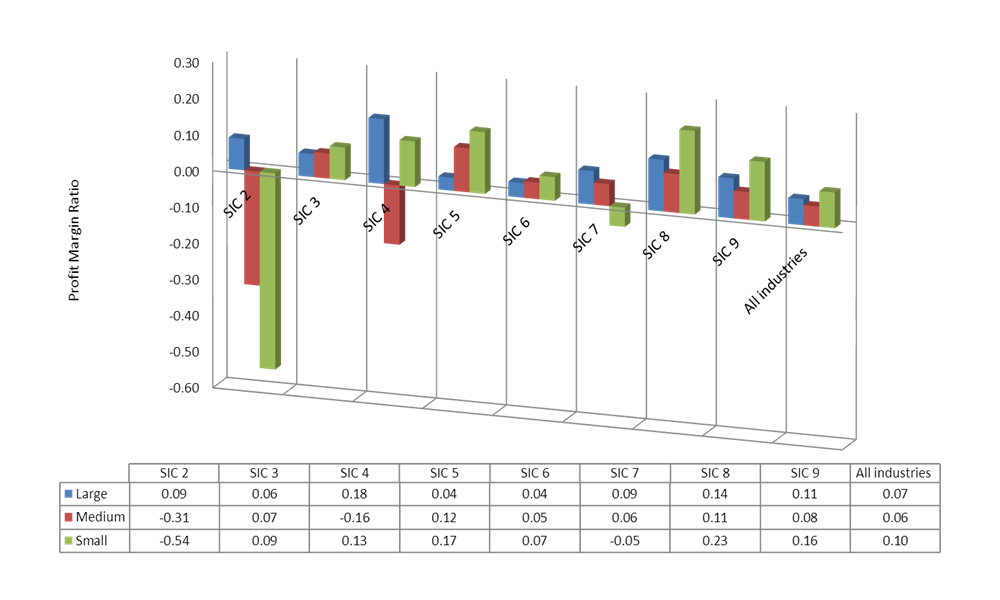
Figures 2 and 3 below illustrate the calculation of the profit margin ratios for enterprises that fall into different size group categories. The profit margin ratio for all industries indicated positive values, increasing from the March 2013 quarter to the June 2013 quarter. Medium size enterprises in the all industry category showed the largest increase in the profit margin ratio,from 0,03 to 0,06, followed by small size enterprises, which increased from 0,08 to 0,10.
Users can also examine the profit ratios for an industry and size group of their choice. For example, in the real estate and other business services industry, the profit ratio for the industry was unchanged at 0,18 between the March 2013 and June 2013 quarter, indicated in Figure 1. However, the calculated ratios for the small, medium and large size companies in the same sector indicated that the profit ratio for large enterprises remained unchanged, at 0,14, whereas for the medium and small size groups the profit margin ratios have changed. The medium size enterprises showed a decrease in this ratio, from 0,18 to 0,11, while small size enterprises showed an increase, from 0,22 to 0,23 (see Figures 2 and 3).
Figure 2: Profit margin ratio for small, medium and large enterprises: March 2013
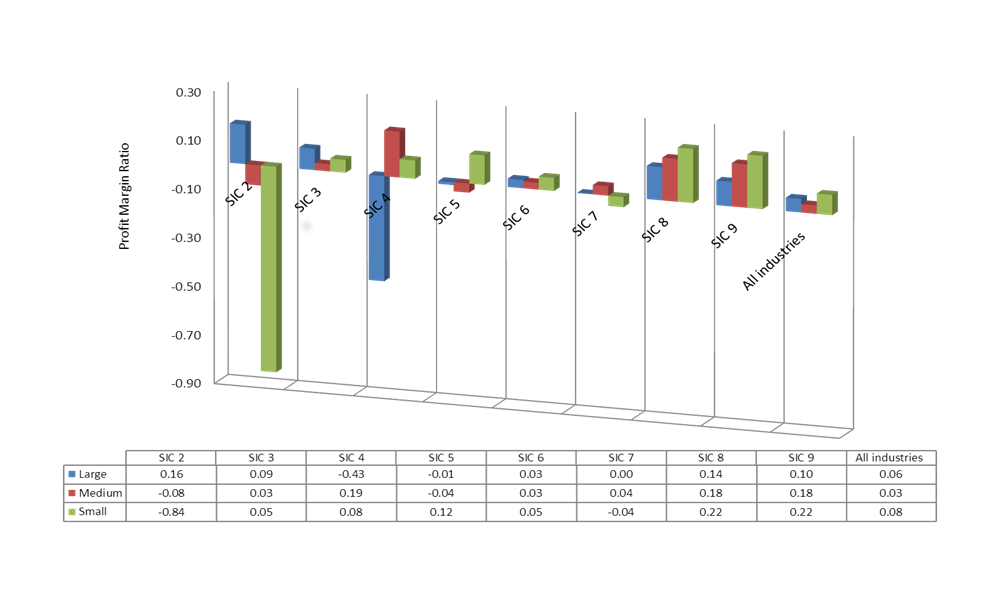
Figure 3: Profit margin ratio for small, medium and large enterprises: June 2013
The results of the QFS survey (which covers a sample of 5000 private and selected public enterprises operating in the formal business sector of the South African economy, excluding agriculture, financial intermediation, insurance and government institutions) are published three months after the reference quarter. The QFS publication also allows for various other types of analysis, using the different variables contained therein. Readers are encouraged to delve into the various relationships using the QFS data, either at the aggregated or small, medium and large diasggregated level (the data being accessible from the Stats SA website). Estimates for small, medium and large categories for each industry are available in Excel and are published at the same time as the QFS statistical release.
Data source: Quarterly financial statistics (P0044), obtainable from the Stats SA website: www.statssa.gov.za
Keywords:
Financial statistics
Private sector
Quarterly Financial Statistics
Profit ratio
Ratio analysis
Author: Krisseelan Govinden