
Consumer inflation lowest in two years
Annual consumer inflation slumped to 4,7% in July from 5,4% in June. This is the lowest reading since July 2021, when the rate was 4,6%.

Consumer prices increased on average by 0,9% between June 2023 and July 2023. This is up from the monthly rise of 0,2% recorded in both May and June.
Transport taps the brakes on overall inflation
Previously a major upward driver of inflation, the transport category helped pull overall inflation down in July.
In 2021 and 2022, overall inflation was mainly pushed higher by transport, as shown in the chart below. Headline consumer inflation hit a 13-year high of 7,8% in July 2022, with transport contributing 44% (3,4 percentage points) to the headline rate.
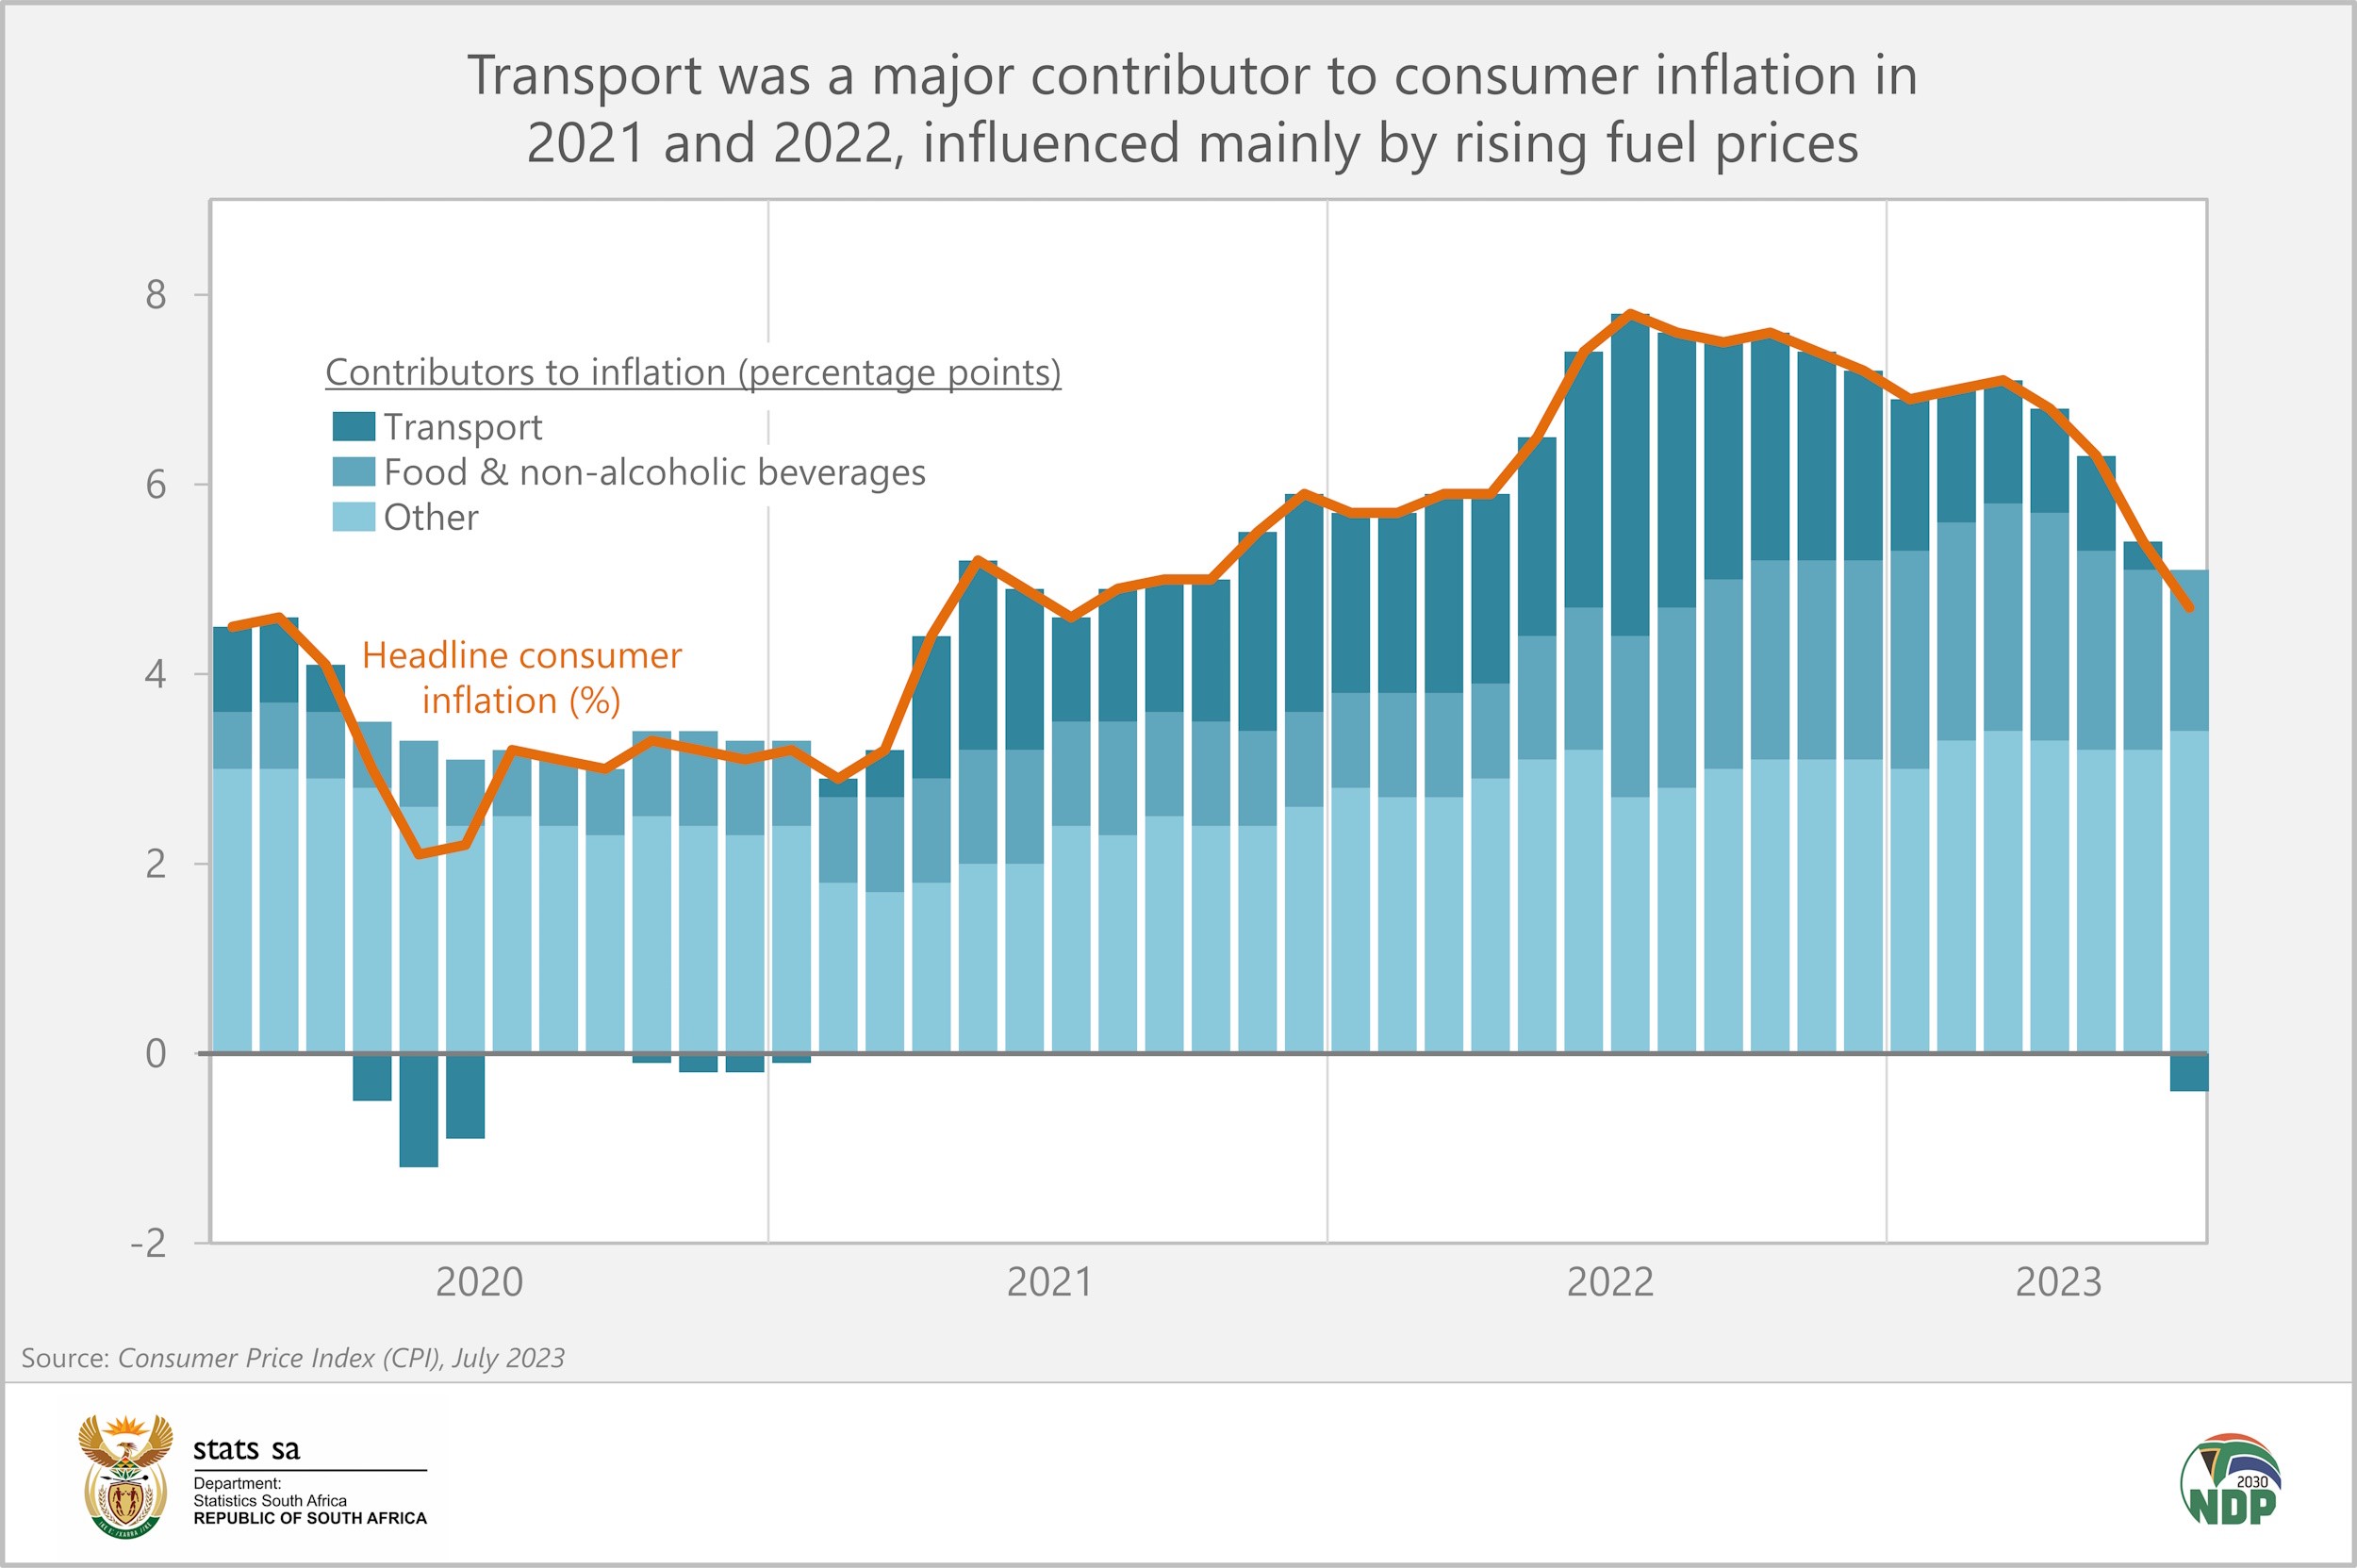
Fuel prices were largely to blame. In July 2021 the price of inland 95-octane petrol was R17,39 per litre, increasing sharply to a record high of R26,74 per litre in July 2022.1 Such was the impact of fuel that South Africa’s inflation rate would have been 5,5% instead of 7,8% in July 2022 if fuel prices were stable, according to Stats SA’s analytical series.2
After peaking in July 2022, fuel prices began to ease. Inland 95-octane petrol receded to R22,46 per litre in July 2023. For a vehicle with a 50-litre fuel capacity, this translates to a saving of R214.
The decline in fuel prices weakened the upward push of transport on consumer inflation. The annual rate for fuel was negative at -16,8% in July 2023. This dragged the transport category down into negative territory for the first time since January 2021. This also occurred in 2020 when annual transport inflation was negative from April to June and again from October to December.
Bread & cereals and meat inflation soften further
Food inflation has also eased, but not as quickly as transport. The annual rate for the food & non-alcoholic beverages (NAB) category was 9,9% in July, lower than June’s print of 11,0%. Annual inflation for bread & cereals slowed to 13,1% from 15,5% in June. Maize meal, an important staple, was cheaper in July compared with June, with prices falling on average by 0,7%.
Annual meat inflation declined for a fifth consecutive month, easing to 5,1%.
Resisting the downward trend: Dairy, beverages, and sugar, sweets & desserts
The annual rate for milk, eggs & cheese increased to 14,4% from 14,1% in June. Cheese prices are rising sharply, with large annual increases recorded for cheese spread (up 19,5%), cheddar cheese (up 19,0%) and Gouda cheese (up 16,6%).
Annual inflation for hot beverages steamed to 9,0% in July from 8,7% in June, with the rate for instant coffee increasing from 10,3% to 11,5%.
If it wasn’t bad enough for coffee drinkers to fork out more for their caffeine fix, sugar prices were up too. White sugar is on average 20,8% and brown sugar 22,8% more expensive than a year ago. The sugar, sweets & desserts category recorded an annual inflation rate of 18,7%, up from 16,4% in June. This is the highest reading for this category since May 2017.
Inflation for alcoholic beverages is also picking up. The annual rate for the category increased to 7,8% in July from 6,9% in June. Annual wine inflation edged higher to 9,8% and beer saw its rate bubble up to 7,4%.
Increases in electricity, water and property rates
Stats SA surveys municipal tariffs every year in July and August. The housing and utilities index increased by 2,8% between June and July. On average, households are paying 14,5% more for electricity. Water tariffs increased by 9,6% and property rates by 2,9%. A final picture will emerge in the August consumer price index (CPI) release with the completion of the survey.
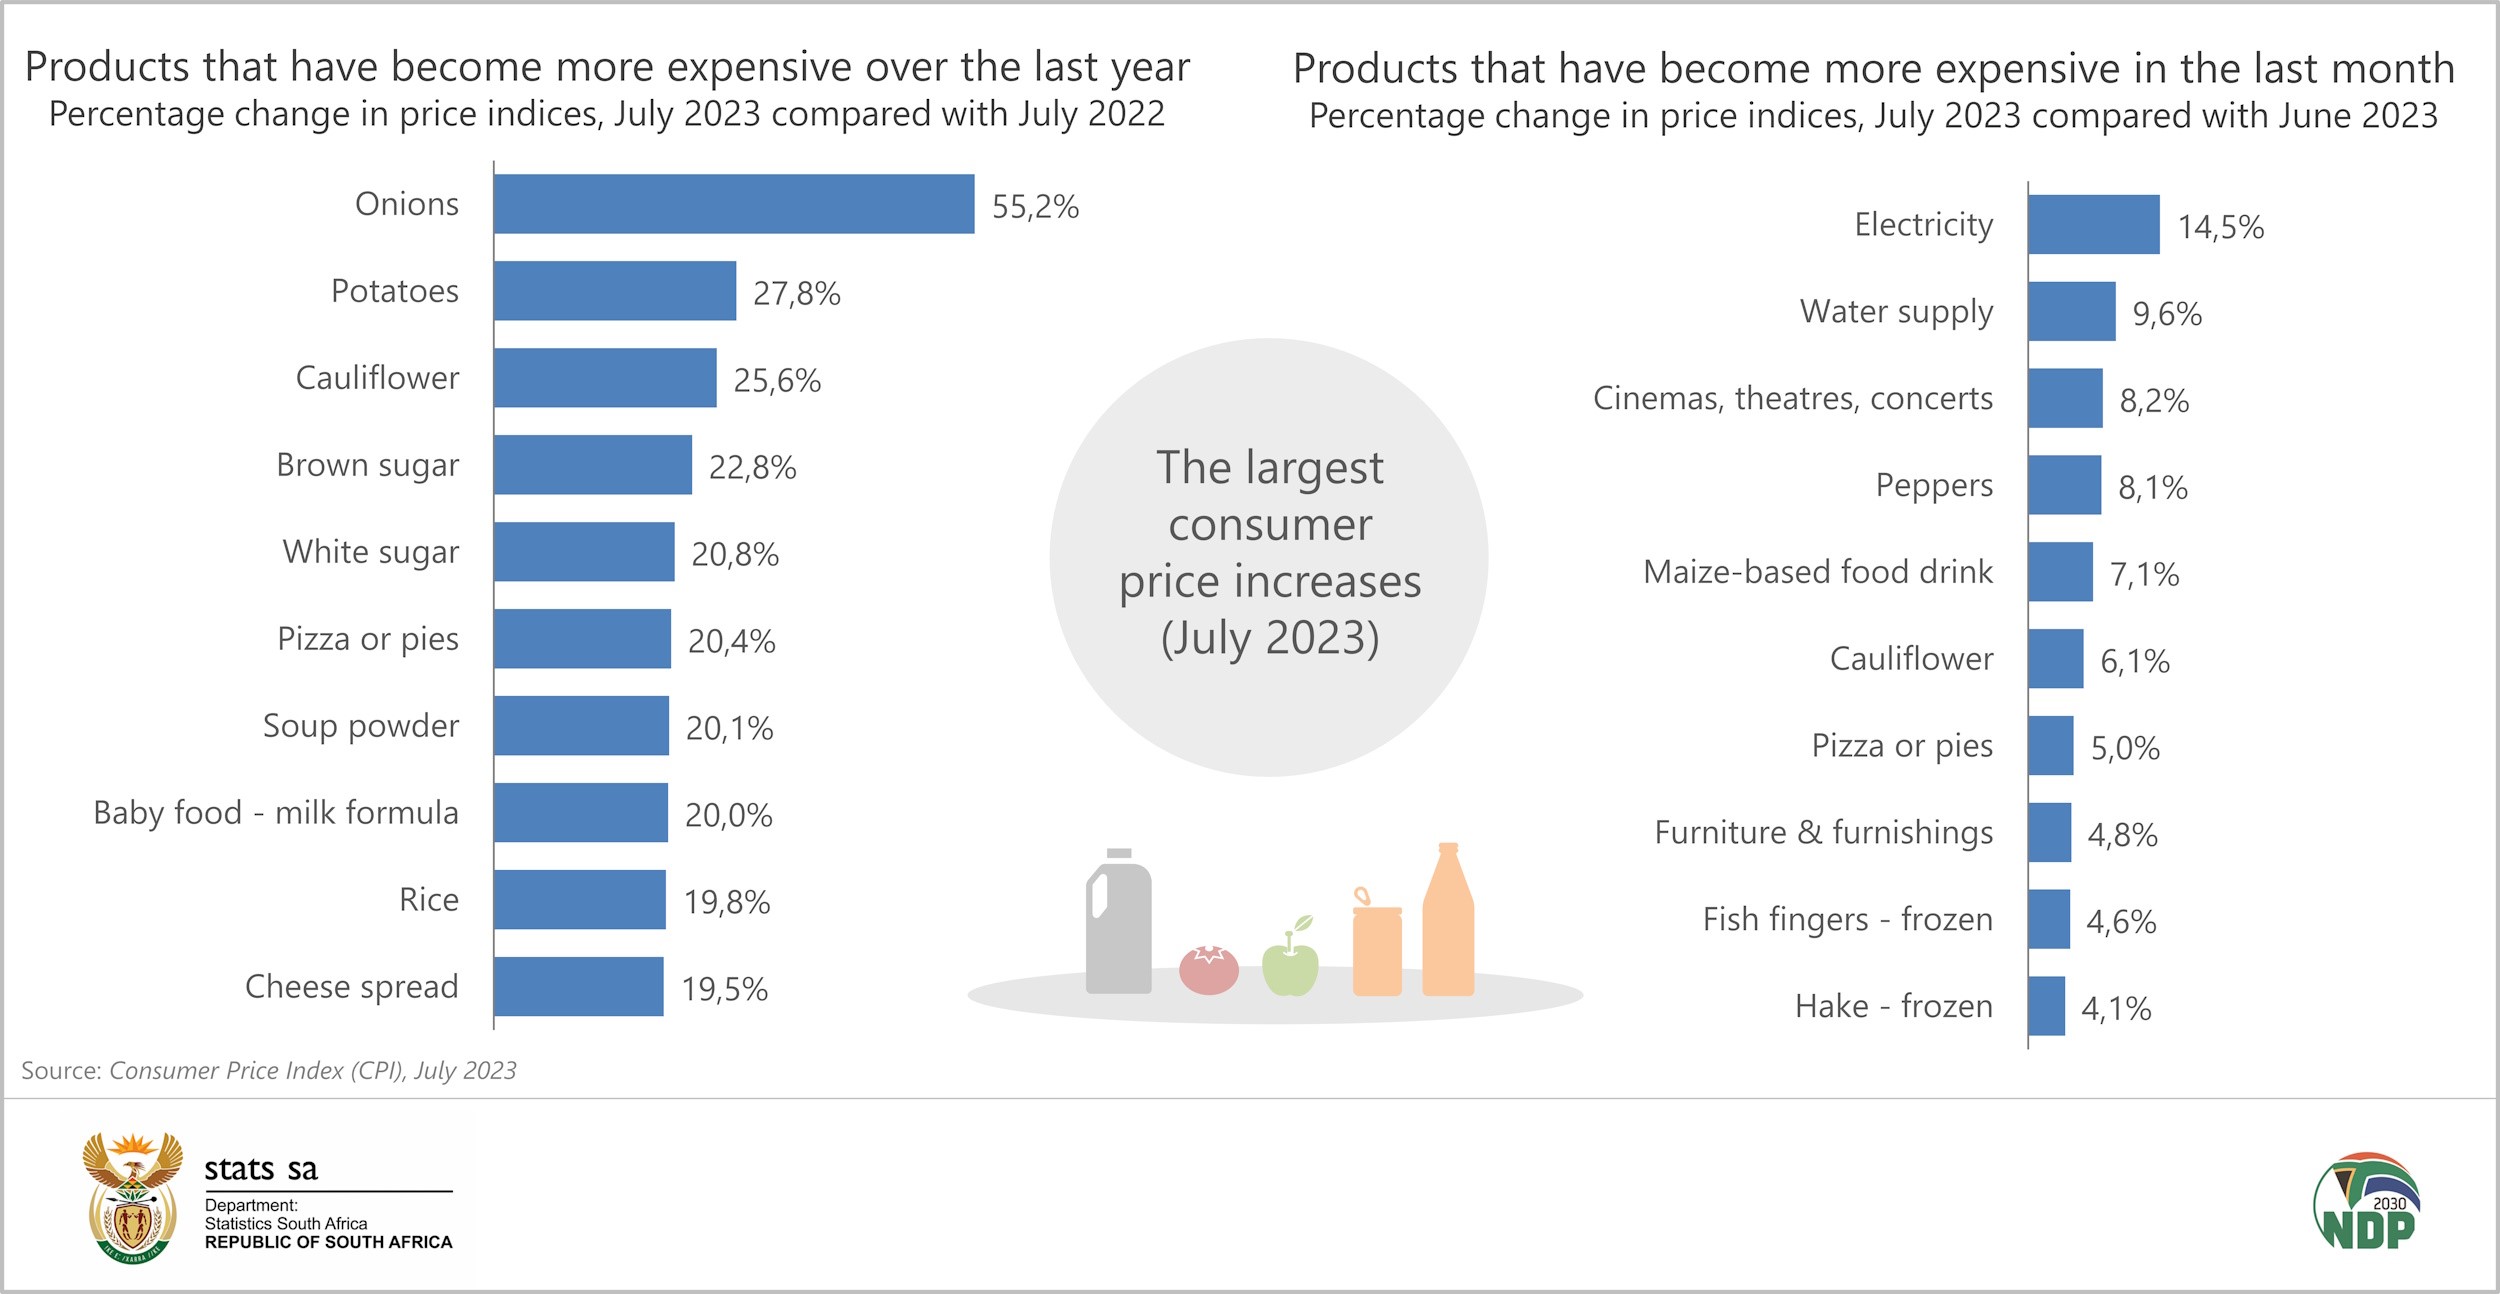
The largest price increases in the month
The graphs below show where consumers are currently feeling the pinch, listing the products that recorded notable price increases in July.
For more information, download the July 2023 CPI statistical release and Excel files with indices and average prices here. The archive is available here.
1 Department of Mineral Resources and Energy. Comparing prices for petrol, diesel and illuminating paraffin (IP) (click here).
2 The analytical series teases out the impact that specific goods and services have on overall inflation. The series are available in Table A in the CPI statistical release.
Similar articles are available on the Stats SA website and can be accessed here.
For a monthly overview of economic indicators and infographics, catch the latest edition of the Stats Biz newsletter here.