
Inflation slows to 13-month low
Headline consumer inflation cooled for a second consecutive month in May to 6,3% from 6,8% in April. May’s reading is the lowest since April 2022 when the rate was 5,9%.
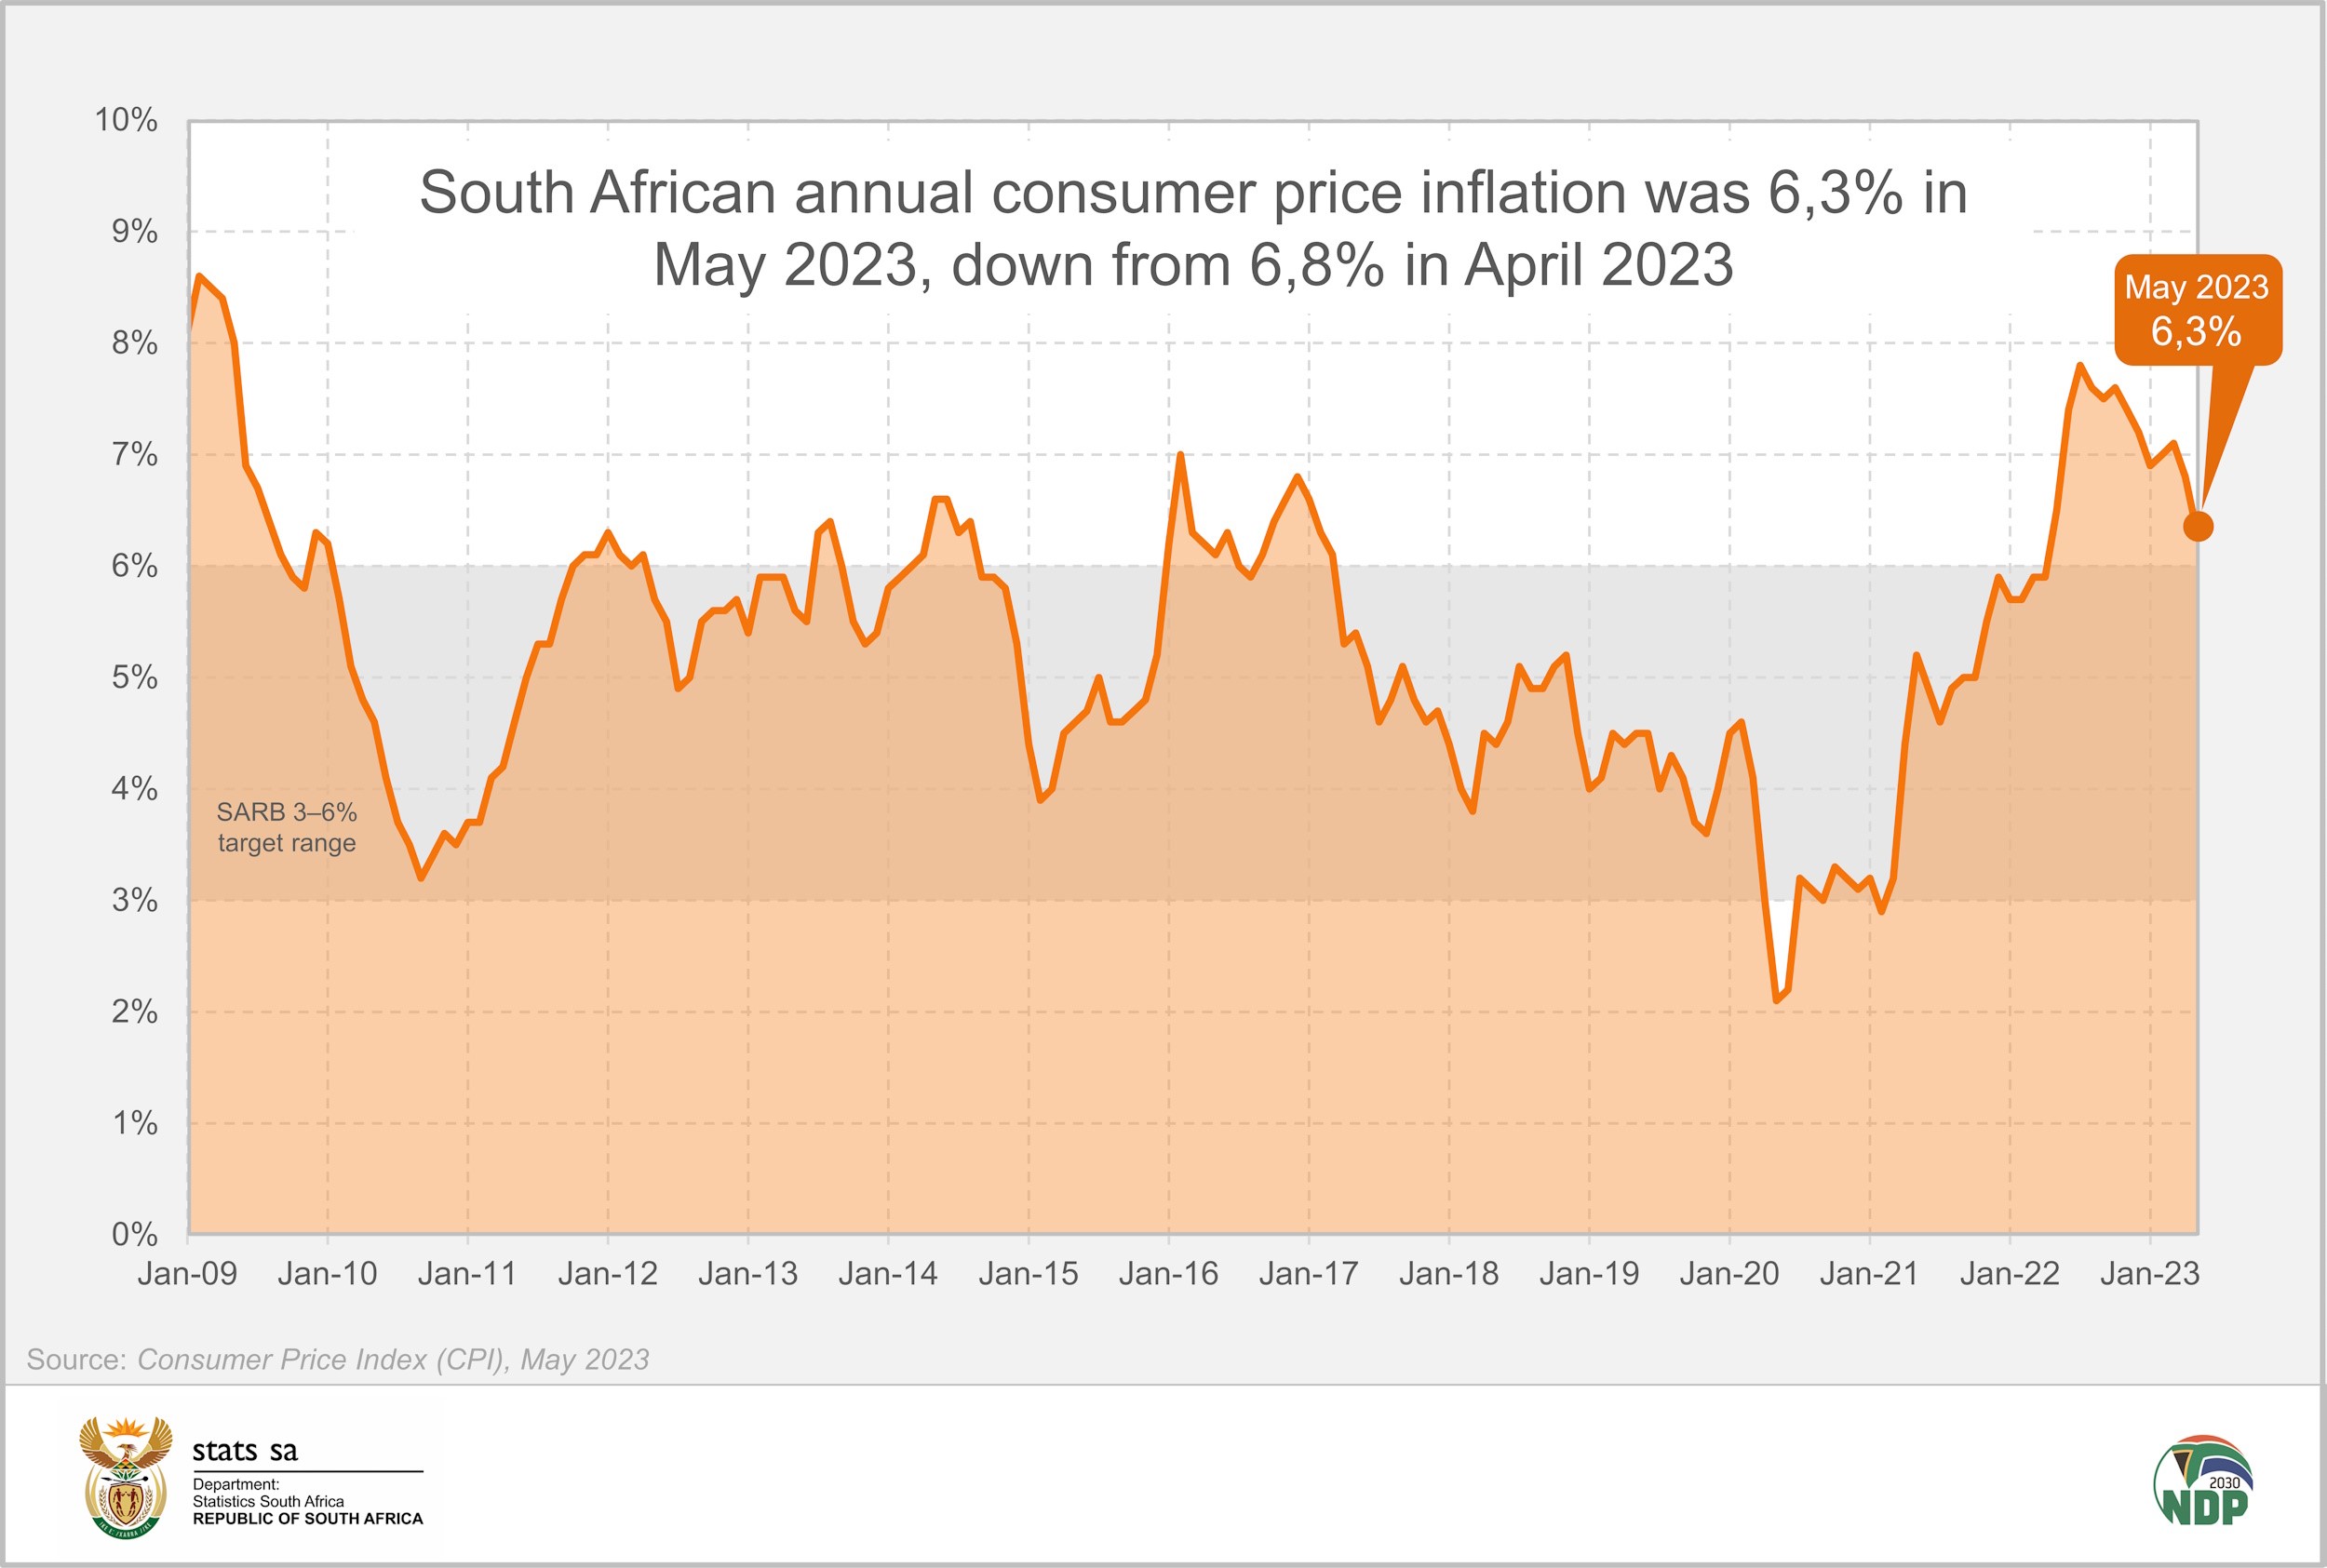
The month-on-month change in the consumer price index (CPI) was 0,2% in May.
The annual rate for food and non-alcoholic beverages (NAB) was 11,8%, lower than April’s print of 13,9%. The price index for this category increased by 0,3% between April and May, the lowest monthly reading since November 2021 (0,1%).
Most food and NAB categories recorded lower annual inflation rates in May, with the exception of sugar, sweets & desserts, and cold beverages.
Slower inflation for meat, oils & fats and bread & cereals
Annual meat inflation slowed to 7,1% from 9,5% in April. On average, meat prices declined by 0,4% between April and May, with notable monthly decreases recorded for stewing beef (down 2,4%), pork (down 1,4%) and beef mince (down 1,3%).
After peaking at an annual rate of 37,6% in August 2022, the index for oils & fats continued to fall sharply in May, recording a ninth consecutive month of decline. Prices for oils & fats decreased by 2,2% between April and May, pulling the annual rate down to -2,4%.
Bread & cereals inflation slowed to 18,1% in May from 20,8% in April.
Prices leave a bitter taste for the sweet tooth
Prices for sugar, sweets & desserts increased by 11,9% in the 12 months to May, up from April’s 10,7%. The reading in May is the highest since July 2017 when the rate was 14,5%.
White sugar increased sharply by 2,7% and slabs of chocolate by 2,9% between April and May. In the 12 months to May, the average price of a 2,5 kg bag of white sugar increased from R49,68 to R53,00. The average price of a slab of chocolate (80 grams) rose from R17,11 to R20,26 over the same period.
Those who enjoy fizzy drinks, mineral water and fruit juices have also had to dig deeper into their pockets. The cold beverages category recorded an average annual price increase of 10,5% in May, creeping up from 10,3% in April. May’s reading is the highest since March 2019 (13,1%).
Dining out has become more popular, but more pricey
Households have recently rekindled a liking for restaurants and hotels, according to the latest gross domestic product (GDP) figures. Increased household expenditure in the first quarter of the year was mainly driven by spending on restaurants and hotels, which jumped by 6,9%.1 This rise is in real terms (constant 2015 prices and seasonally adjusted).
Price data for May shows annual inflation for the restaurants & hotels category accelerating to 6,4% from 5,1% in April. Restaurant prices rose by 1,2% between April and May. This took the annual rate for restaurants to 7,4% from 7,1% in April.
Restaurant products with the highest annual increases in May were fish and seafood (up 11,3%), pizza (up 9,3%) and red meat-based products (up 9,0%). Products with large month-on-month increases in May were pies (up 2,3%), hot beverages (up 1,9%), poultry-based products (up 1,8%), hamburgers (up 1,6%) and red meat-based products (up 1,5%).
Other notable price changes in May
The transport index increased by 7,0% in the 12 months to May. This was lower than April’s print of 7,6%. Annual motor vehicle inflation accelerated to 7,5% from 7,2% in April. This is the highest reading since February 2017 when the rate was 8,1%.
The annual rate for fuel decreased further in May, cooling to 3,5% from 5,0% in April.
Annual health inflation has ticked up since January 2023 – when the rate was 4,8% – to reach 5,8% in May. This was mainly the result of higher prices for medical products, which recorded an annual rate of 5,8% (up from 4,8% in April).
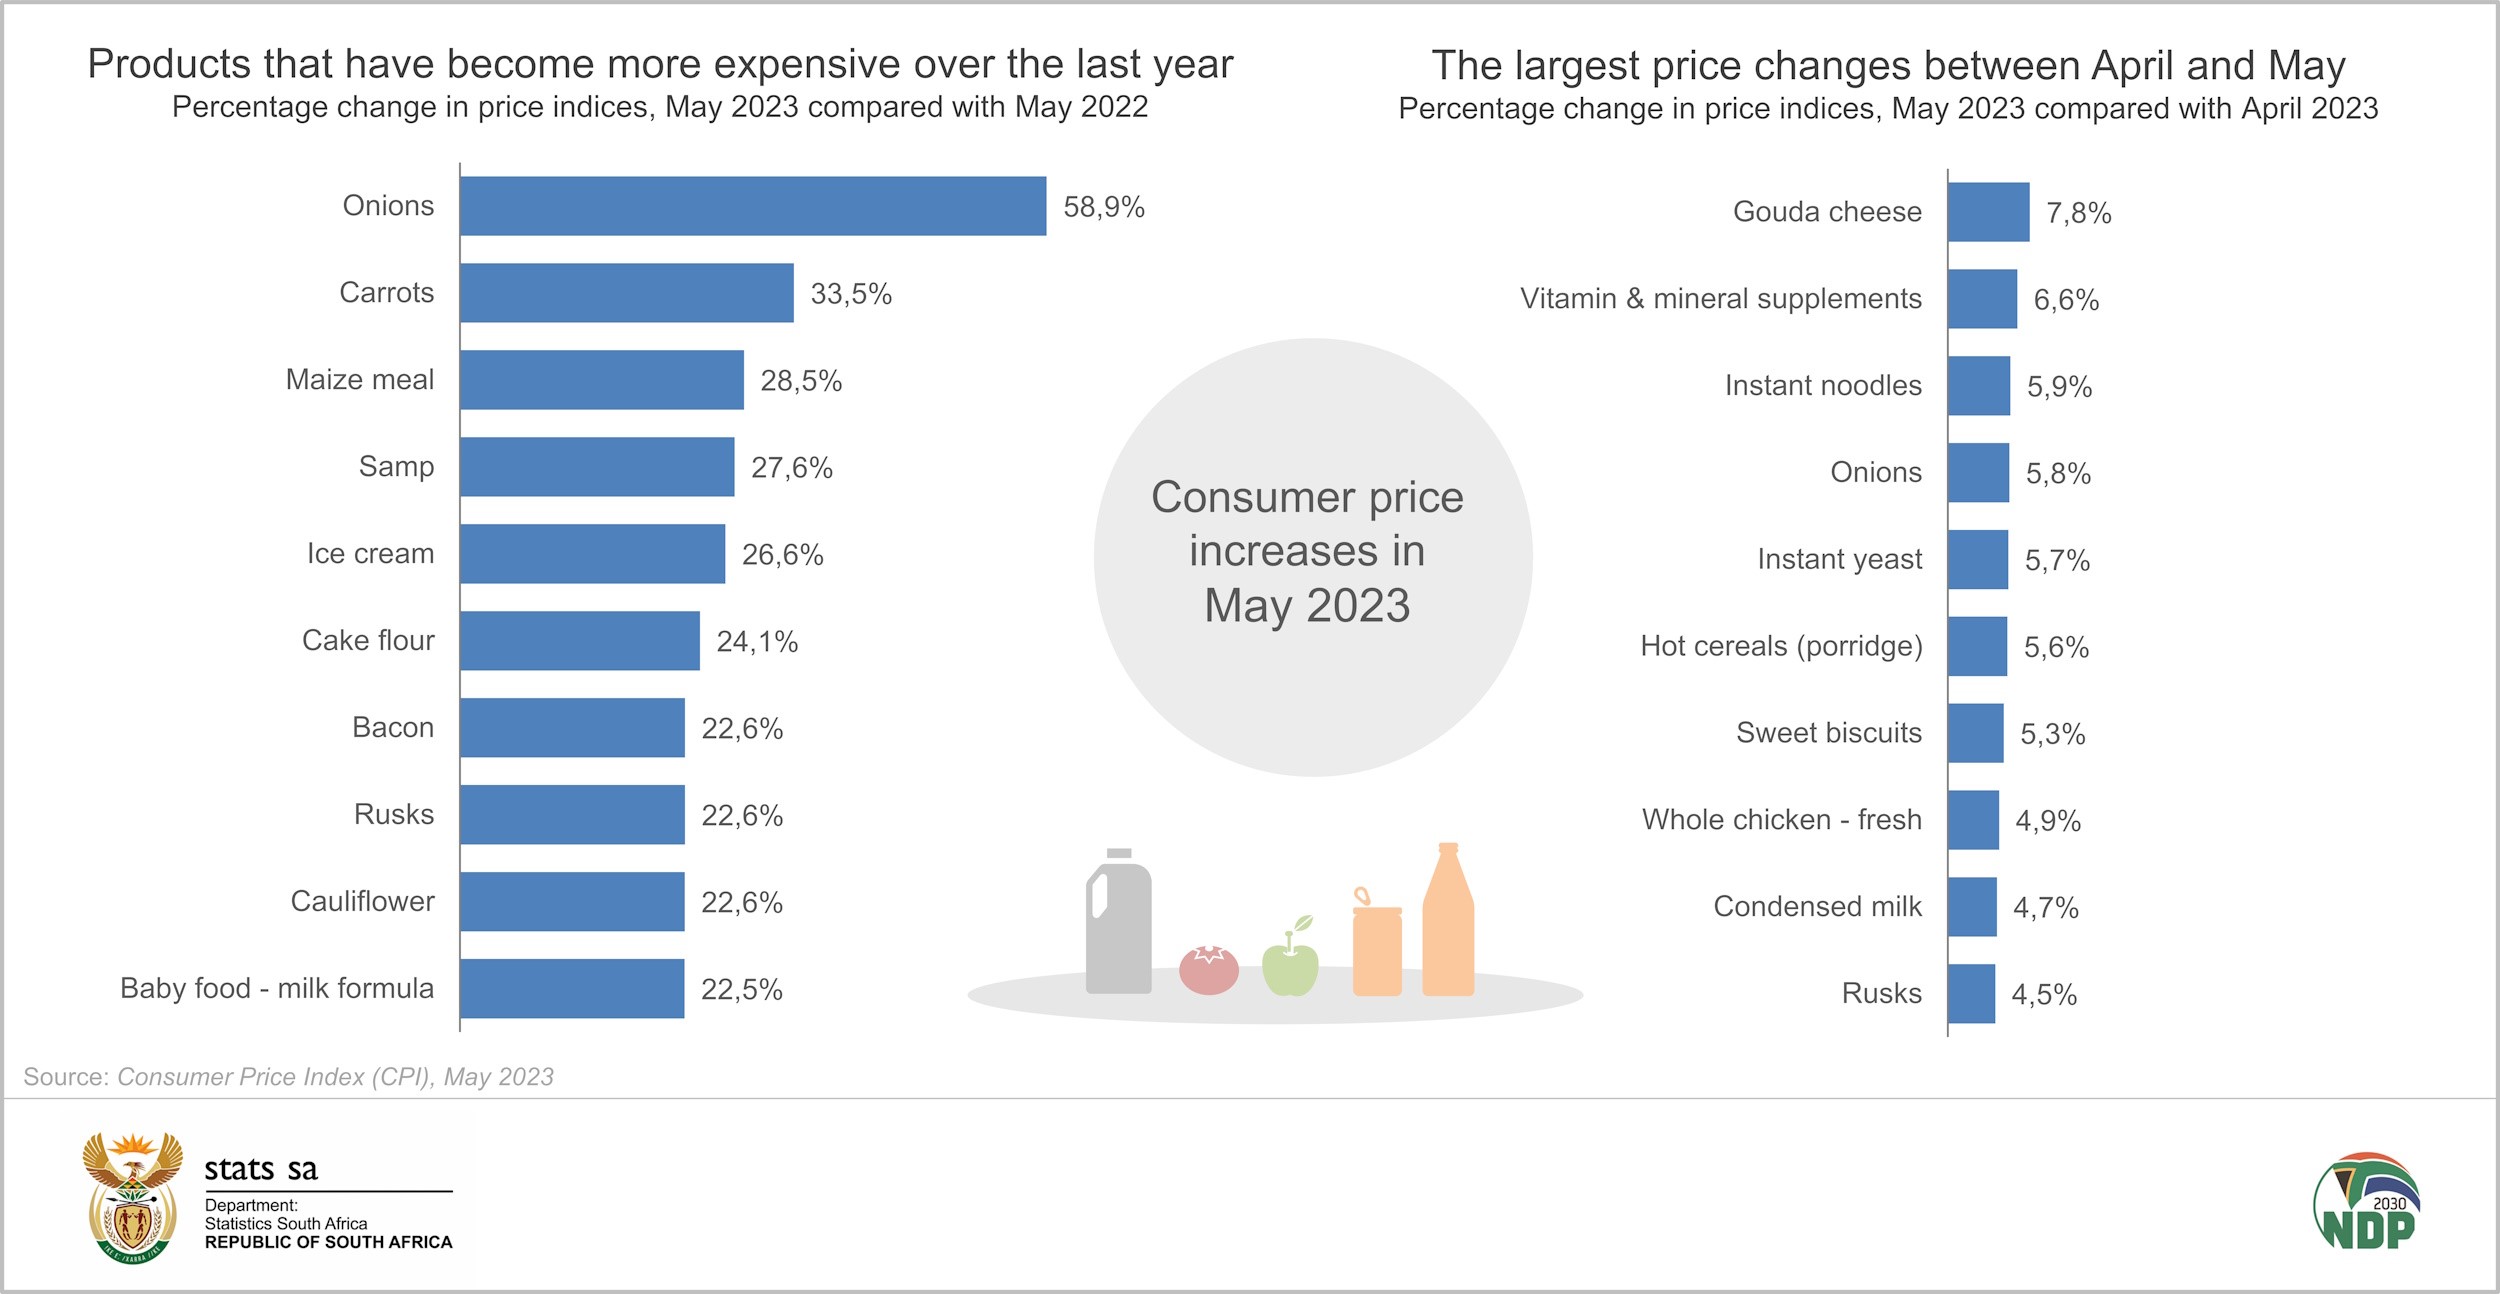
Notable monthly price increases were recorded for pain killers (up 3,0%) and vitamin & mineral supplements (up 6,6%).
The graphs below show the products that recorded notable price increases in May.
For more information, download the May 2023 CPI statistical release here. The archive is available here.
1 Stats SA, Gross domestic product (GDP), 1st quarter 2023, Media presentation, slide 24 (download here).
Similar articles are available on the Stats SA website and can be accessed here.
For a monthly overview of economic indicators and infographics, catch the latest edition of the Stats Biz newsletter here.