

IMPROVING LIVES THROUGH DATA ECOSYSTEMS
How large is the small business footprint?
In 2015, Stats SA published an article highlighting the contribution that small businesses make to industry turnover in South Africa.1 The March 2019 Quarterly financial statistics (QFS) report provides an update.
The entire formal business sector2 generated R2,39 trillion in turnover in Q1: 2019. Out of this amount, large businesses contributed 62%, followed by small (29%) and medium sized businesses (10%).3
There are a few notable changes since the first quarter of 2015. Small business expanded its contribution to total turnover in the trade, transport, manufacturing and utility industries. Most notably, small businesses operating in transport generated 21% of that industry’s turnover in Q1: 2019, a rise from 14% in Q1: 2015 (click on the image to enlarge).
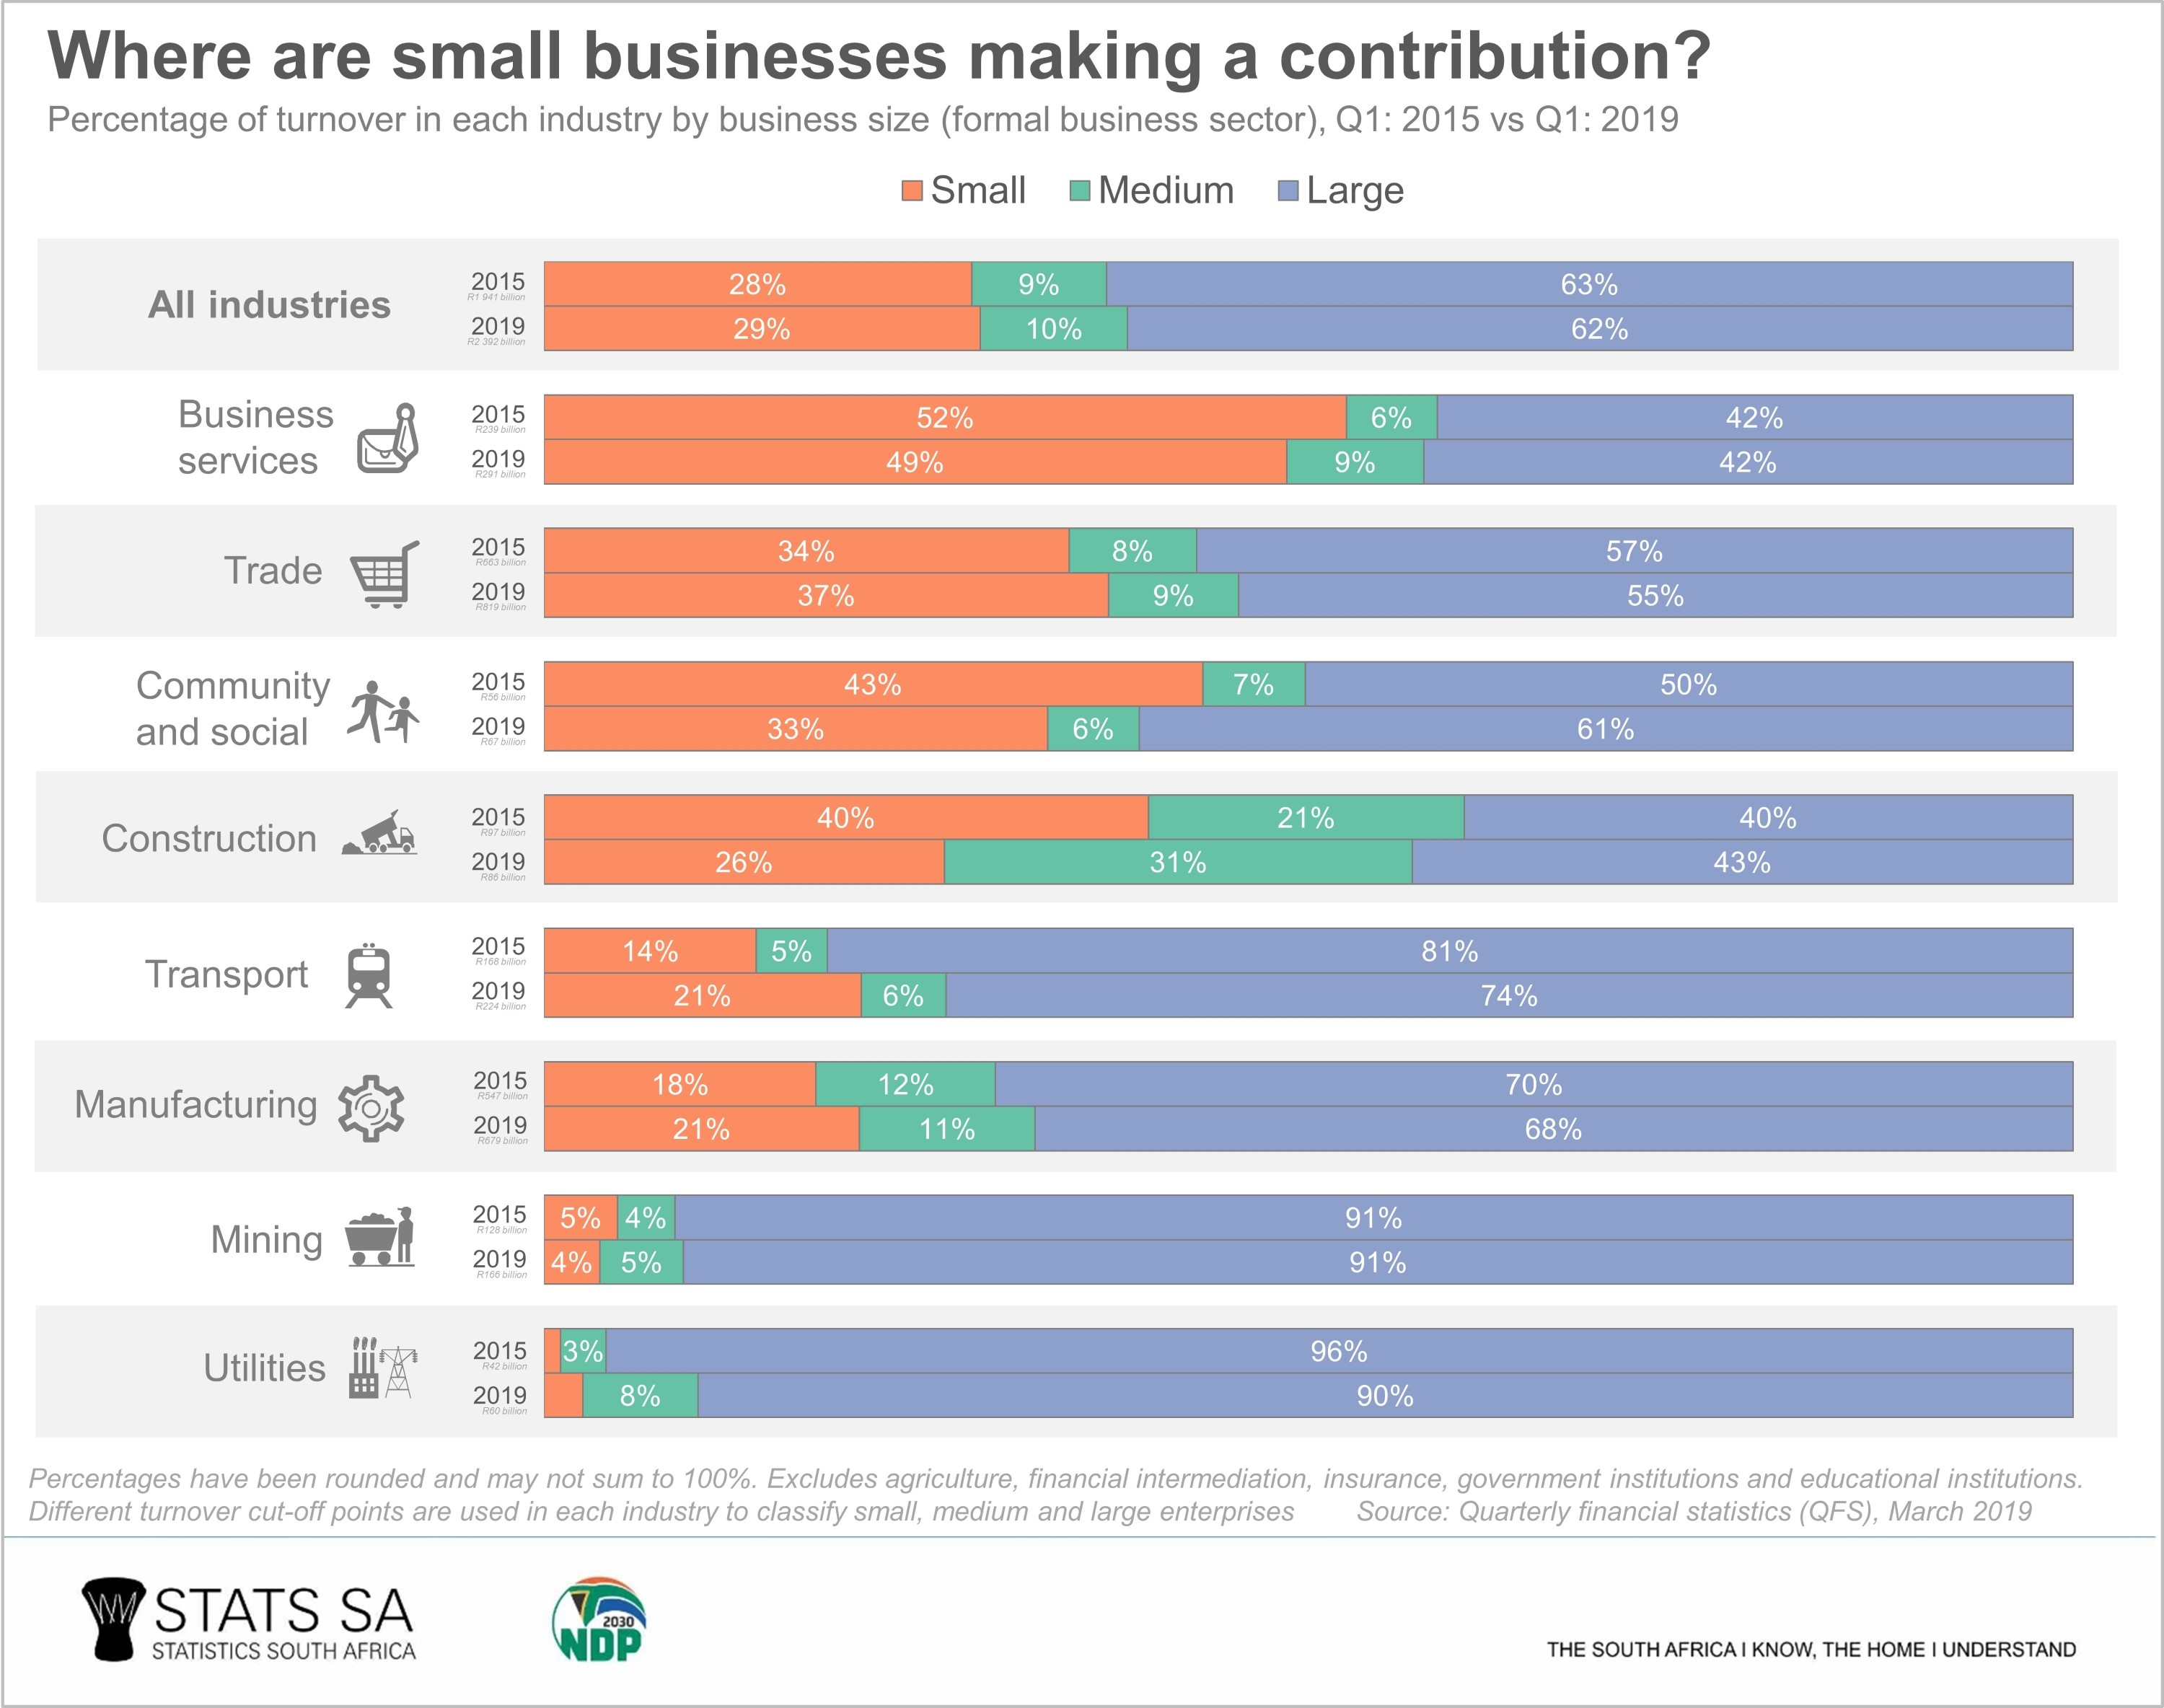
However, the influence of small businesses on turnover weakened in business services; community, social and personal services; construction; and mining. The shift in the construction industry is quite notable: from 40% in Q1: 2015 to 26% in Q1: 2019.
Small businesses generated more than a quarter of total turnover in business services; trade; and community, social and personal services in Q1: 2019. As was the case in 2015, these three industries are characterised by a large number of small players. Examples include hairdressers, dry cleaning services and veterinary clinics (community, social and personal services); lawyers and estate agents (business services); and corner cafés (trade).
Notice how the utilities industry is dominated by large businesses? Electricity producers and water suppliers are categorised here. Eskom, for example, is responsible for generating 91% of the nation’s total energy supply, as reported in the Electricity generated and available for distribution survey.4
The contribution of small businesses to turnover has fluctuated over time, increasing from 24% in Q1: 2009 to 32% in Q3: 2017. Since Q3: 2017, the contribution has edged slightly lower to 29% in Q1: 2019.
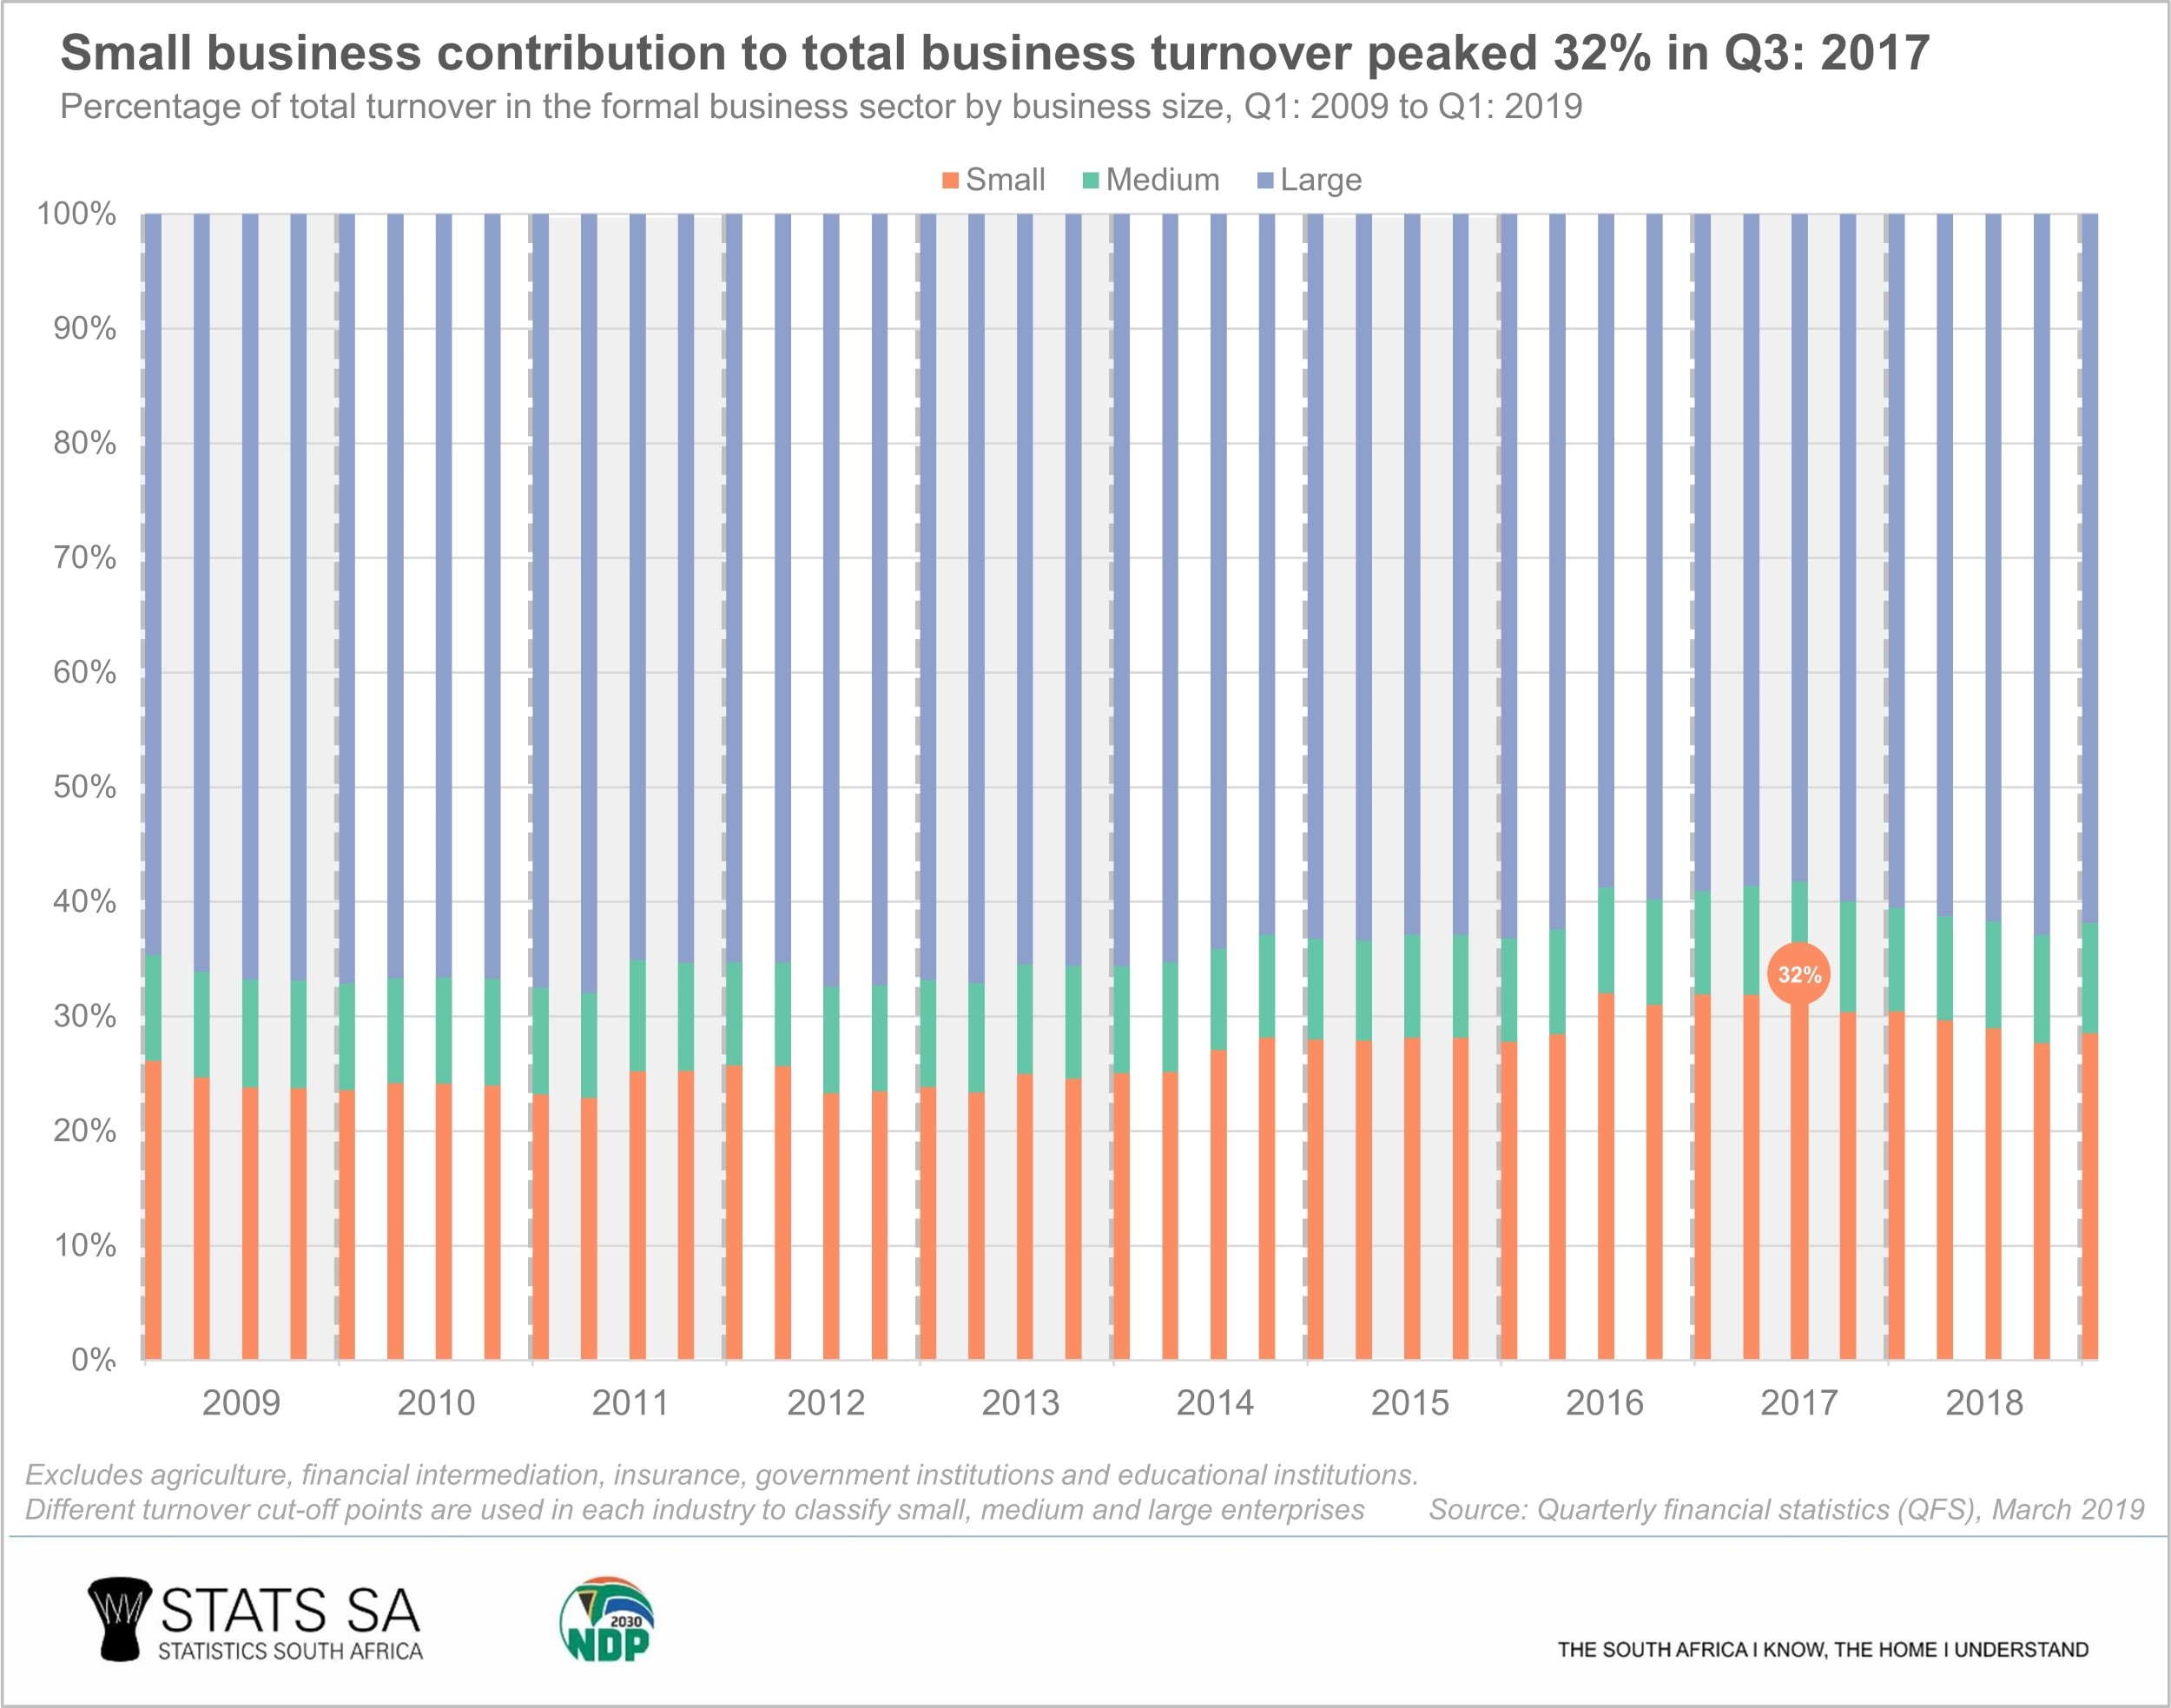
The Quarterly financial statistics (QFS) report is released on a quarterly basis. The survey draws on financial data from a sample of over 4 500 enterprises, providing detail on income and expenditure, inventories, capital expenditure, the carrying value of assets, and selected financial ratios. Additional releases will add to the time-series data shown in the chart above, providing future insight into the size of small business influence in our economy.
For more information, download the latest Quarterly financial statistics (QFS) report here.
1 Stats SA, Finding a home in a big pond (read here).
2 The formal business sector in this context refers to private businesses and public corporations covered by the Quarterly financial statistics (QFS) survey, which excludes agriculture, financial intermediation, insurance, government and educational institutions.
3 The size of each business is determined by its turnover. Different industries have different cut-off points, which are published in Table G of the Quarterly financial statistics (QFS) publication.
4 Stats SA, Electricity generated and available for distribution, March 2019, Table 7 (download here).