

IMPROVING LIVES THROUGH DATA ECOSYSTEMS
Five facts about poverty in South Africa
The Living Conditions Survey (LCS) is part of Stats SA’s household survey programme and provides detailed information on households’ living circumstances, as well as their income and expenditure patterns. Information from this survey was used to compile the report Men, Women and Children: Findings of the Living Conditions Survey 2014/15. Let’s take a look at some of the findings outlined in the report.
- Approximately half (49,2%) of the adult population were living below the upper-bound poverty line (UBPL).
According to the LCS 2014/15, there were 35,1 million adults (aged 18 years and older) in South Africa in 2015. When looking at the poverty headcount by sex using the UBPL, adult males and females experienced a headcount of 46,1% and 52,0%, respectively. Adult females experienced higher levels of poverty when compared to their male counterparts, regardless of the poverty line used.
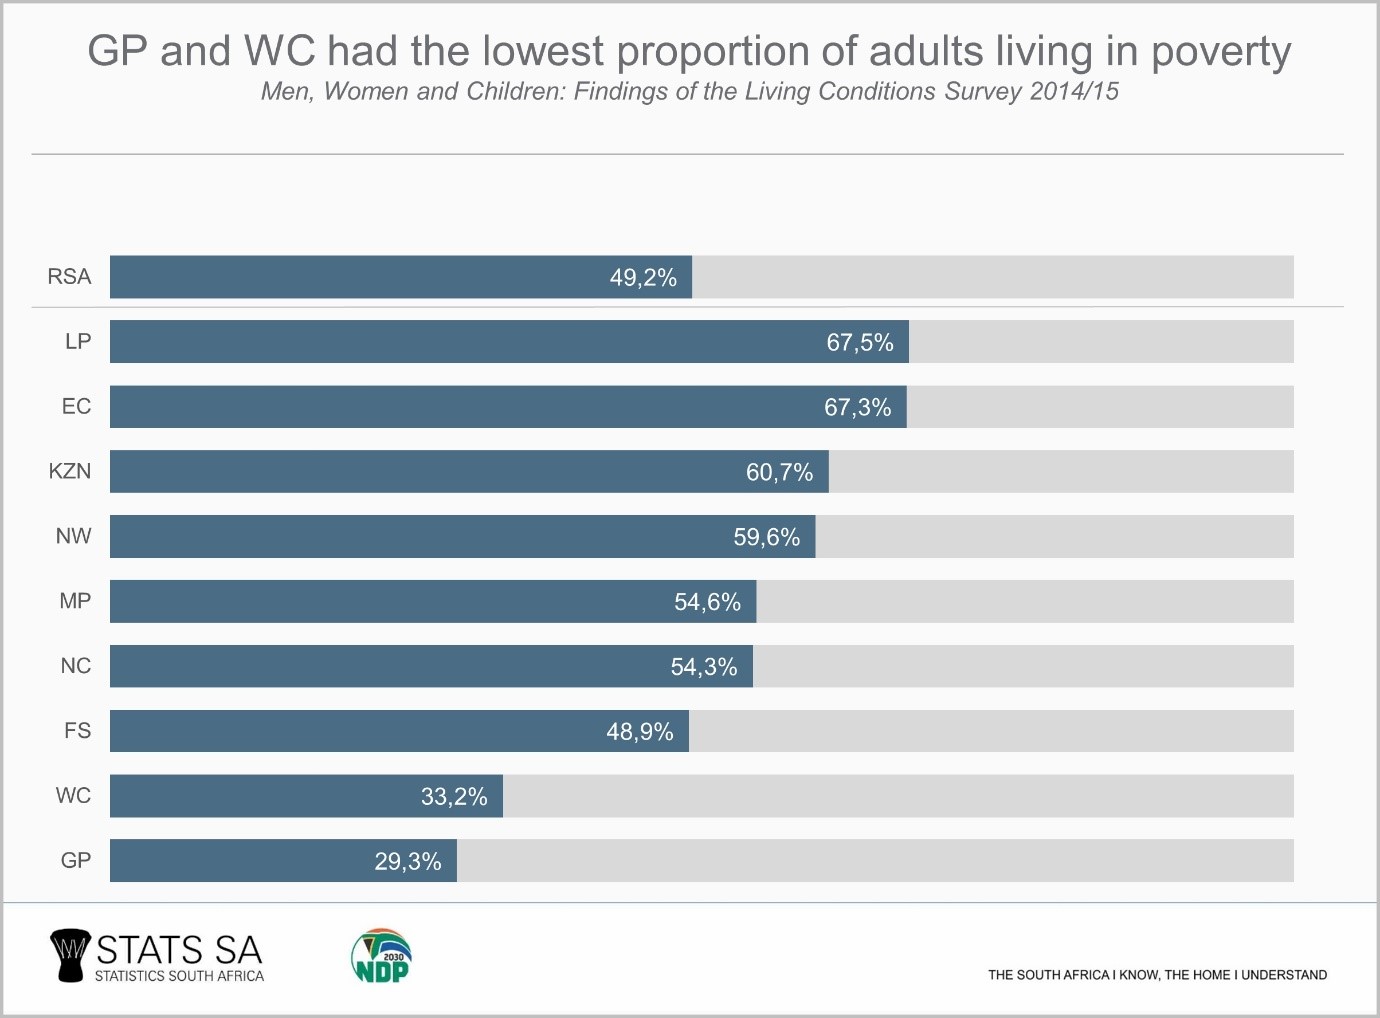
- Gauteng and the Western Cape had the lowest proportion of adults living in poverty (UBPL).
The provinces with the highest headcount of adult poverty are Limpopo (67,5%), Eastern Cape (67,3%), KwaZulu-Natal (60,7%) and North West (59,6%). For these four provinces, significantly more than half of their population were living in poverty. Gauteng and Western Cape had the lowest proportion of adults living in poverty at 29,3% and 33,2%, respectively.
3. Female-headed households mostly felt the experience of poverty.
According to the LCS 2014/15, approximately 40,0% of South Africans were living below the UBPL. The poverty gap (the distance away from the poverty line) and severity of poverty measures were larger for female-headed households compared to households headed by males. The proportion of females living below the UBPL was 16,9 percentage points more than that of households headed by males (49,9% versus 33,0%). Almost six out of every ten households headed by males (59,3%) compared to over seven out of every ten households headed by females (74,8%) in traditional areas were living under the UBPL.
4. Poor children were twice as likely to have no access to safe play areas.
Having a safe play area is fundamental for the healthy development and growth of a child. At the UBPL, more than half of non-poor children (53,7%) lived in neighbourhoods with safe play areas compared to just a quarter of poor children (25,7%)
5. Poor households headed by females had better access to housing and electricity, but not to water, sanitation and refuse removal services.
About 91,4% of poor male-headed households were connected to electricity compared to 95,2% of poor female-headed households. For poor female-headed households, 69,6% had full access to water compared to 71,7% of poor male-headed households.
For the full report, download the Men, Women and Children: Findings of the Living Conditions Survey 2014/15 here.