
Unpacking South Africa’s tourism workforce
When Stats SA published data in 2018 showing that one in every 22 working South Africans are employed in the tourism sector, it also provided additional tables showing how the tourism workforce is structured.
For the inquiring mind, these lesser-known tables on employment appear in the second half of the latest Tourism Satellite Account for South Africa report.1 You might notice two interesting facts from the data: tourism jobs are mostly concentrated in three industries, and racial/gender patterns vary across the sector.
Think back to the last time you travelled across country on holiday. Do you remember what your major expenses were? According to the data, road passenger transport is the single largest expenditure item for local tourists, taking up 27% of domestic tourism spend in 2017. Road passenger transport is the fourth largest expenditure item for international (inbound) tourists2.
It comes as no surprise then that the road passenger transport industry is the biggest employer, responsible for creating 30% of all tourism-related jobs in South Africa.
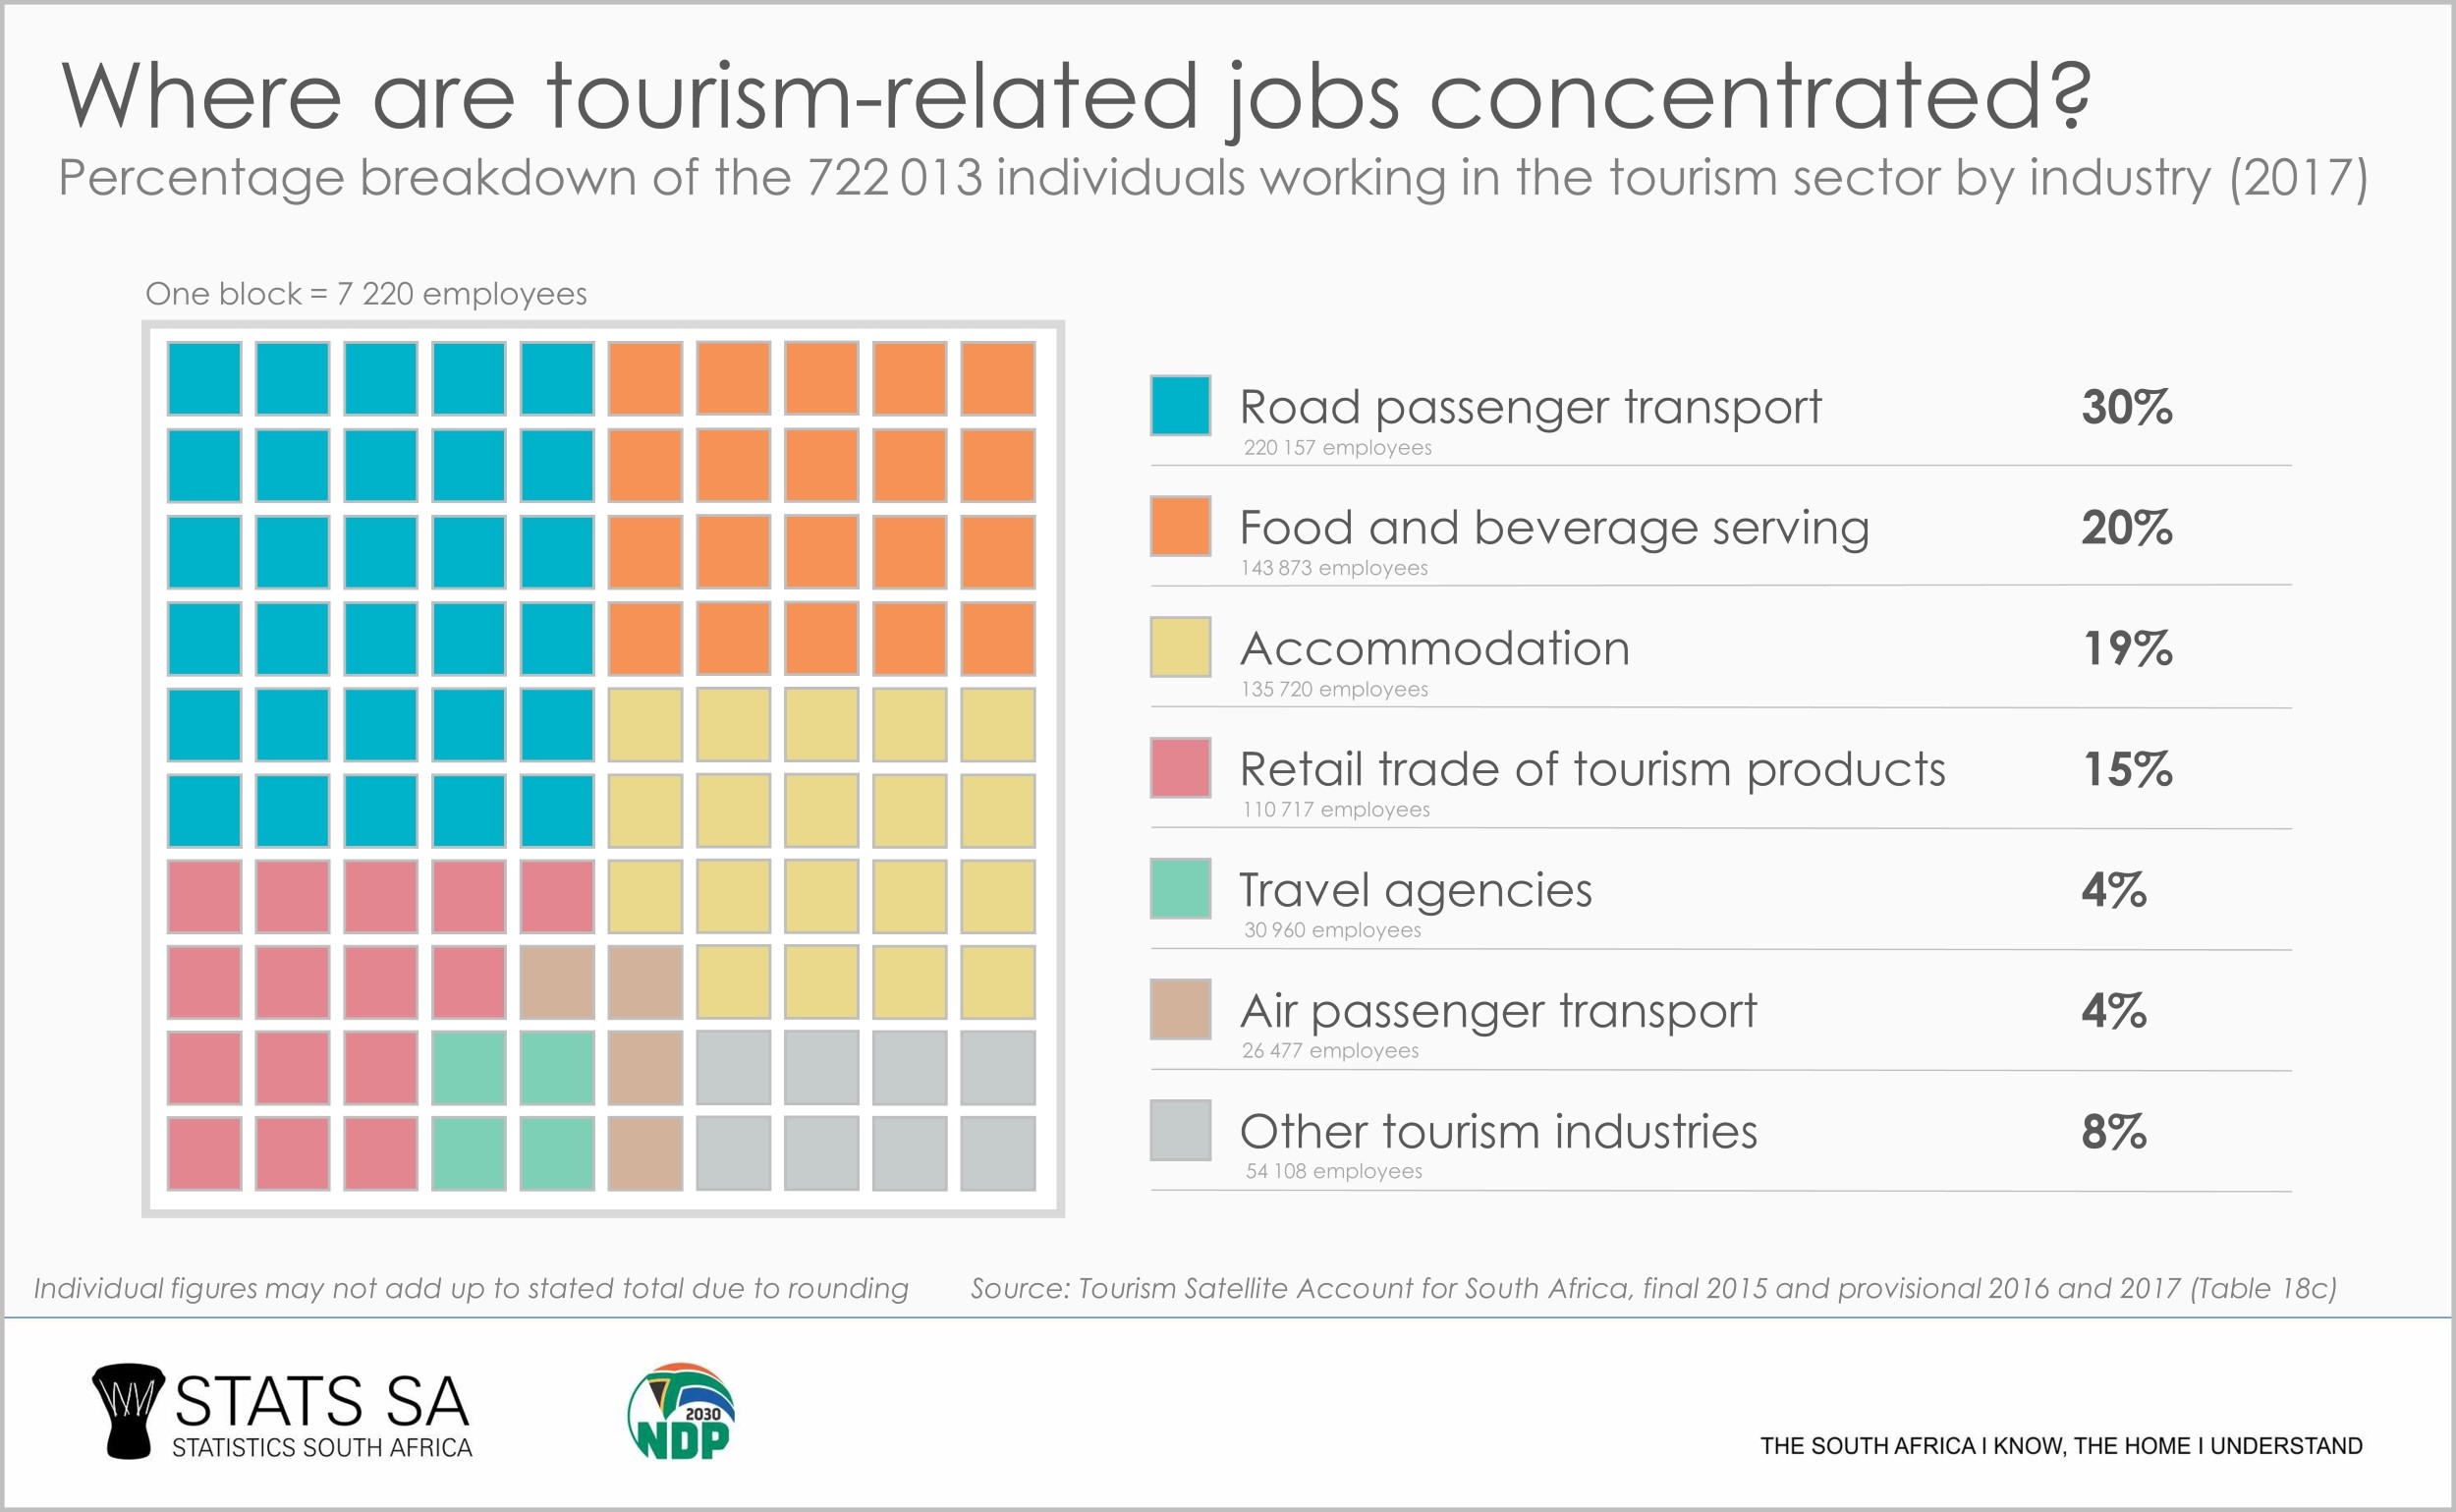
This industry includes car rental, buses, taxis, and the more exotic activities of ski-hill services and the tongue-twistingly named teleferic-funicular services.
If you’re curious about this last one, google the Flying Dutchman Funicular to see a South African example.
The food and beverage serving industry is the second biggest employer, followed by accommodation. Together, these three industries contributed almost 70% to total tourism employment in 2017.
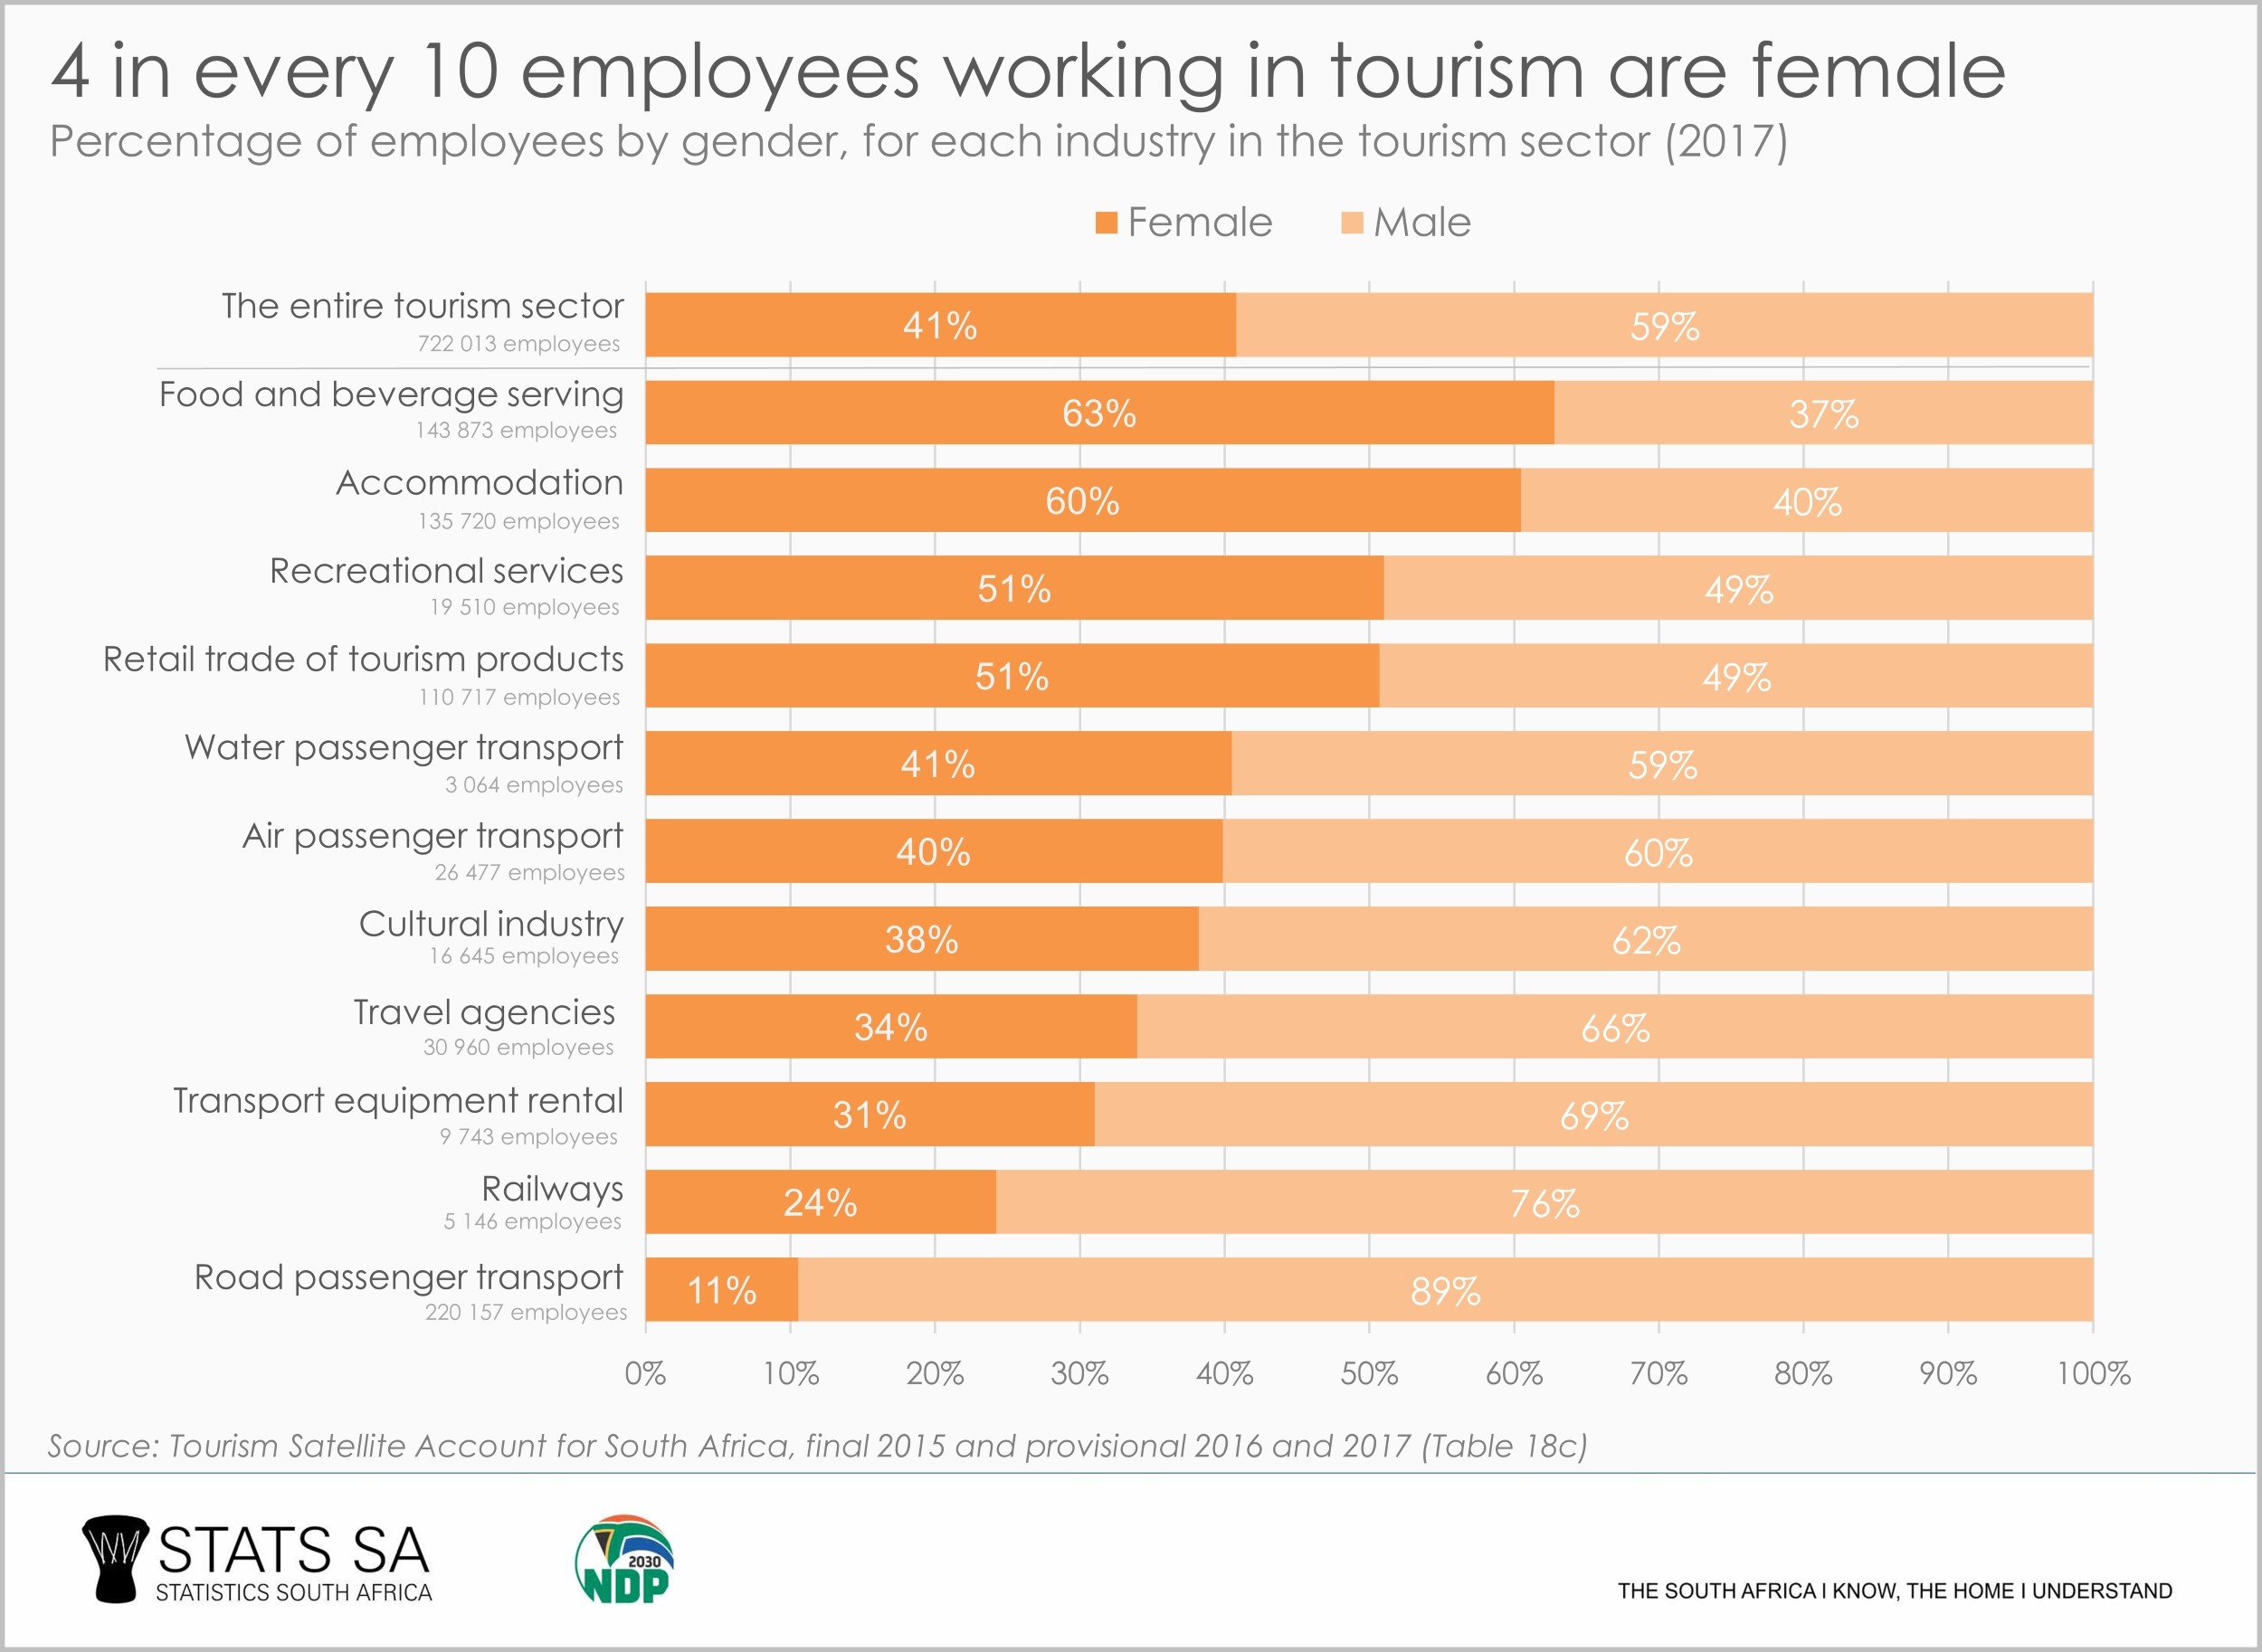
Road passenger transport is also notable for another fact: it is the industry that has the highest percentage of male employees in its tourism workforce. For every ten employees, nine are male.
The four industries that employ more females than males are the food and beverage serving industry, accommodation, recreation and retail. All other industries in the tourism sector – in particular road passenger transport, railways and transport equipment rental – have male-dominated workforces.
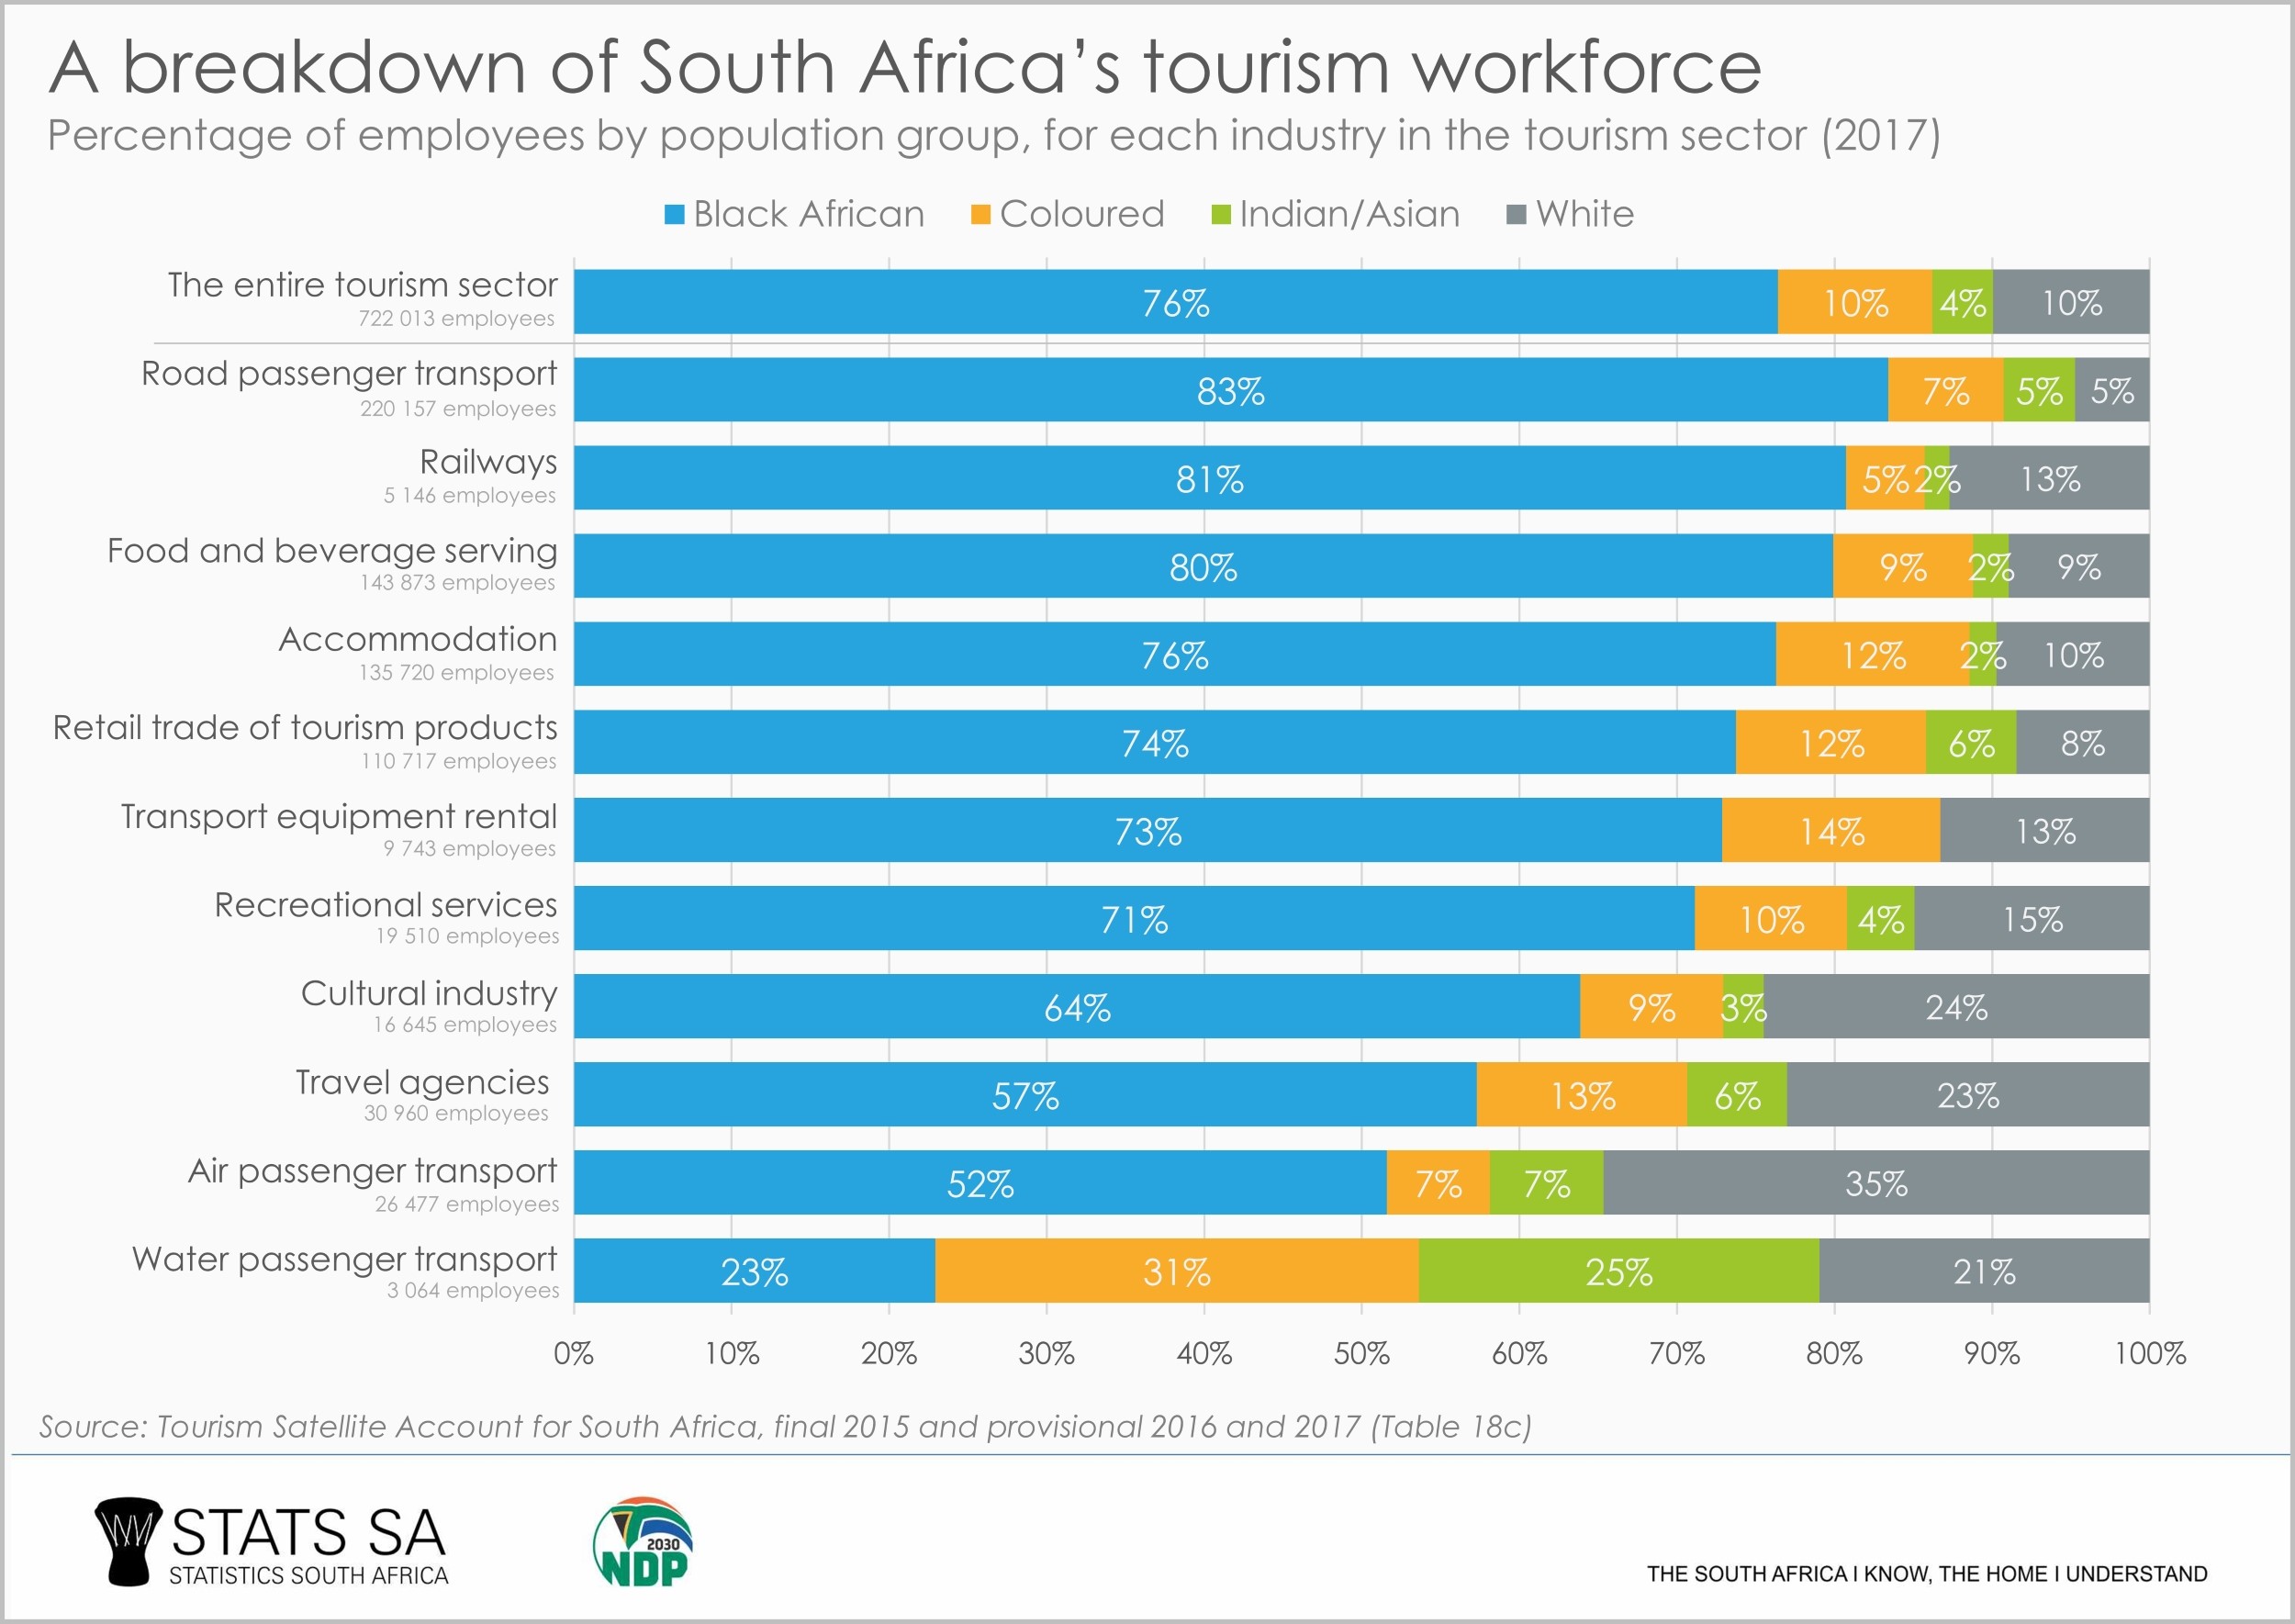
The road passenger transport industry has the highest proportion of black Africans in its tourism workforce, if the same data are broken down by race.
The air passenger transport industry, which consists of 26 477 tourism-related jobs, has the highest proportion of white employees. Scheduled flights, sightseeing, and rental services are a few of the activities that are included in this industry.
It must be noted though that the Tourism Satellite Account for South Africa report does not provide any indication of the skills levels of these employees, nor any information on the management positions that employees occupy.
When it comes to creating employment, the tourism sector has remained resilient despite tough economic conditions. Tourism generated almost 32 000 net new jobs in 2017.3 With the number of international tourists visiting our shores increasing from 10,0 million in 20164 to 10,3 million in 20175, the tourism sector looks set to remain an important driver of job growth in particular industries.
1 Stats SA, Tourism Satellite Account for South Africa, final 2015 and provisional 2016 and 2017, Table 18c (view here).
2 Stats SA, Tourism Satellite Account for South Africa, final 2015 and provisional 2016 and 2017, Table 6 (view here) and Table 8 (view here).
3 Stats SA, Tourism jobs grow despite sluggish economy (read here).
4 Stats SA, Tourism 2016, Appendix X (view here).
5 Stats SA, Tourism 2017, Appendix X (view here).
Similar articles are available on the Stats SA website and can be accessed here.
For a monthly overview of economic indicators and infographics, catch the latest edition of the Stats Biz newsletter here.